Exxon Mobil Corporation — XOM
| Close Price | Market Cap | P/E Ratio | Forward P/E Ratio | Implied Growth* | Implied Forward Growth* | Dividend | P/B Ratio |
|---|---|---|---|---|---|---|---|
| $145.26 | $602.10B | 24.5 | 13.6 | 13.8% | 7.6% | $4.12 2.8% | 2.3 |
Latest Headlines
- · Sector Update: Energy Stocks Fall Late Afternoon
- · Three Energy ETFs Are Yielding Over 2.5 Percent While Delivering 24 to 31 Percent Returns in 2026
- · Why Occidental Petroleum Is a Buy Despite Falling Oil Prices
- · Sector Update: Energy Stocks Retreat Friday Afternoon
- · Why Is The US Stock Market Up Today?
- · Here's Why SM Energy's 2026 Production Outlook Looks Strong
Revenue & Net Income
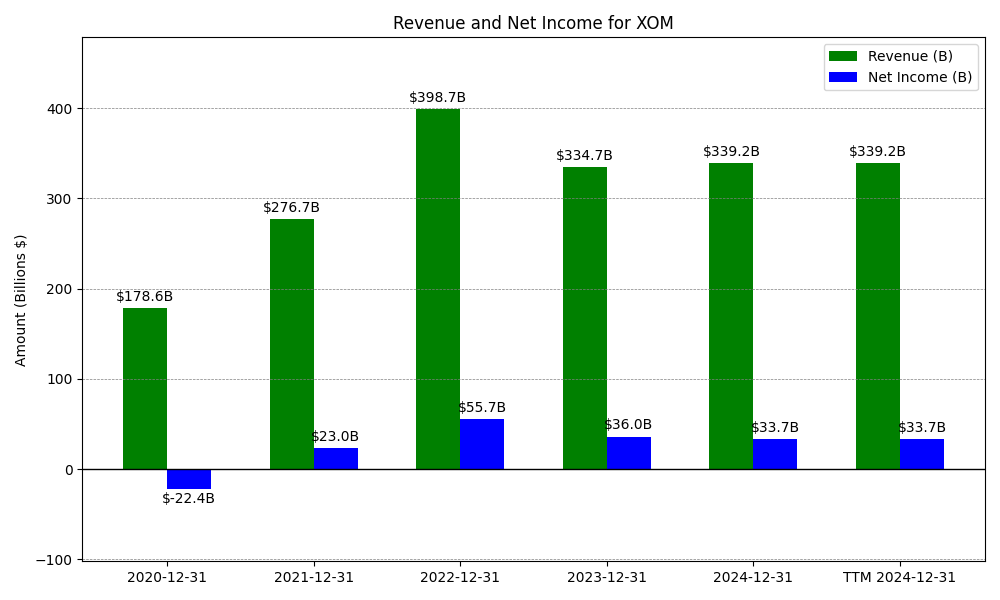
| Date | Revenue | Net_Income | EPS | Last_Updated | Revenue_Change | Net_Income_Change | EPS_Change | |
|---|---|---|---|---|---|---|---|---|
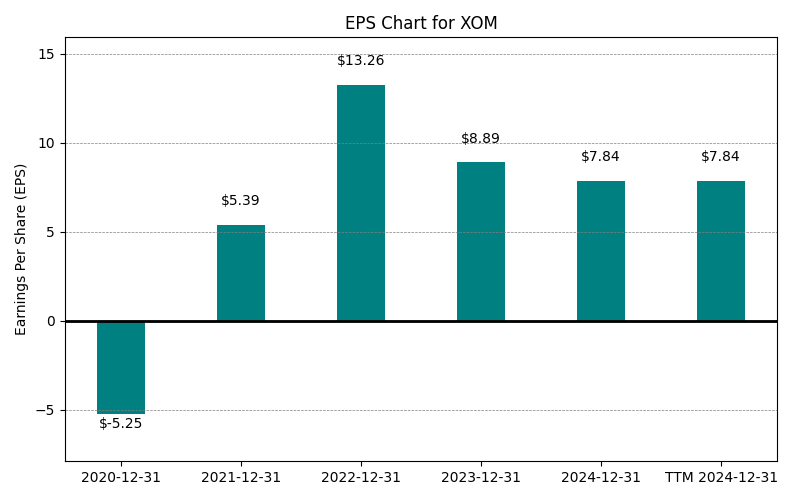
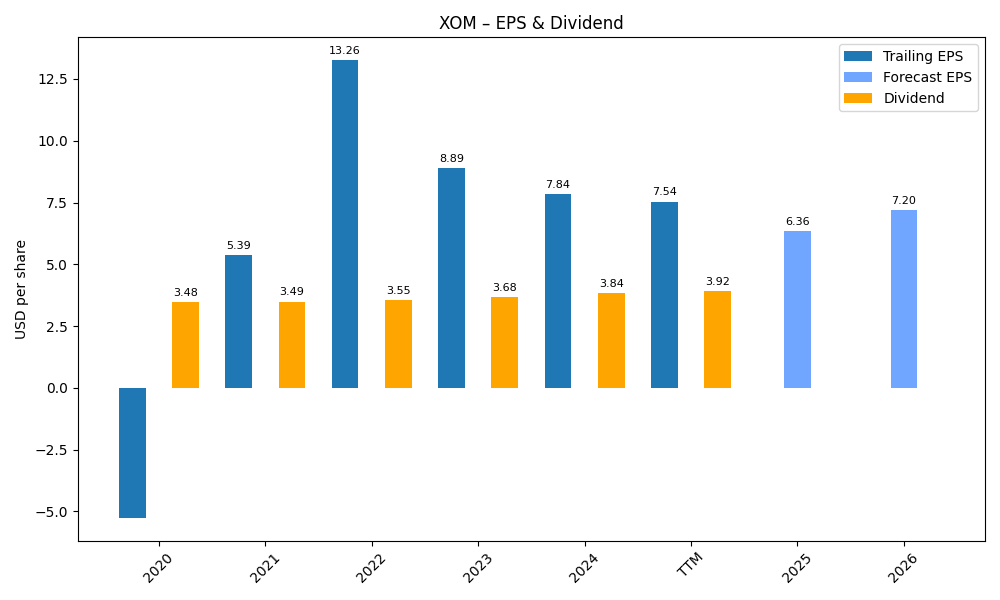
| 0 | 2020-12-31 | $178,574M | $-22,440M | $-5.25 | 2024-02-08 22:12:53 | N/A | N/A | N/A |
| 1 | 2021-12-31 | $398,675M | $55,740M | $5.39 | 2026-03-10 08:46:10 | 123.3% | -348.4% | -202.7% |
| 2 | 2022-12-31 | $398,675M | $55,740M | $13.26 | 2026-05-29 09:16:31 | 0.0% | 0.0% | 146.0% |
| 3 | 2023-12-31 | $334,697M | $36,010M | $8.89 | 2026-05-29 09:16:31 | -16.0% | -35.4% | -33.0% |
| 4 | 2024-12-31 | $339,247M | $33,680M | $7.84 | 2026-05-29 09:16:31 | 1.4% | -6.5% | -11.8% |
| 5 | 2025-12-31 | $323,905M | $28,844M | $6.70 | 2026-05-29 09:16:31 | -4.5% | -14.4% | -14.5% |
| 6 | TTM 2026-03-31 | $326,008M | $25,314M | $5.94 | 2026-05-07 09:04:52 | 0.6% | -12.2% | -11.3% |
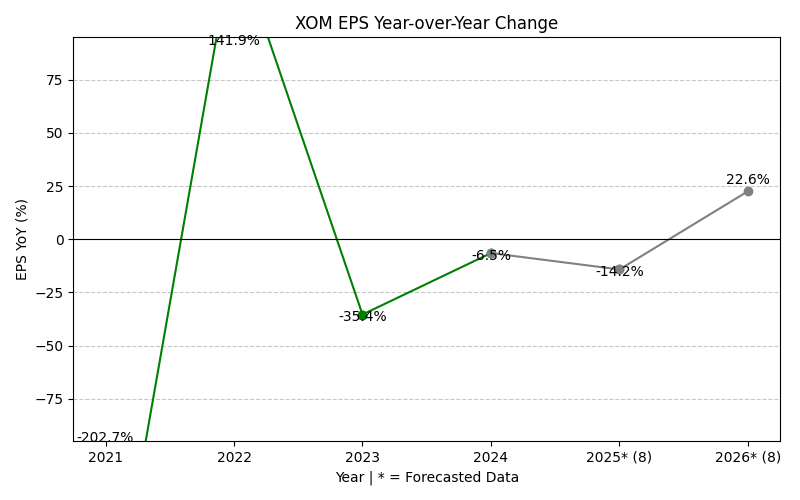
EPS
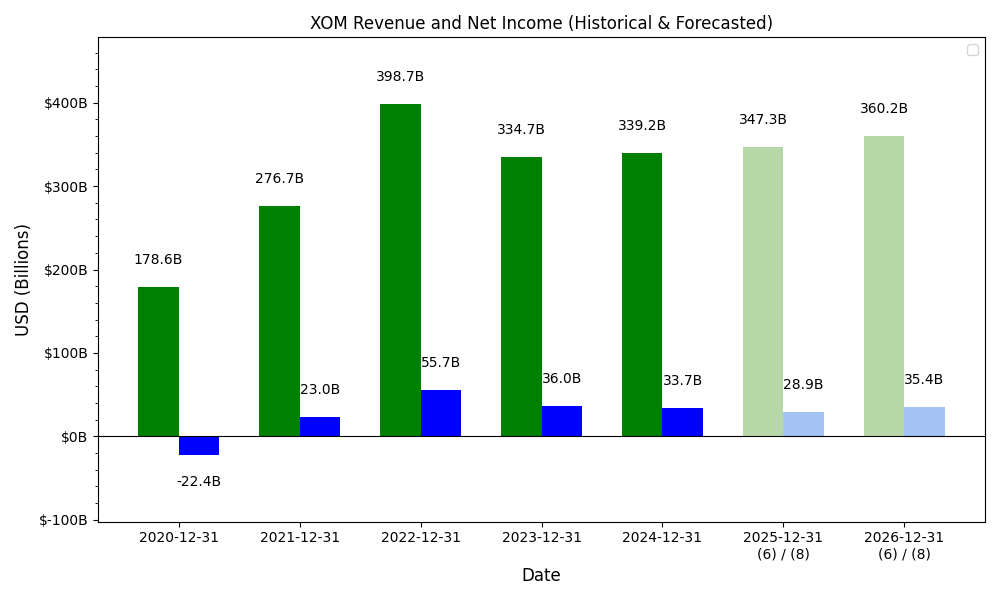
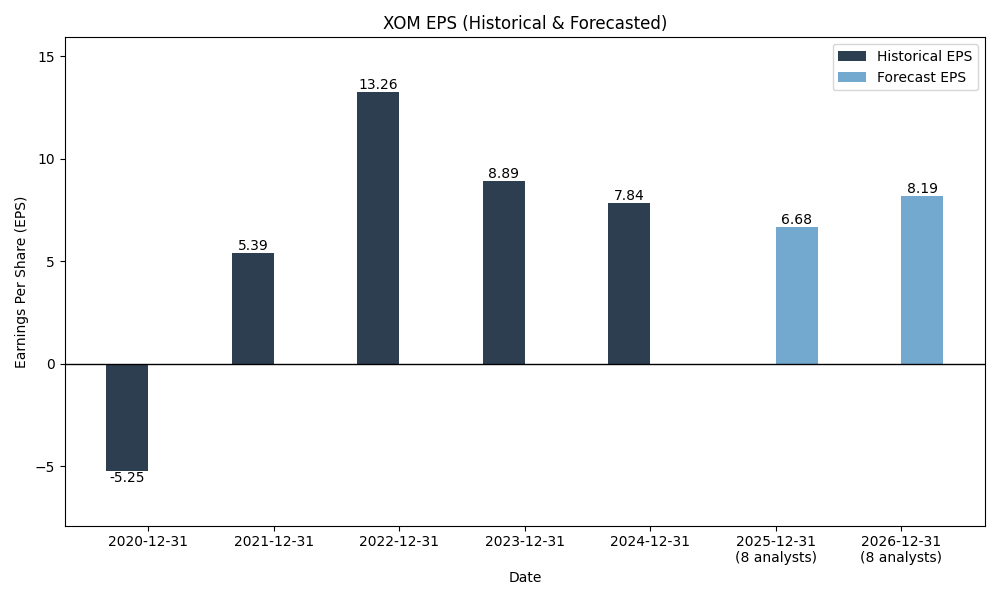
Forecasts
Y/Y % Change
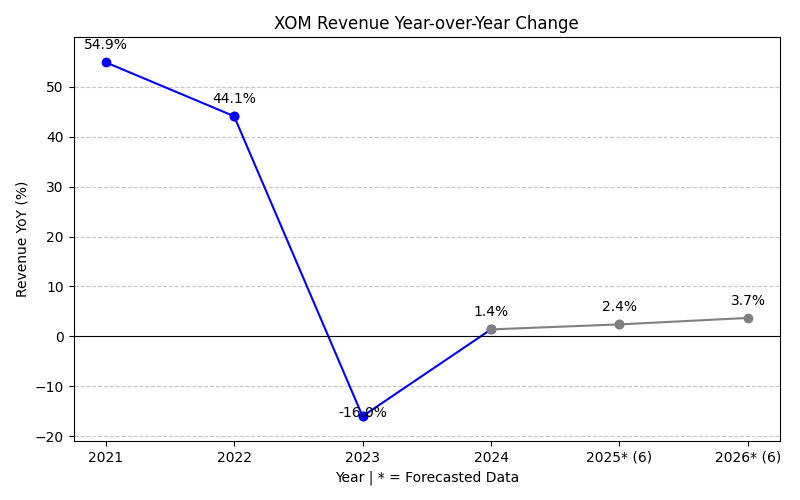
XOM Year-over-Year Growth
| 2020 | 2021 | 2022 | 2023 | 2024 | 2025 | 2026 | 2027 | Average | |
|---|---|---|---|---|---|---|---|---|---|
| Revenue Growth (%) | 123.3% | 0.0% | -16.0% | 1.4% | -4.5% | 24.4% | -5.6% | 17.6% | |
| Revenue Analysts (#) | 0 | 0 | 0 | 0 | 0 | 0 | 12 | 12 | |
| EPS Growth (%) | -348.4% | 0.0% | -35.4% | -6.5% | -14.4% | 61.6% | -5.3% | -49.8% | |
| EPS Analysts (#) | 0 | 0 | 0 | 0 | 0 | 0 | 25 | 24 |
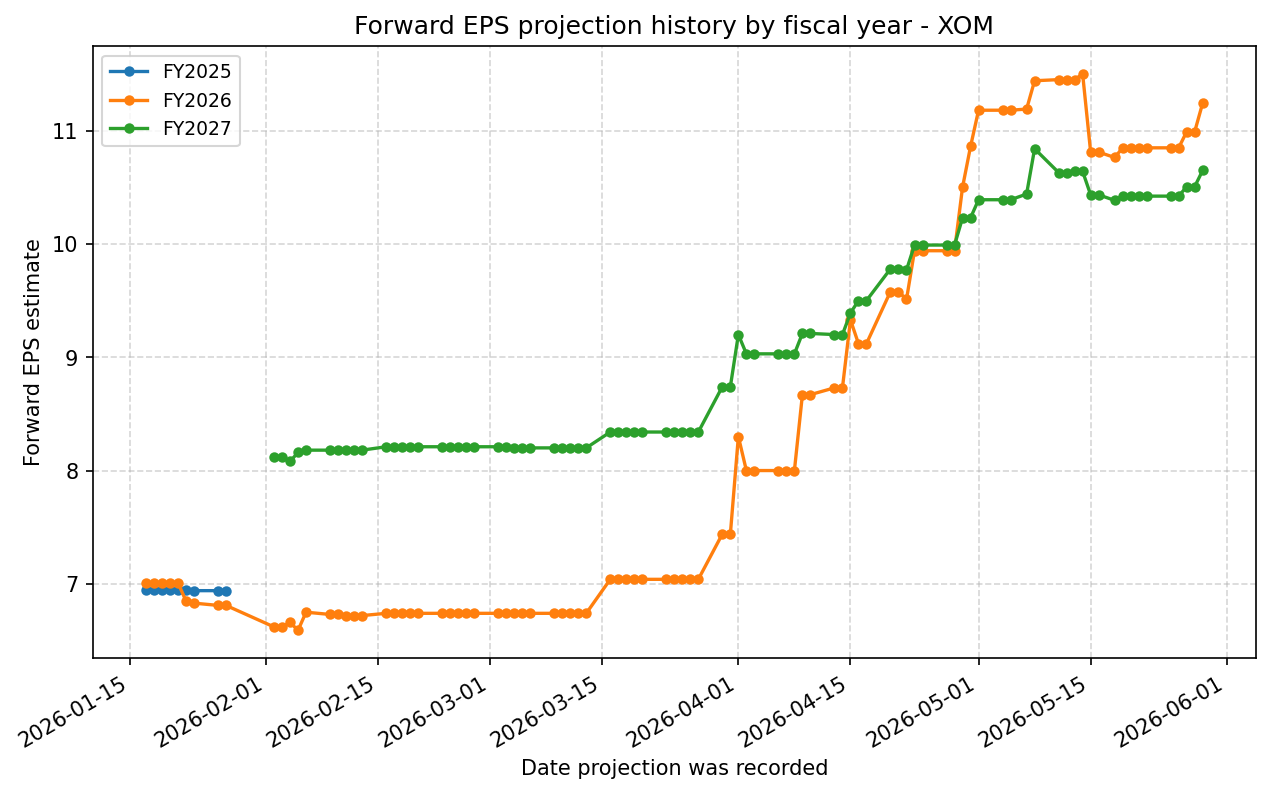
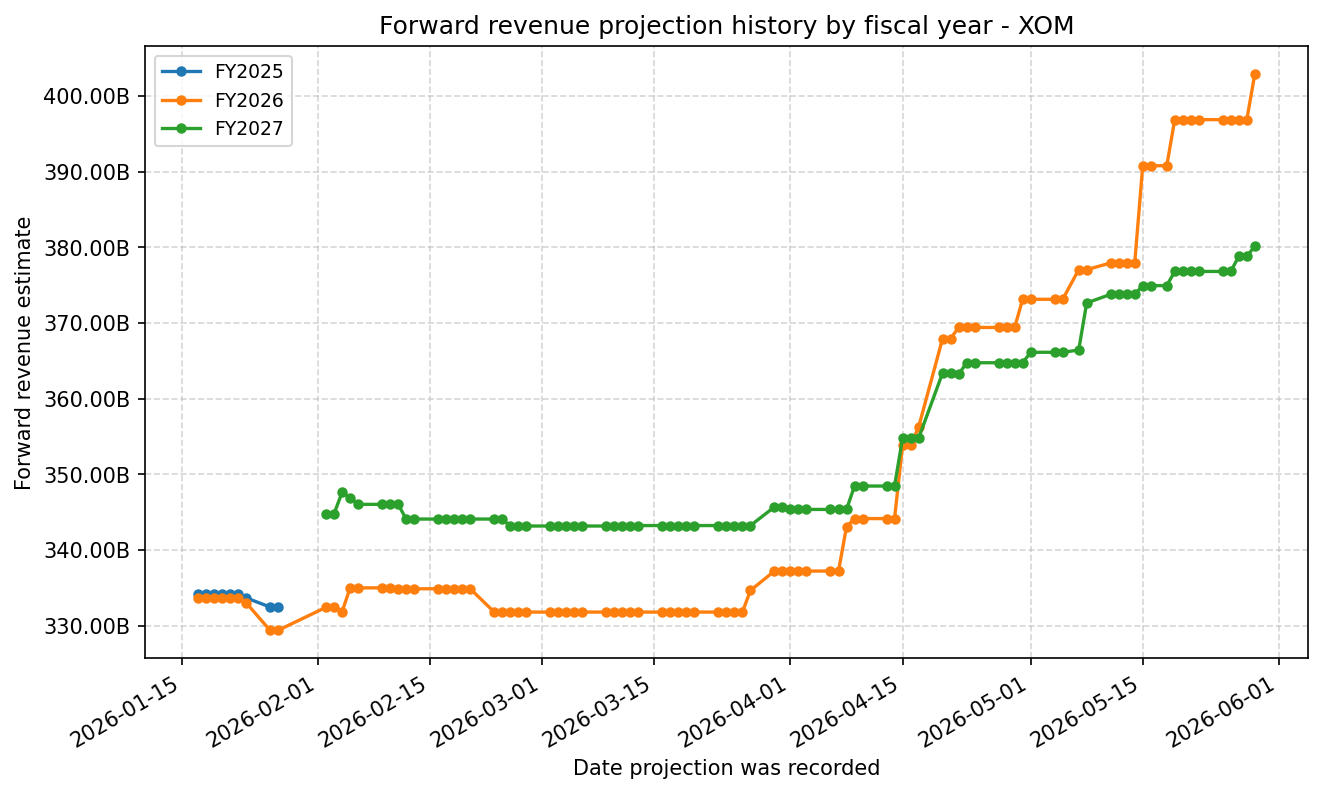
Forward Estimate History
How the next-FY EPS and revenue estimates have drifted over time. One line per fiscal year – past lines end when that FY became current.
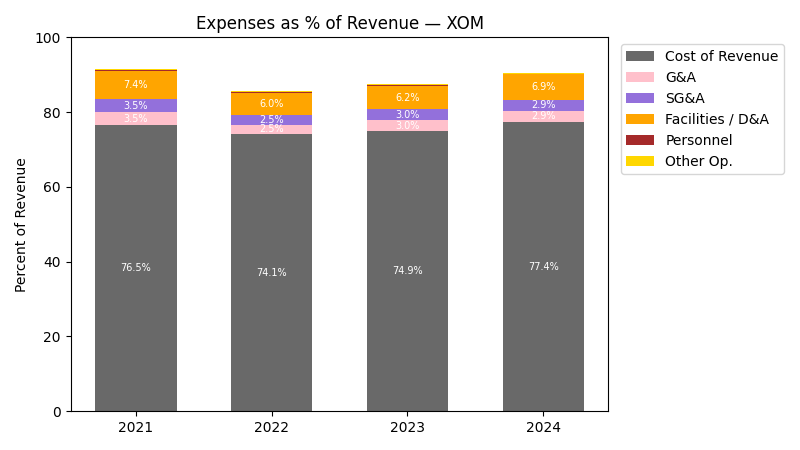
Expenses
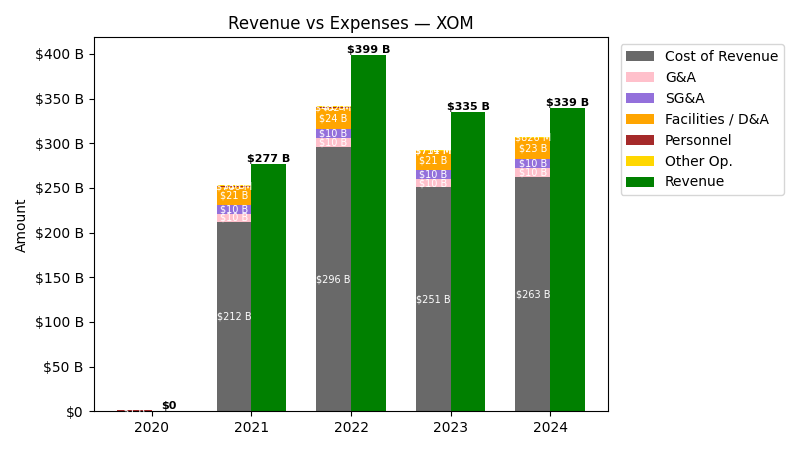
| Year | Revenue ($) | Cost of Revenue ($) | G&A ($) | SG&A ($) | Facilities / D&A ($) | Personnel ($) |
|---|---|---|---|---|---|---|
| 2022 | $398.7B | $271.6B | $10.1B | $10.1B | $24.0B | $482.0M |
| 2023 | $334.7B | $229.9B | $9.9B | $9.9B | $20.6B | $714.0M |
| 2024 | $339.2B | $239.1B | $10.0B | $10.0B | $23.4B | $0.0 |
| 2025 | $323.9B | $226.7B | $0.0 | $11.1B | $26.0B | $0.0 |
| TTM | $326.0B | $232.3B | $0.0 | $11.3B | $27.1B | $0.0 |
| Year | Revenue Change (%) | Cost of Revenue Change (%) | G&A Change (%) | SG&A Change (%) | Facilities / D&A Change (%) | Personnel Change (%) |
|---|---|---|---|---|---|---|
| 2023 | -16.05 | -15.34 | -1.74 | -1.74 | -14.14 | 48.13 |
| 2024 | 1.36 | 3.98 | 0.57 | 0.57 | 13.57 | -100.00 |
| 2025 | -4.52 | -5.18 | -100.00 | 11.55 | 10.88 | NaN |
| TTM | 0.65 | 2.48 | NaN | 1.29 | 4.11 | NaN |
No unmapped expenses.
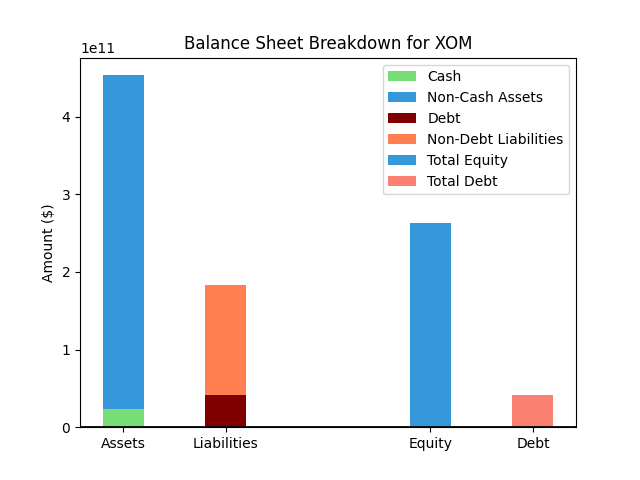
Balance Sheet
| Metric | Value | |
|---|---|---|
| 0 | Total Assets | $464,410M |
| 1 | Cash | $8,435M |
| 2 | Total Liabilities | $203,414M |
| 3 | Total Debt | $47,661M |
| 4 | Total Equity | $254,381M |
| 5 | Debt to Equity Ratio | 0.19 |
EPS & Dividend
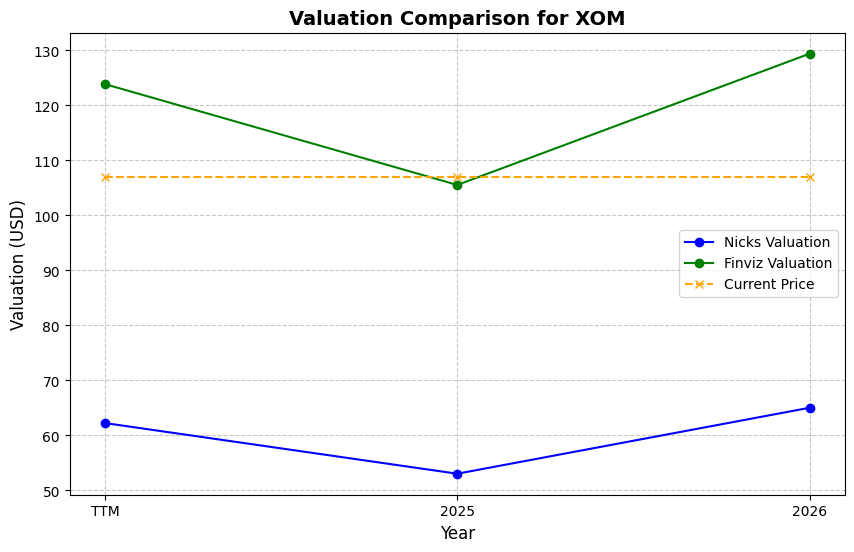
Valuation
| Share Price | Treasury Yield | Estimates | Fair Value (P/E) | Fair Value (P/S) | Current P/S | Current P/E |
|---|---|---|---|---|---|---|
| $145.26 | 4.5% | Nicks Growth: 2% Nick's Expected Margin: 14% FINVIZ Growth: 16% |
Nicks: 8 Finviz: 30 |
Nick's: 1.092 | 1.8 | 24.5 |
| Basis | Year | Nicks Valuation | Nicks vs Share Price | Finviz Valuation | Finviz vs Share Price |
|---|---|---|---|---|---|
| $5.94 EPS | TTM | $46.34 | -68.1% | $177.48 | 22.2% |
| $11.24 EPS | 2026 | $87.72 | -39.6% | $335.98 | 131.3% |
| $10.65 EPS | 2027 | $83.08 | -42.8% | $318.19 | 119.1% |
Implied Growth
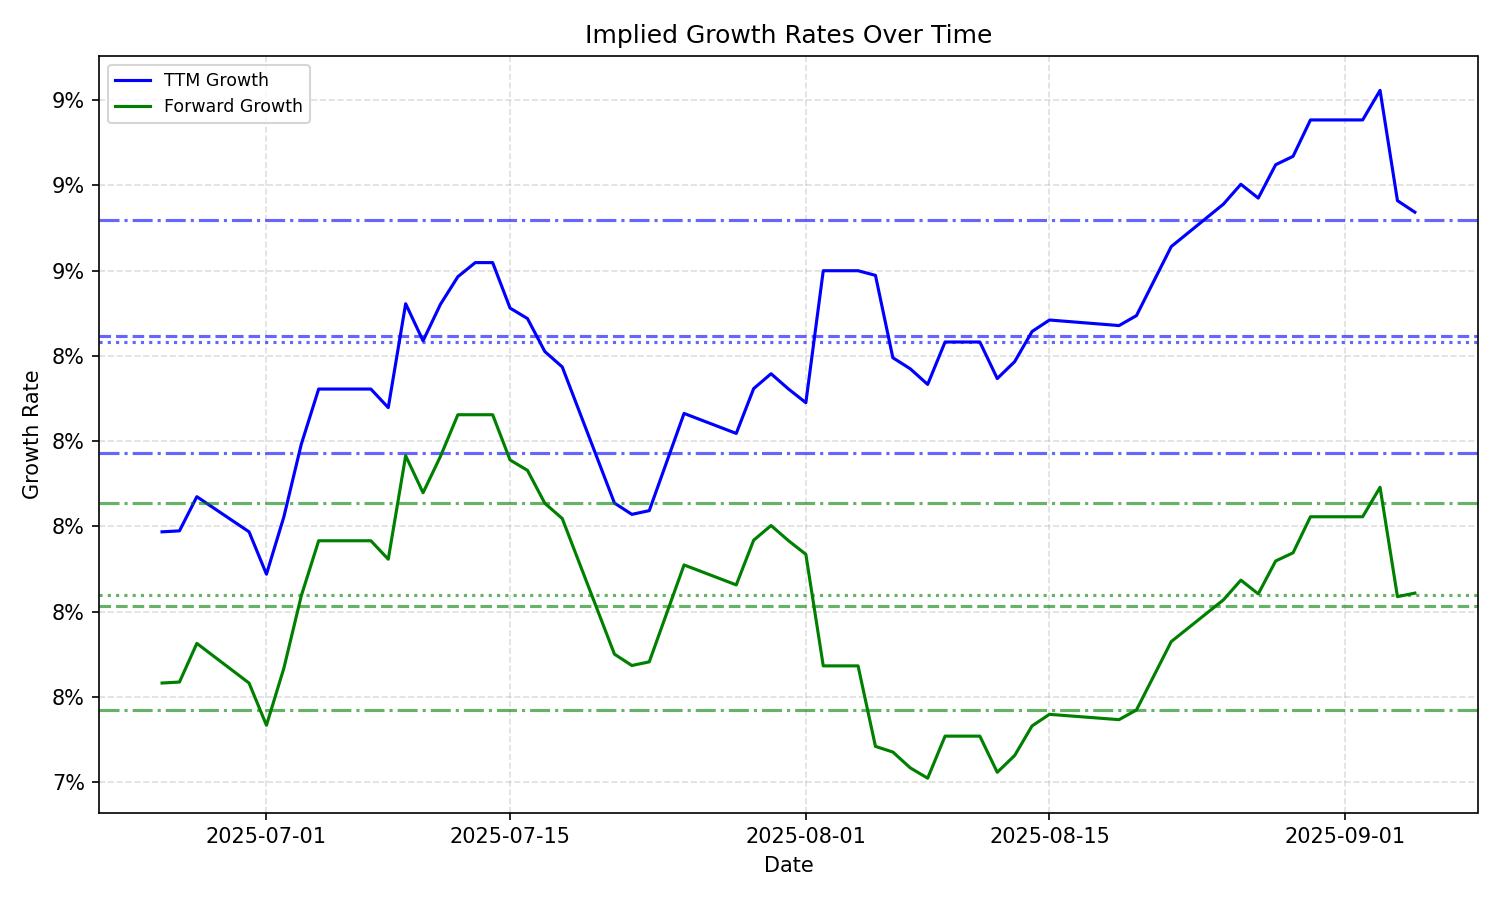
| Average | Median | Std Dev | Current | Percentile | ||||||
|---|---|---|---|---|---|---|---|---|---|---|
| TTM | Forward | TTM | Forward | TTM | Forward | TTM | Forward | TTM | Forward | |
| Timeframe | ||||||||||
| 1 Year | 10.54% | 8.64% | 9.57% | 8.17% | 2.09% | 1.08% | 13.94% | 7.73% | 91.7% | 19.8% |
| 3 Years | 10.54% | 8.64% | 9.57% | 8.17% | 2.09% | 1.08% | 13.94% | 7.73% | 91.7% | 19.8% |
| 5 Years | 10.54% | 8.64% | 9.57% | 8.17% | 2.09% | 1.08% | 13.94% | 7.73% | 91.7% | 19.8% |
| 10 Years | 10.54% | 8.64% | 9.57% | 8.17% | 2.09% | 1.08% | 13.94% | 7.73% | 91.7% | 19.8% |