Visa Inc. — V
| Close Price | Market Cap | P/E Ratio | Forward P/E Ratio | Implied Growth* | Implied Forward Growth* | Dividend | P/B Ratio |
|---|---|---|---|---|---|---|---|
| $326.36 | $620.65B | 28.5 | 22.0 | 15.5% | 12.6% | $2.68 0.8% | 16.3 |
Latest Headlines
- · Cash and Gift Cards Dominate Consumer Reward Preferences: Kashkick Survey of 224,000+ Aligns With $507B U.S. Gift Card Market
- · Visa's local partners fill cardless gaps in business payments
- · Crypto Card Payment Volumes More Than Double In A Year, Growth Surges Since Stablecoin Act Passage
- · Payments Stocks in the Stablecoin Era: 3 to Buy and 1 to Avoid
- · Trip.com’s AI Travel Push And New Global Partnerships Might Change The Case For Investing In Trip.com Group (TCOM)
- · Visa Inc. (V) is Attracting Investor Attention: Here is What You Should Know
Revenue & Net Income
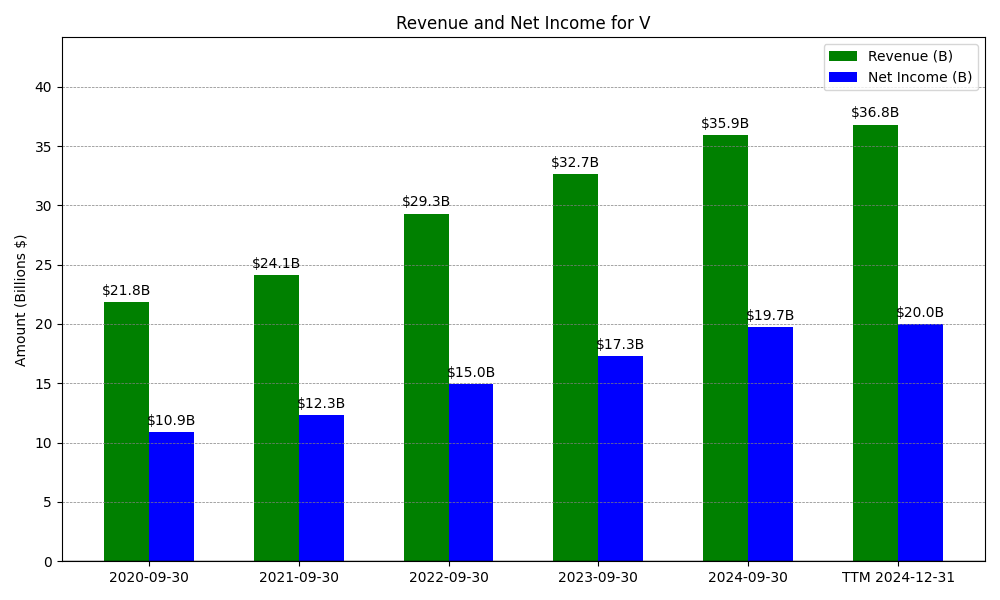
| Date | Revenue | Net_Income | EPS | Last_Updated | Revenue_Change | Net_Income_Change | EPS_Change | |
|---|---|---|---|---|---|---|---|---|
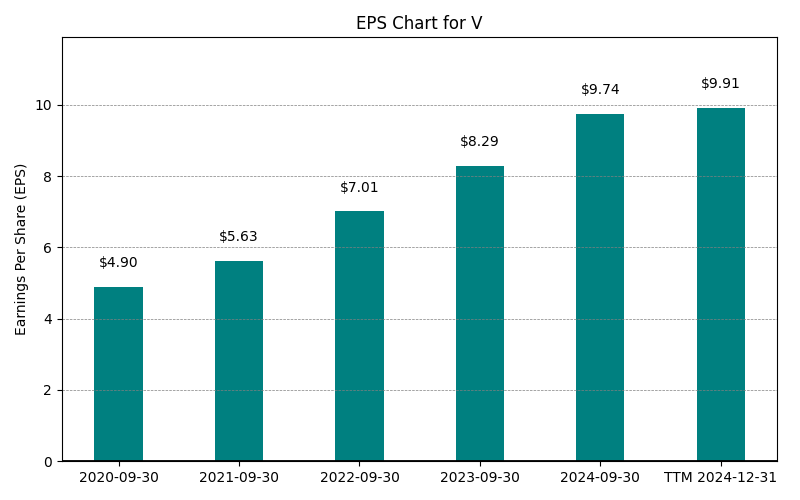
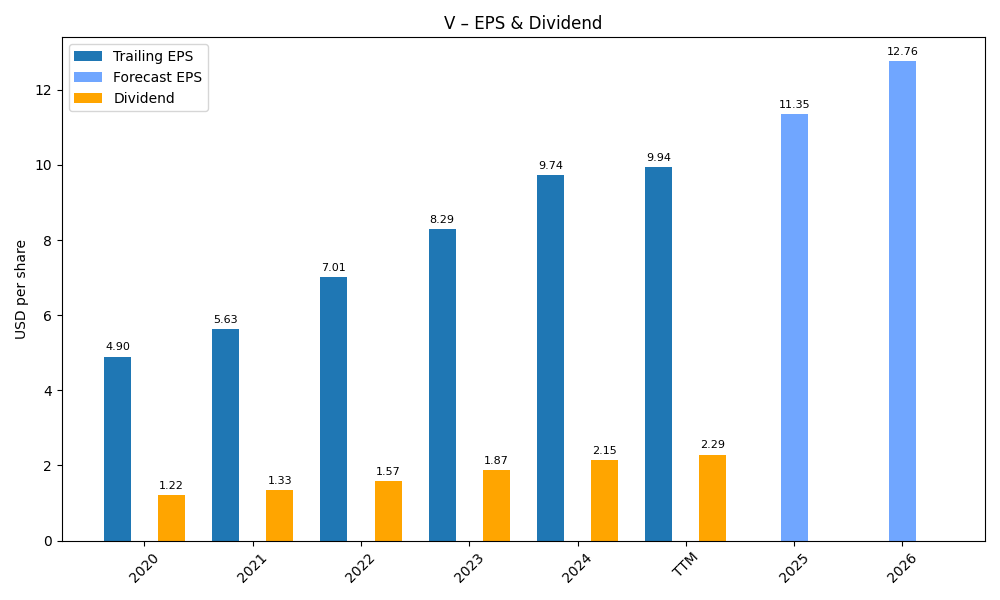
| 0 | 2020-09-30 | $21,846M | $10,866M | $4.90 | 2024-02-04 04:18:39 | N/A | N/A | N/A |
| 1 | 2021-09-30 | $24,105M | $12,311M | $5.63 | 2024-02-04 04:18:39 | 10.3% | 13.3% | 14.9% |
| 2 | 2022-09-30 | $29,310M | $14,957M | $7.01 | 2026-05-29 09:15:57 | 21.6% | 21.5% | 24.5% |
| 3 | 2023-09-30 | $32,653M | $17,273M | $8.29 | 2026-05-29 09:15:57 | 11.4% | 15.5% | 18.3% |
| 4 | 2024-09-30 | $35,926M | $19,743M | $9.74 | 2026-05-29 09:15:57 | 10.0% | 14.3% | 17.5% |
| 5 | 2025-09-30 | $40,000M | $20,058M | $10.22 | 2026-05-29 09:15:57 | 11.3% | 1.6% | 4.9% |
| 6 | TTM 2026-03-31 | $43,027M | $22,236M | $11.47 | 2026-04-30 08:56:50 | 7.6% | 10.9% | 12.2% |
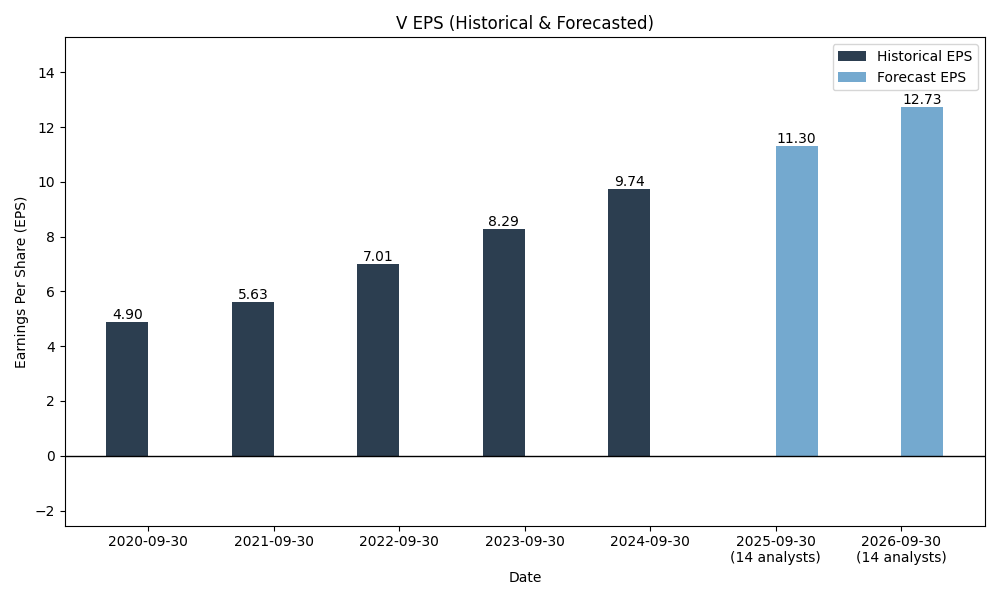
EPS
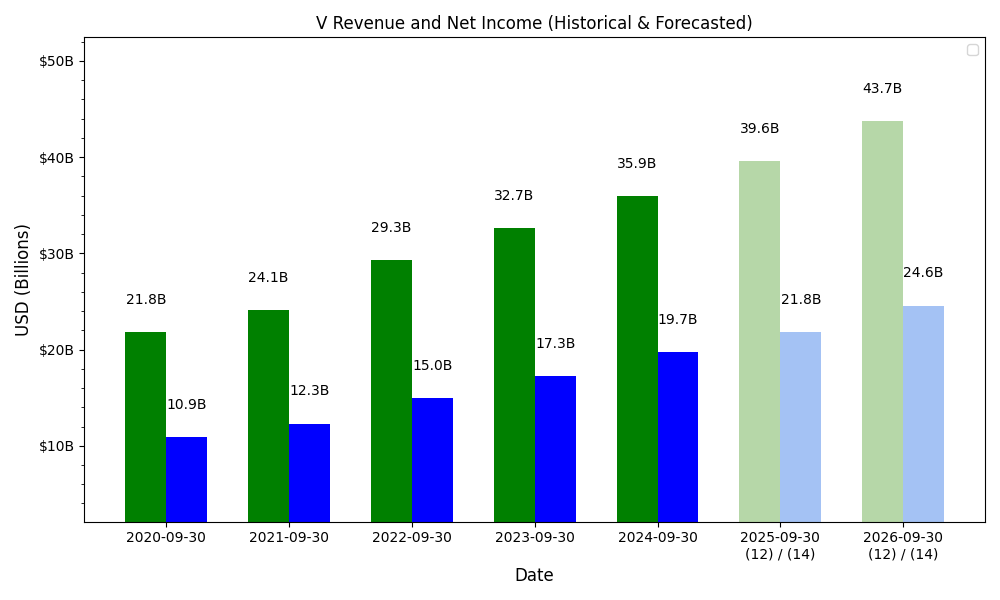
Forecasts
Y/Y % Change
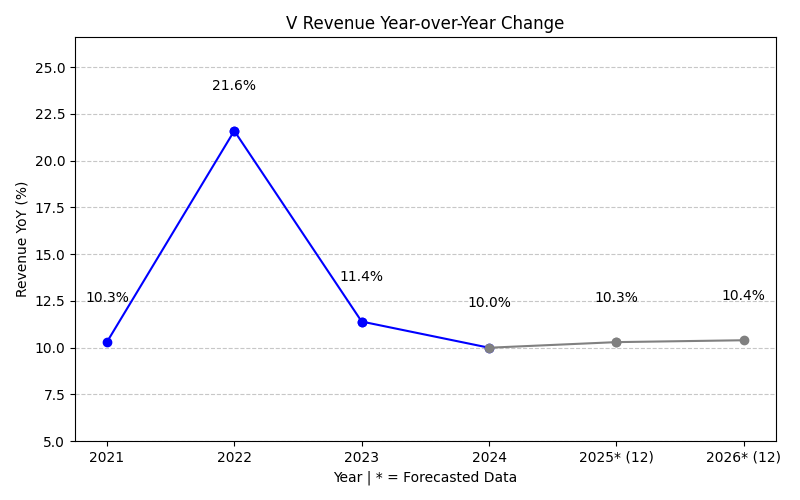
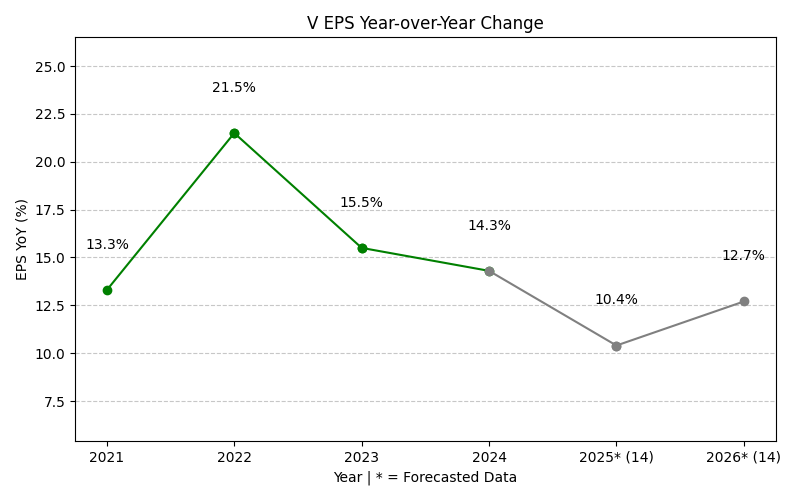
V Year-over-Year Growth
| 2020 | 2021 | 2022 | 2023 | 2024 | 2025 | 2026 | 2027 | Average | |
|---|---|---|---|---|---|---|---|---|---|
| Revenue Growth (%) | 10.3% | 21.6% | 11.4% | 10.0% | 11.3% | 13.7% | 10.6% | 12.7% | |
| Revenue Analysts (#) | 0 | 0 | 0 | 0 | 0 | 0 | 35 | 36 | |
| EPS Growth (%) | 13.3% | 21.5% | 15.5% | 14.3% | 1.6% | 24.3% | 13.3% | 14.8% | |
| EPS Analysts (#) | 0 | 0 | 0 | 0 | 0 | 0 | 39 | 38 |
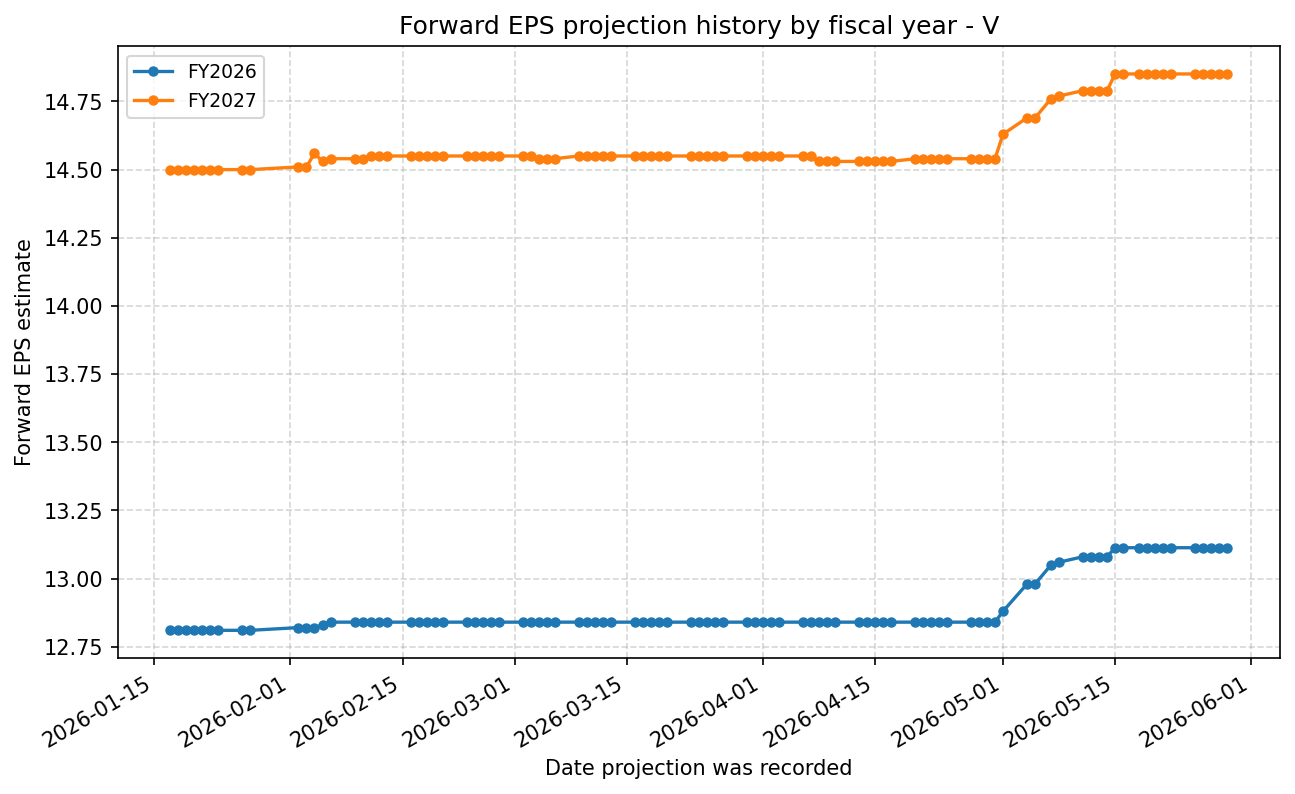
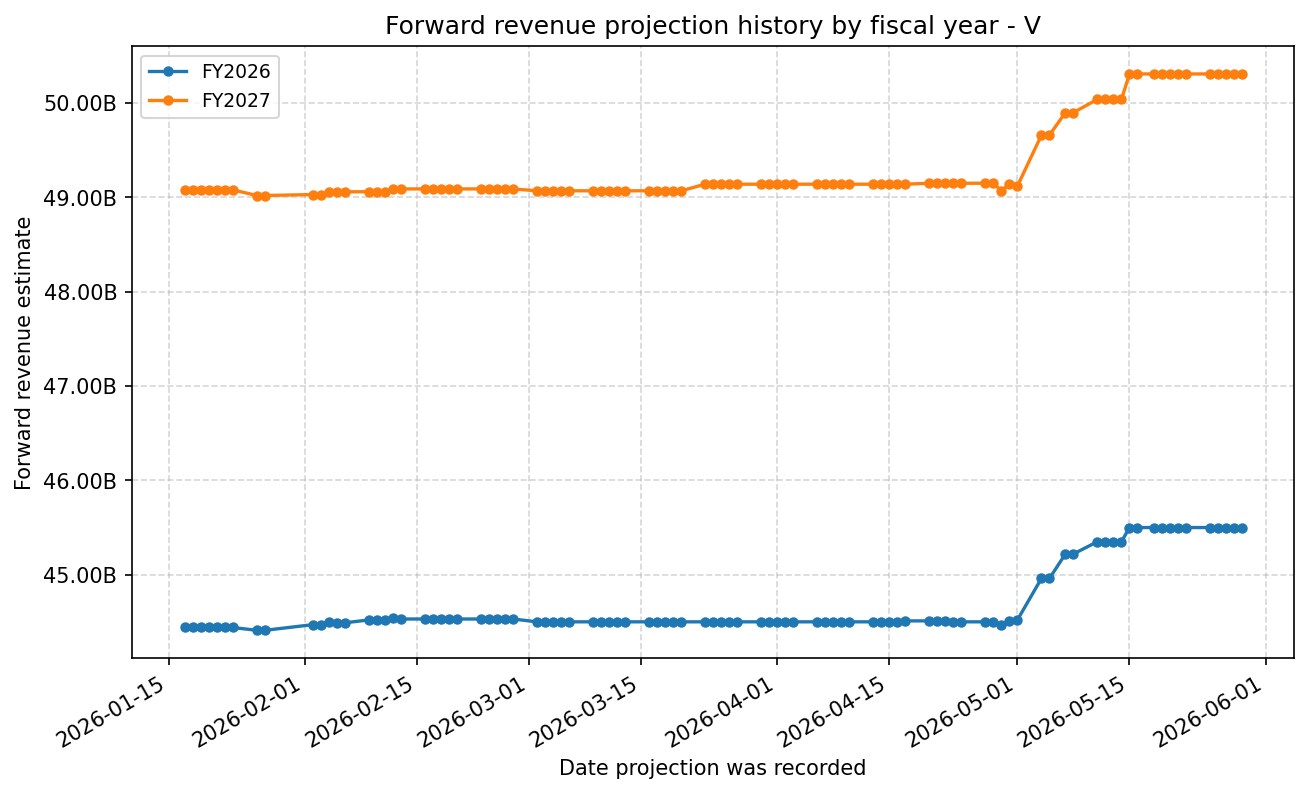
Forward Estimate History
How the next-FY EPS and revenue estimates have drifted over time. One line per fiscal year – past lines end when that FY became current.
Expenses
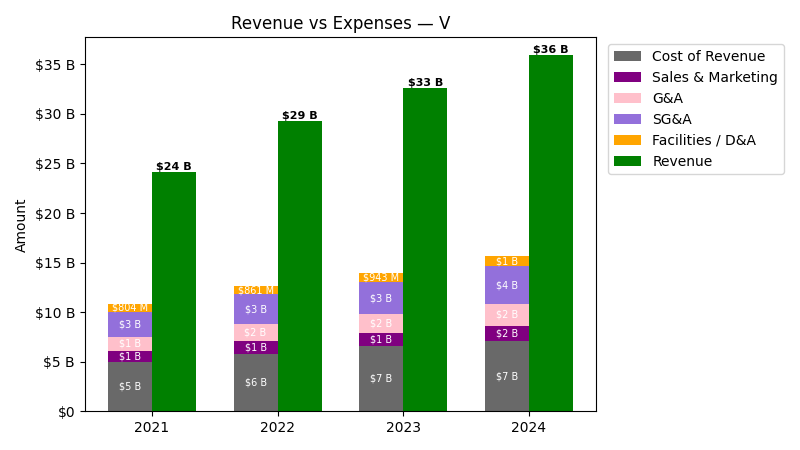
| Year | Revenue ($) | Cost of Revenue ($) | Sales & Marketing ($) | G&A ($) | SG&A ($) | Facilities / D&A ($) |
|---|---|---|---|---|---|---|
| 2021 | $24.1B | $4.2B | $1.1B | $1.4B | $2.5B | $804.0M |
| 2022 | $29.3B | $4.9B | $1.3B | $1.7B | $3.0B | $861.0M |
| 2023 | $32.7B | $5.6B | $1.3B | $1.9B | $3.2B | $943.0M |
| 2024 | $35.9B | $6.0B | $1.6B | $2.2B | $3.8B | $1.0B |
| 2025 | $40.0B | $6.6B | $1.7B | $2.7B | $4.4B | $1.2B |
| TTM | $43.0B | $6.8B | $2.0B | $2.9B | $4.8B | $1.3B |
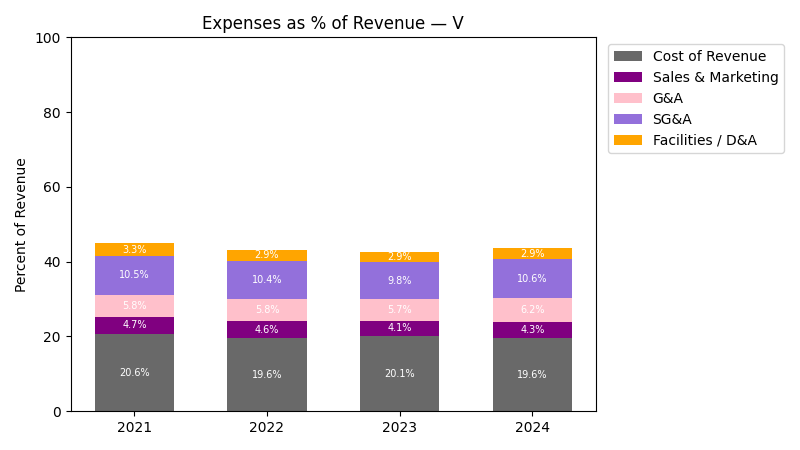
| Year | Revenue Change (%) | Cost of Revenue Change (%) | Sales & Marketing Change (%) | G&A Change (%) | SG&A Change (%) | Facilities / D&A Change (%) |
|---|---|---|---|---|---|---|
| 2022 | 21.59 | 16.95 | 17.61 | 22.41 | 20.25 | 7.09 |
| 2023 | 11.41 | 15.44 | 0.37 | 10.36 | 5.96 | 9.52 |
| 2024 | 10.02 | 6.83 | 16.33 | 19.09 | 17.94 | 9.65 |
| 2025 | 11.34 | 10.44 | 7.95 | 20.24 | 15.19 | 17.99 |
| TTM | 7.57 | 1.88 | 15.91 | 7.26 | 10.60 | 5.90 |
No unmapped expenses.
Segment Performance
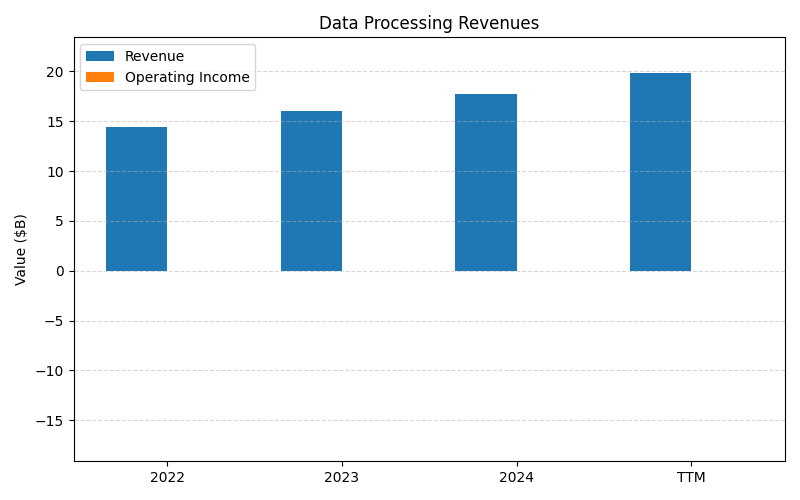
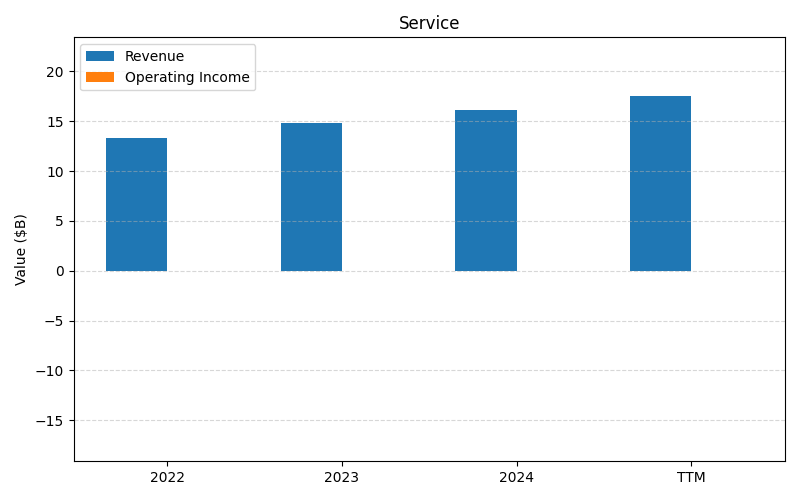
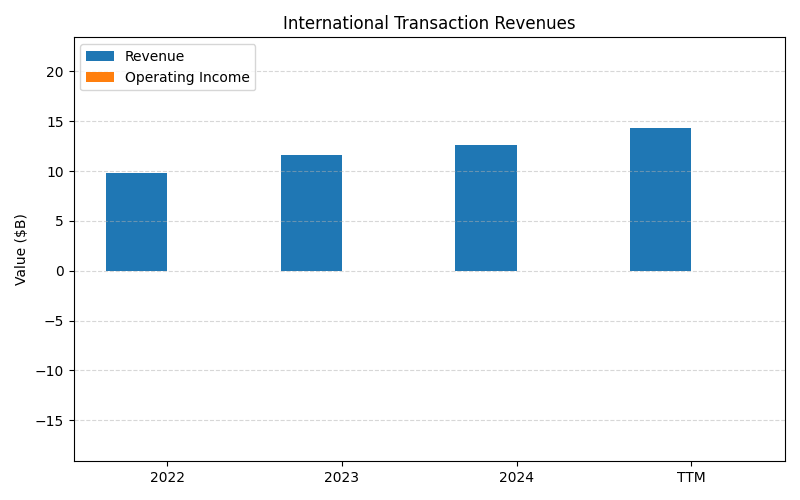
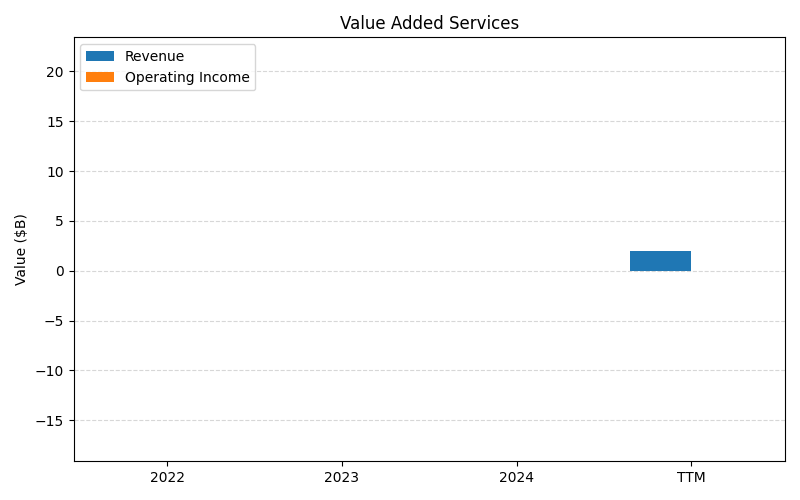
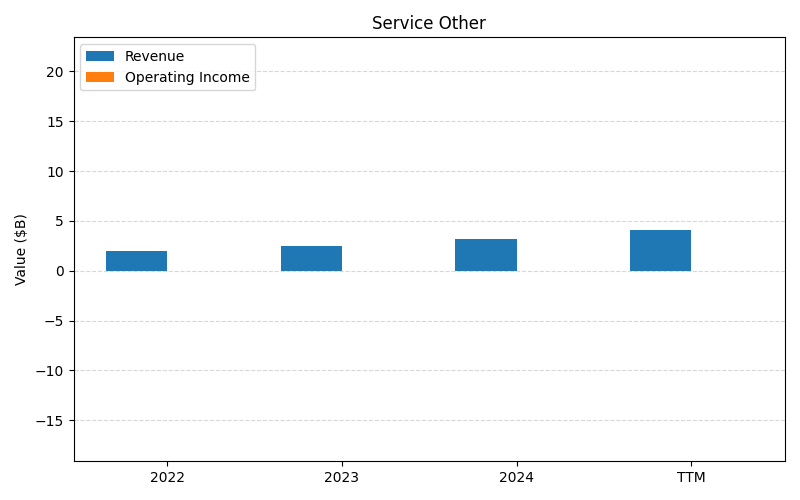
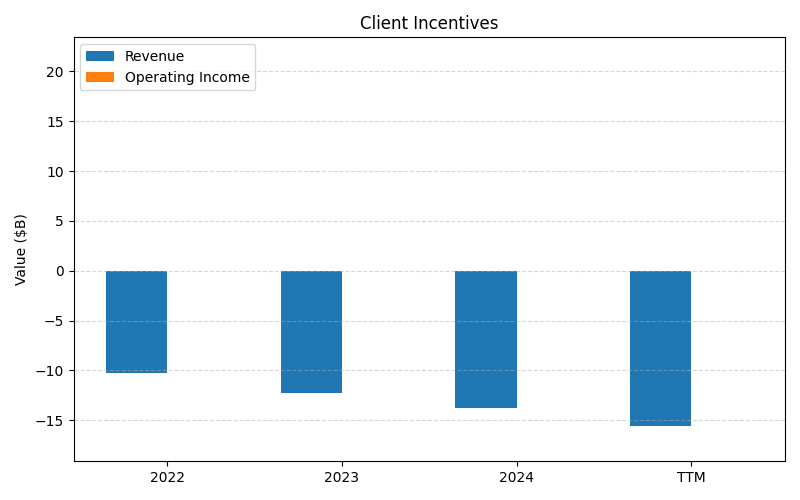
SEGMENTS v2025-09-09 · 2026-05-29 09:16 UTC — Units: $B. Rows list fiscal years (last 3 + TTM) with revenue for each segment; the final row shows the TTM revenue mix (operating income columns display “—” where mix is not applicable).
| Year | Data Processing Revenues Rev | Services Rev | International Transaction Revenues Rev | Value Added Services Rev | Service Other Rev | Client Incentives Rev | Total Rev |
|---|---|---|---|---|---|---|---|
| 2023 | 16B | 14.8B | 11.6B | 7.20B | 2.48B | -12.3B | 39.9B |
| 2024 | 17.7B | 16.1B | 12.7B | 8.80B | 3.20B | -13.8B | 44.7B |
| 2025 | 20B | 17.5B | 14.2B | 10.9B | 4.05B | -15.8B | 50.9B |
| TTM | 68.5B | 61.4B | 47.8B | 37.1B | 13.9B | -53.5B | 175.1B |
| % of Total (TTM) | 39.1% | 35.1% | 27.3% | 21.2% | 7.9% | -30.6% | 100% |
Balance Sheet
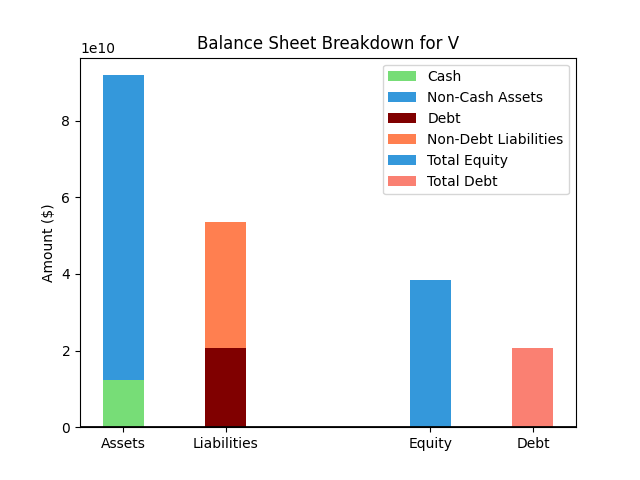
| Metric | Value | |
|---|---|---|
| 0 | Total Assets | $95,049M |
| 1 | Cash | $12,404M |
| 2 | Total Liabilities | $59,388M |
| 3 | Total Debt | $23,976M |
| 4 | Total Equity | $35,661M |
| 5 | Debt to Equity Ratio | 0.67 |
EPS & Dividend
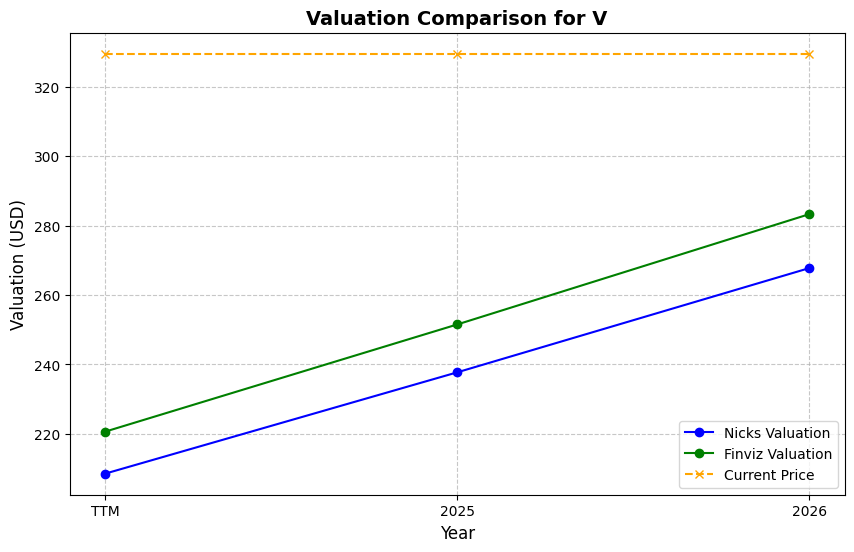
Valuation
| Share Price | Treasury Yield | Estimates | Fair Value (P/E) | Fair Value (P/S) | Current P/S | Current P/E |
|---|---|---|---|---|---|---|
| $326.36 | 4.5% | Nicks Growth: 12% Nick's Expected Margin: 50% FINVIZ Growth: 14% |
Nicks: 21 Finviz: 24 |
Nick's: 10.350 | 14.4 | 28.5 |
| Basis | Year | Nicks Valuation | Nicks vs Share Price | Finviz Valuation | Finviz vs Share Price |
|---|---|---|---|---|---|
| $11.47 EPS | TTM | $237.44 | -27.2% | $275.98 | -15.4% |
| $13.11 EPS | 2026 | $271.45 | -16.8% | $315.51 | -3.3% |
| $14.85 EPS | 2027 | $307.42 | -5.8% | $357.33 | 9.5% |
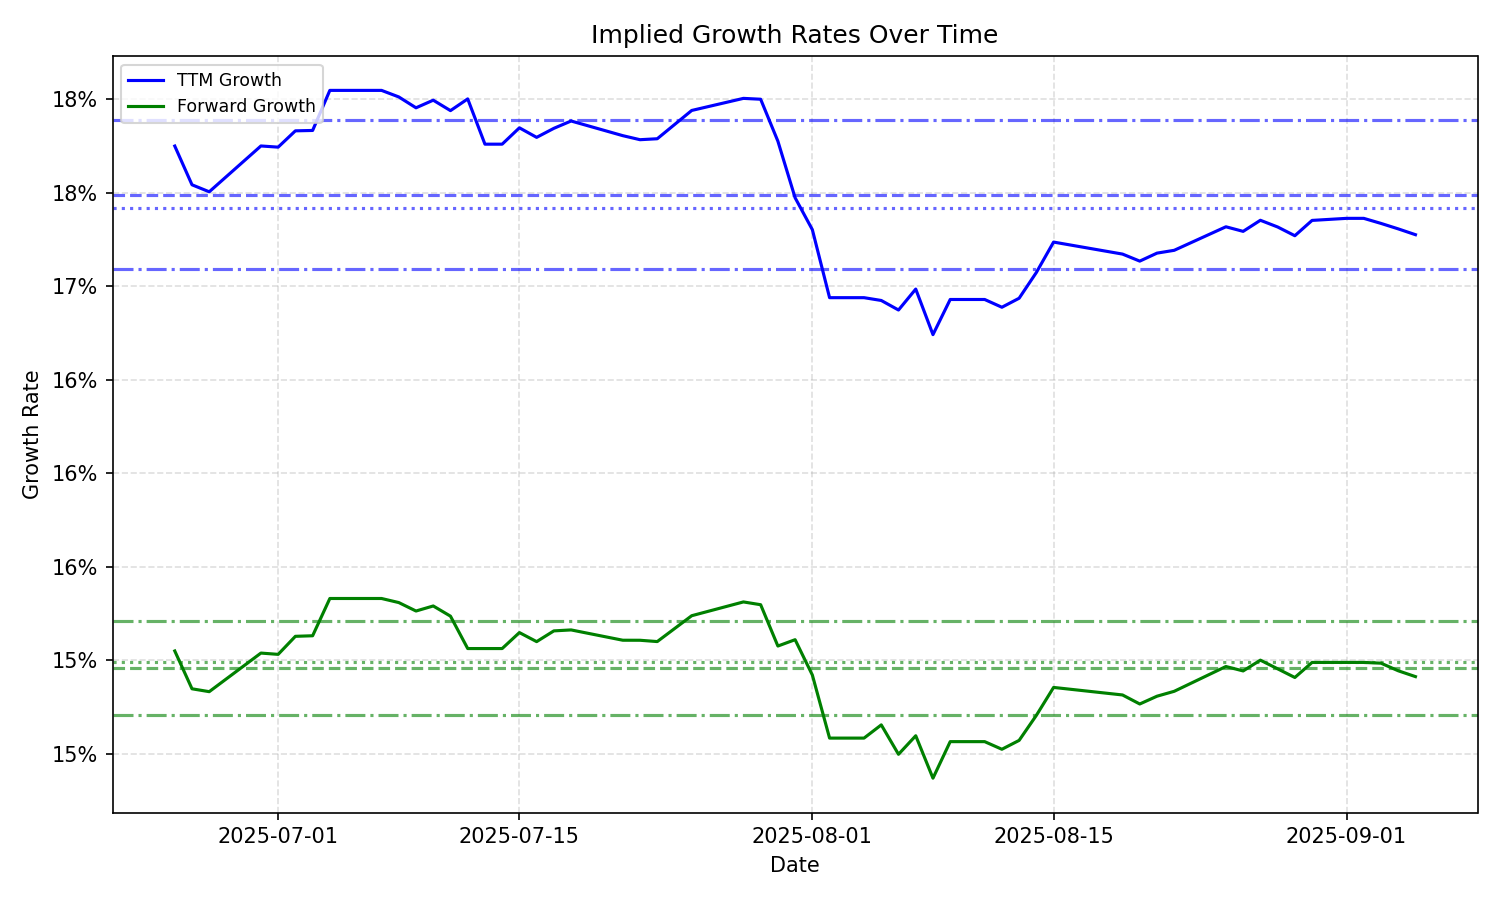
Implied Growth
| Average | Median | Std Dev | Current | Percentile | ||||||
|---|---|---|---|---|---|---|---|---|---|---|
| TTM | Forward | TTM | Forward | TTM | Forward | TTM | Forward | TTM | Forward | |
| Timeframe | ||||||||||
| 1 Year | 16.58% | 13.70% | 16.79% | 14.13% | 0.83% | 1.14% | 15.43% | 12.60% | 9.6% | 24.7% |
| 3 Years | 16.58% | 13.70% | 16.79% | 14.13% | 0.83% | 1.14% | 15.43% | 12.60% | 9.6% | 24.7% |
| 5 Years | 16.58% | 13.70% | 16.79% | 14.13% | 0.83% | 1.14% | 15.43% | 12.60% | 9.6% | 24.7% |
| 10 Years | 16.58% | 13.70% | 16.79% | 14.13% | 0.83% | 1.14% | 15.43% | 12.60% | 9.6% | 24.7% |