Verizon Communications Inc. — VZ
| Close Price | Market Cap | P/E Ratio | Forward P/E Ratio | Implied Growth* | Implied Forward Growth* | Dividend | P/B Ratio |
|---|---|---|---|---|---|---|---|
| $47.81 | $199.63B | 11.7 | 9.1 | 6.0% | 3.5% | $2.83 5.9% | 1.9 |
Latest Headlines
- · Want $4,800 in Annual Passive Income? Invest $40,000 Into These 3 High Yield Dividend Stocks
- · How Is Verizon’s Stock Performance Compared to Other Telecommunications Stocks?
- · Want $1,400 in Passive Income? Invest $10,000 Into These 4 Dividend Stocks
- · SCHD’s $71.6 Billion Portfolio Delivers 20% Gains Plus 3.3% Yield This Year
- · Why Is T-Mobile (TMUS) Down 3.7% Since Last Earnings Report?
- · The Sub-$50 Institutional Cash-Flow Machine That Remains Attractive Despite High Risk Free Yields
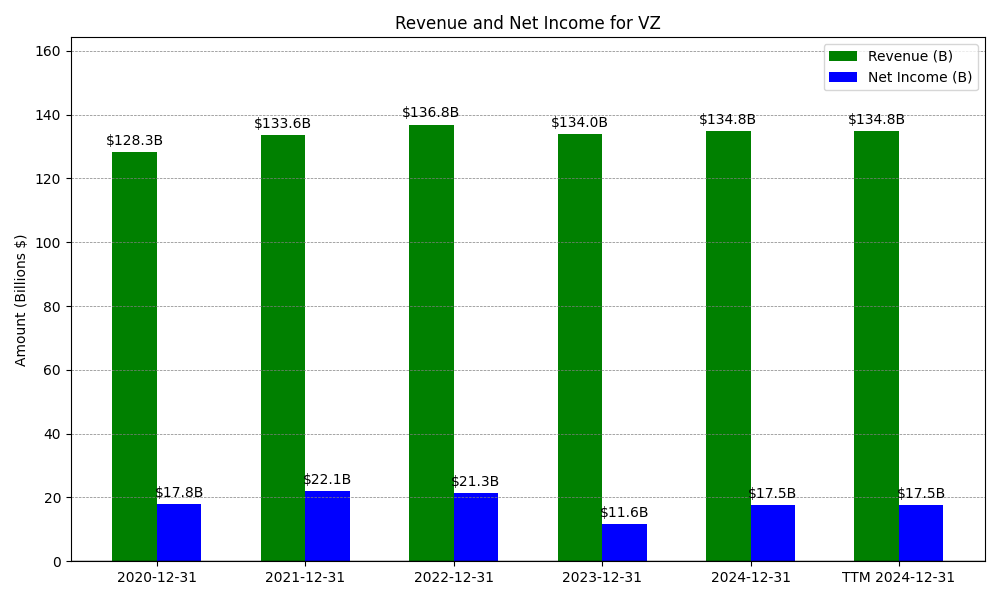
Revenue & Net Income
| Date | Revenue | Net_Income | EPS | Last_Updated | Revenue_Change | Net_Income_Change | EPS_Change | |
|---|---|---|---|---|---|---|---|---|
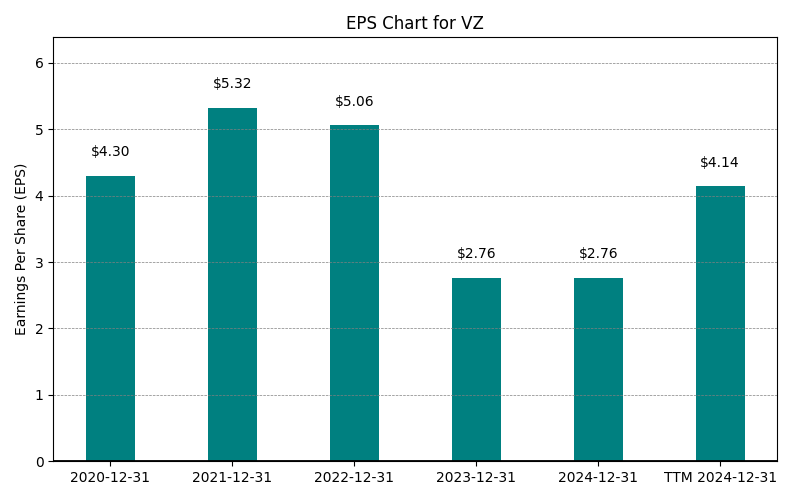
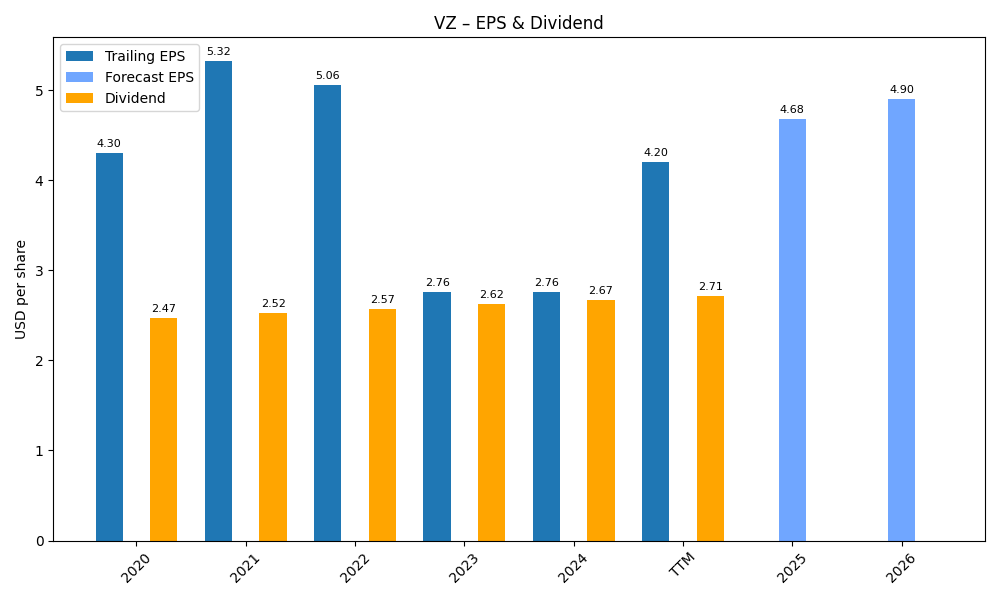
| 0 | 2020-12-31 | $128,292M | $17,801M | $4.30 | 2024-02-03 03:17:10 | N/A | N/A | N/A |
| 1 | 2021-12-31 | $136,835M | $21,256M | $5.32 | 2026-03-11 08:43:04 | 6.7% | 19.4% | 23.7% |
| 2 | 2022-12-31 | $136,835M | $21,256M | $5.06 | 2026-05-29 09:16:16 | 0.0% | 0.0% | -4.9% |
| 3 | 2023-12-31 | $133,974M | $11,614M | $2.76 | 2026-05-29 09:16:16 | -2.1% | -45.4% | -45.5% |
| 4 | 2024-12-31 | $134,788M | $17,506M | $4.15 | 2026-05-29 09:16:16 | 0.6% | 50.7% | 50.4% |
| 5 | 2025-12-31 | $138,191M | $17,174M | $4.06 | 2026-05-29 09:16:16 | 2.5% | -1.9% | -2.2% |
| 6 | TTM 2026-03-31 | $139,146M | $17,340M | $4.10 | 2026-04-29 08:55:52 | 0.7% | 1.0% | 1.0% |
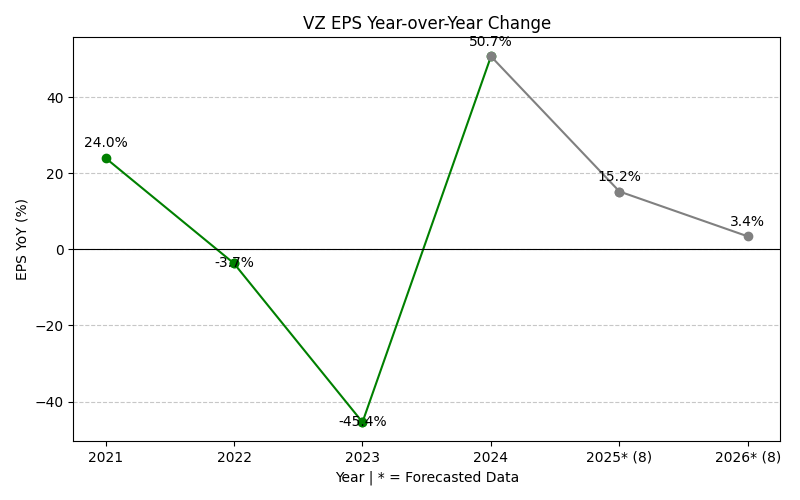
EPS
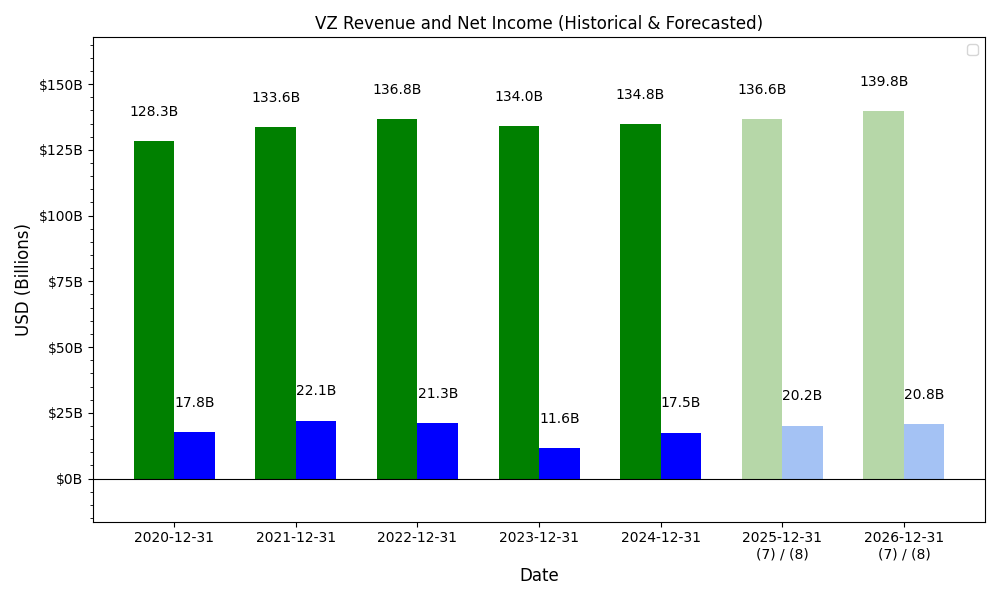
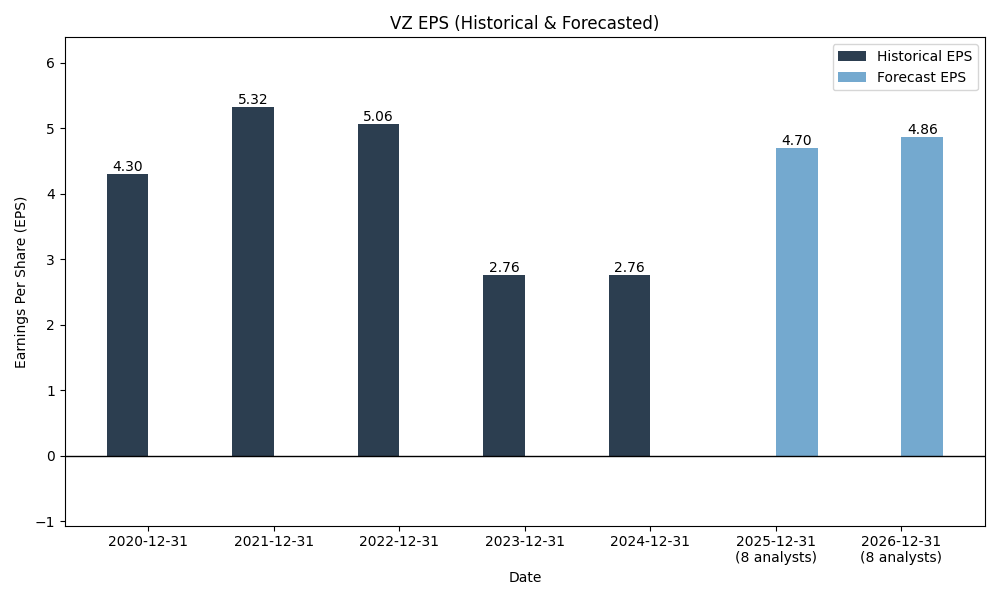
Forecasts
Y/Y % Change
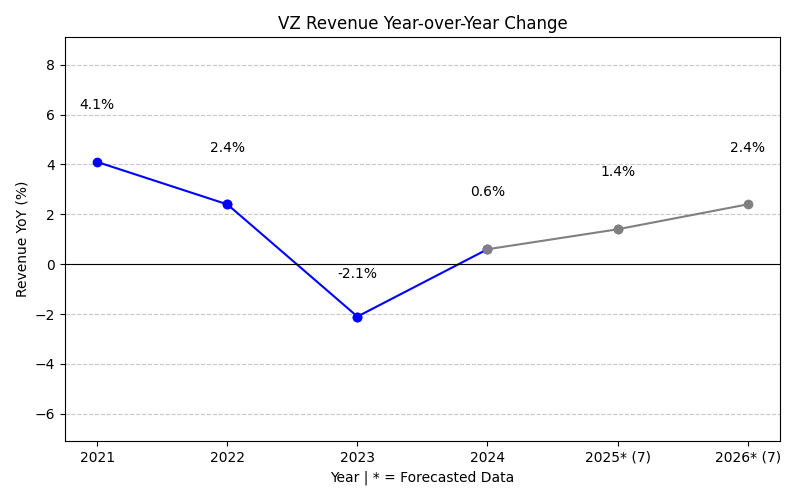
VZ Year-over-Year Growth
| 2020 | 2021 | 2022 | 2023 | 2024 | 2025 | 2026 | 2027 | Average | |
|---|---|---|---|---|---|---|---|---|---|
| Revenue Growth (%) | 6.7% | 0.0% | -2.1% | 0.6% | 2.5% | 3.4% | 1.4% | 1.8% | |
| Revenue Analysts (#) | 0 | 0 | 0 | 0 | 0 | 0 | 22 | 21 | |
| EPS Growth (%) | 19.4% | 0.0% | -45.4% | 50.7% | -1.9% | 20.9% | 6.1% | 7.1% | |
| EPS Analysts (#) | 0 | 0 | 0 | 0 | 0 | 0 | 16 | 23 |
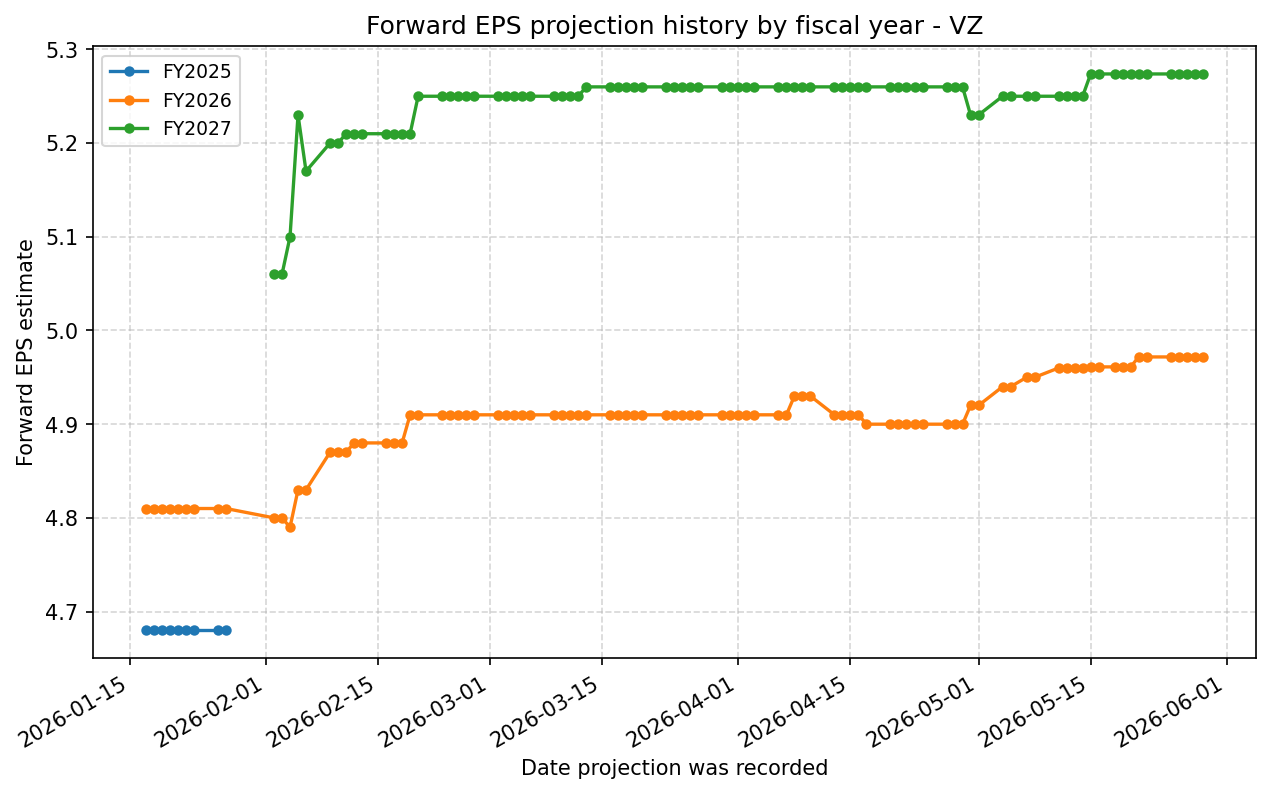
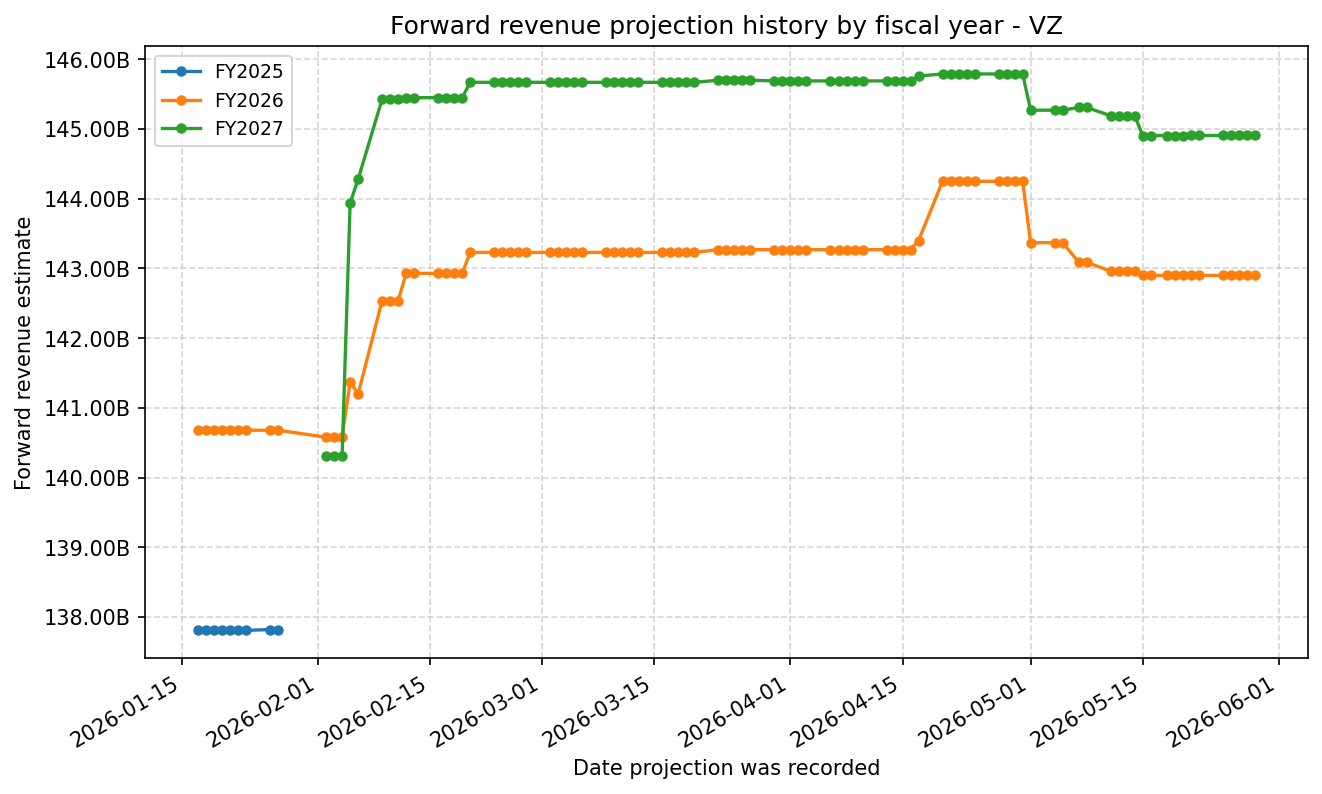
Forward Estimate History
How the next-FY EPS and revenue estimates have drifted over time. One line per fiscal year – past lines end when that FY became current.
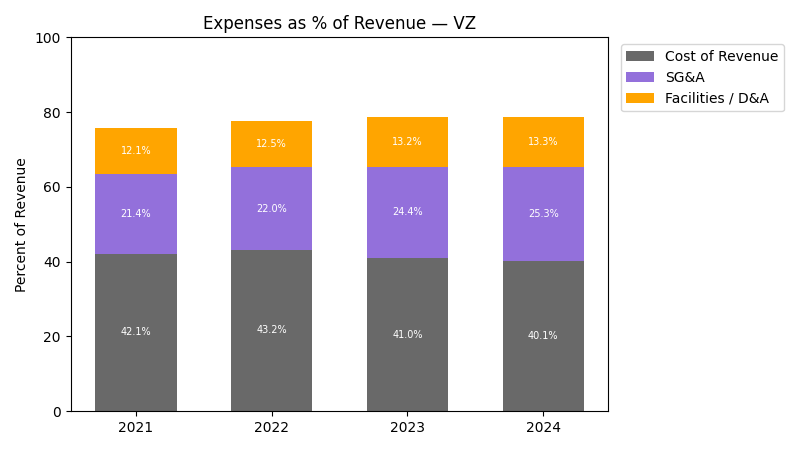
Expenses
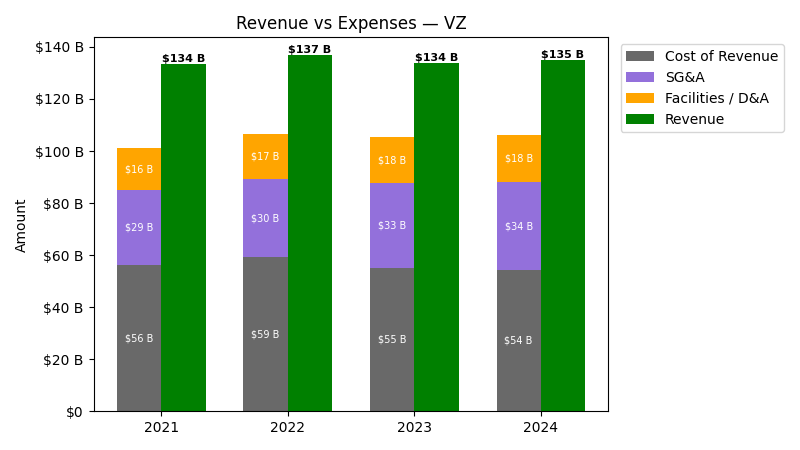
| Year | Revenue ($) | Cost of Revenue ($) | SG&A ($) | Facilities / D&A ($) |
|---|---|---|---|---|
| 2022 | $136.8B | $42.0B | $30.1B | $17.1B |
| 2023 | $134.0B | $37.3B | $32.7B | $17.6B |
| 2024 | $134.8B | $36.2B | $34.1B | $17.9B |
| 2025 | $138.2B | $38.4B | $33.8B | $18.3B |
| TTM | $139.1B | $38.7B | $33.6B | $18.7B |
| Year | Revenue Change (%) | Cost of Revenue Change (%) | SG&A Change (%) | Facilities / D&A Change (%) |
|---|---|---|---|---|
| 2023 | -2.09 | -11.35 | 8.66 | 3.07 |
| 2024 | 0.61 | -2.84 | 4.18 | 1.52 |
| 2025 | 2.52 | 6.11 | -0.86 | 2.55 |
| TTM | 0.69 | 0.79 | -0.71 | 1.72 |
No unmapped expenses.
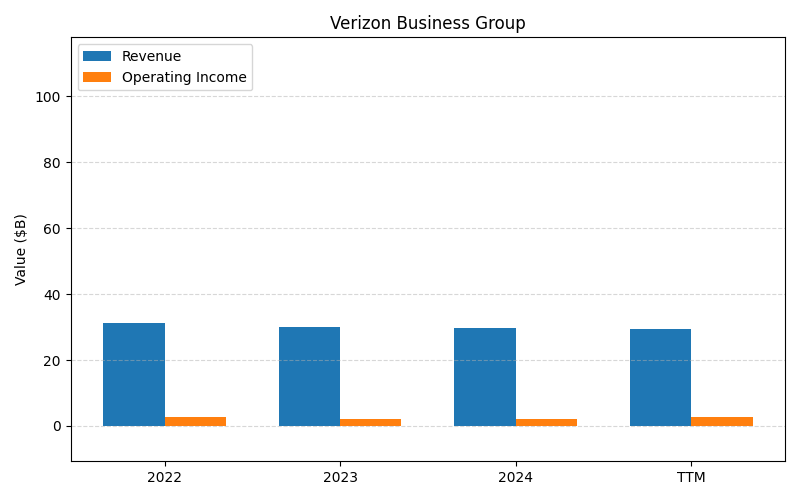
Segment Performance
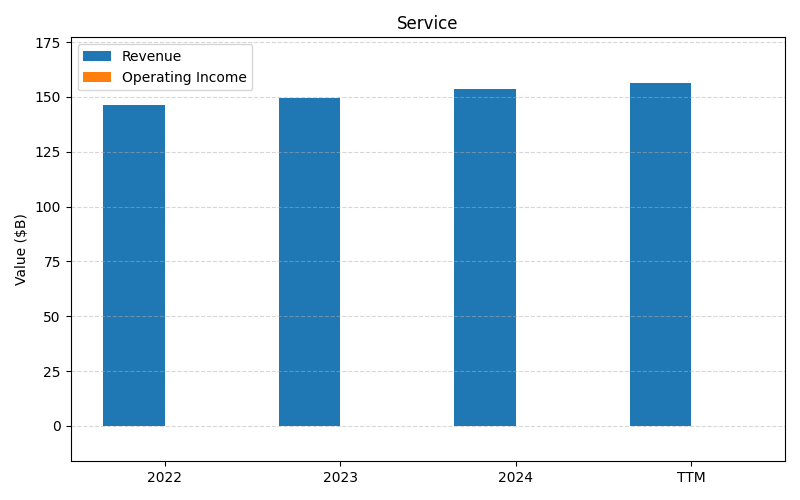
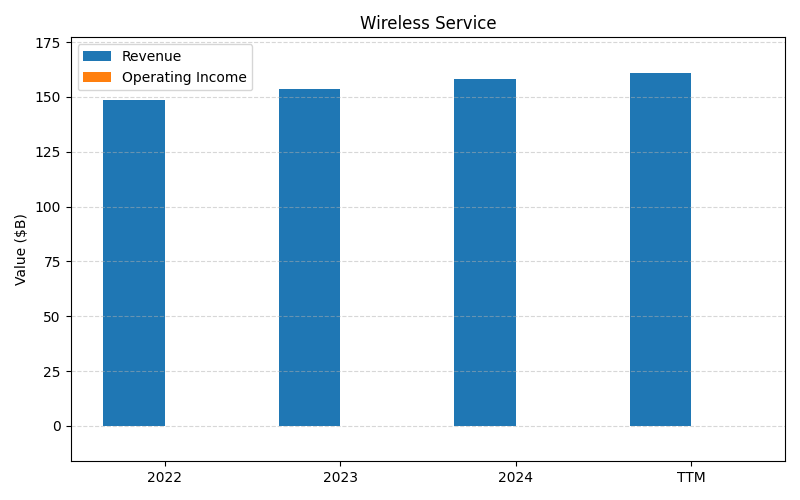
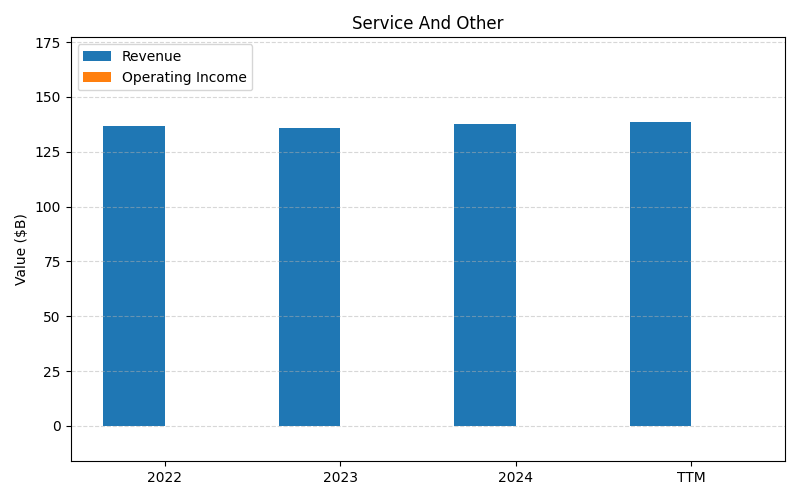
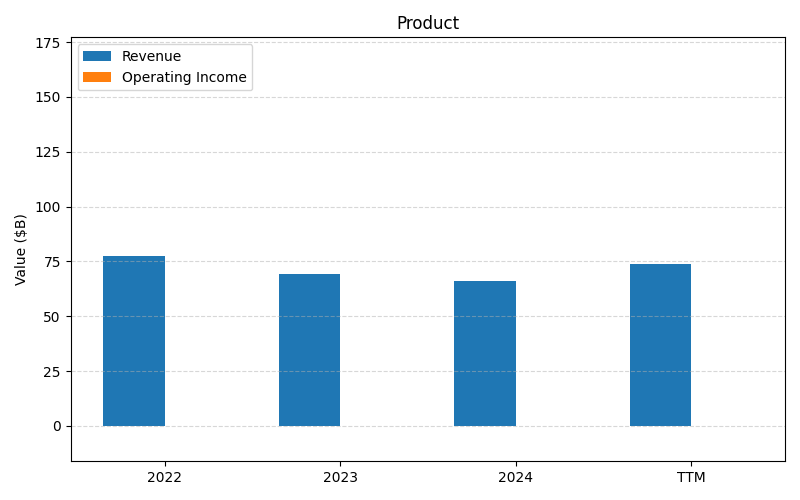
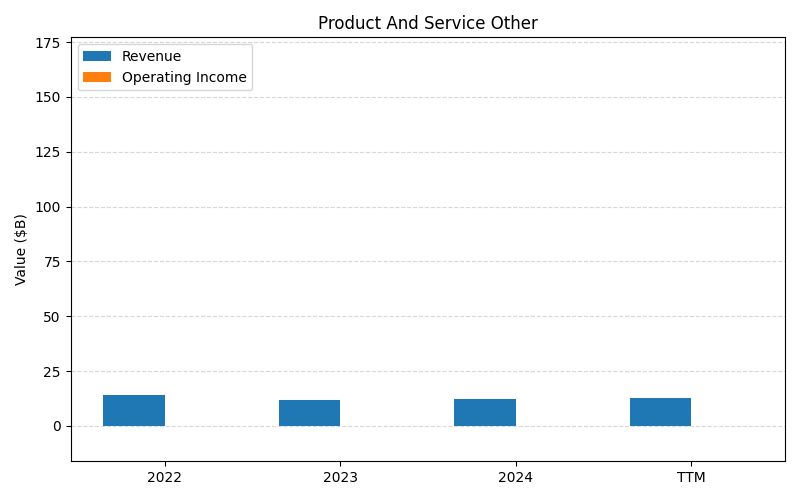
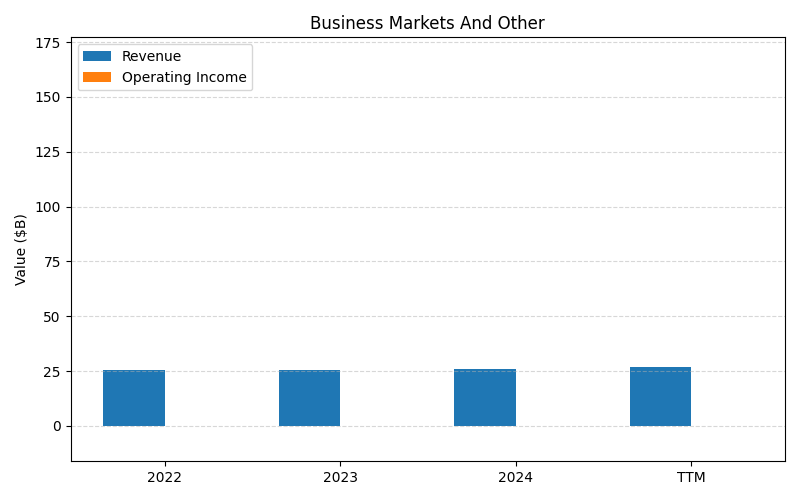
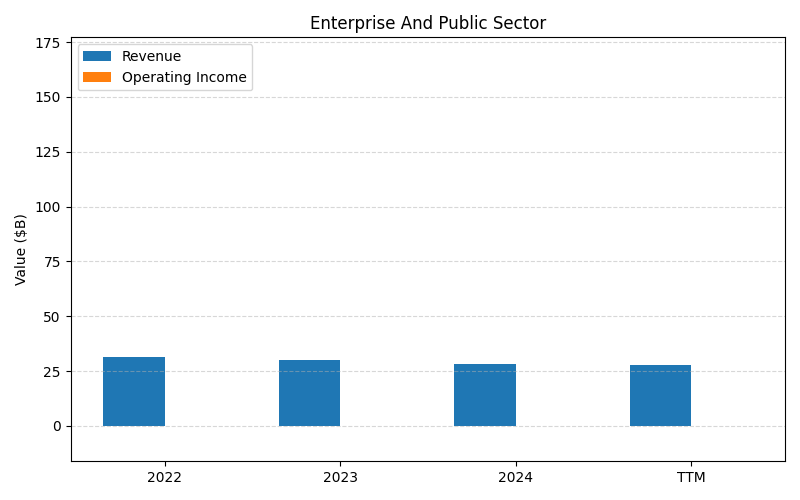
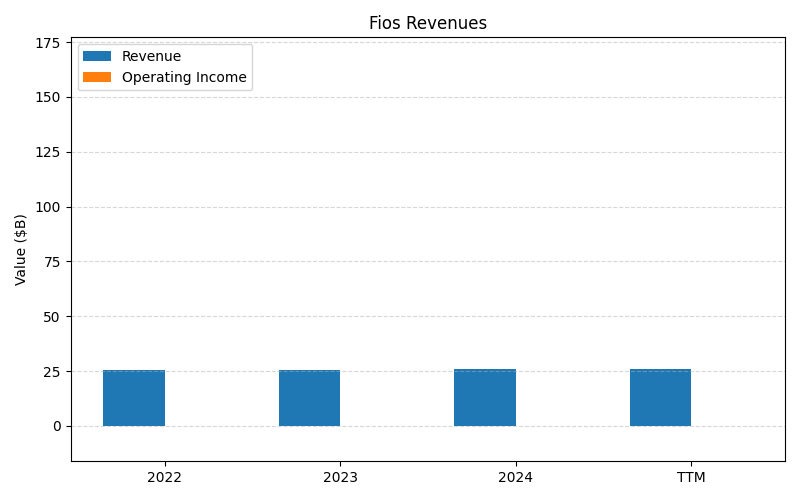
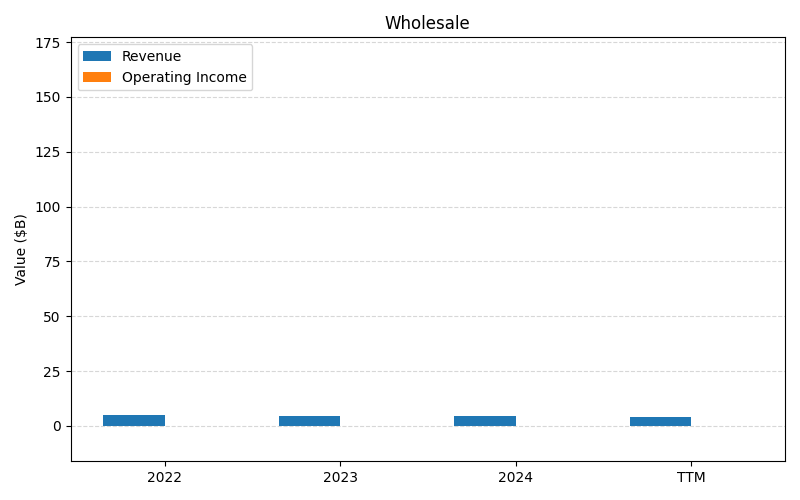
SEGMENTS v2025-09-09 · 2026-05-29 09:16 UTC — Units: $B. Rows list fiscal years (last 3 + TTM) with revenue for each segment; the final row shows the TTM revenue mix (operating income columns display “—” where mix is not applicable).
| Year | Services Rev | Wireless Service Rev | Service And Other Rev | Prod Rev | Product And Service Other Rev | Business Markets And Other Rev | Enterprise And Public Sector Rev | Fios Revenues Rev | Wholesale Rev | Total Rev |
|---|---|---|---|---|---|---|---|---|---|---|
| 2023 | 154.3B | 159.1B | 136.1B | 69.3B | 7.29B | 25.4B | 30.2B | 25.7B | 4.63B | 611.8B |
| 2024 | 158.5B | 164.1B | 137.5B | 66B | 7.70B | 26.2B | 28.4B | 25.8B | 4.39B | 618.6B |
| 2025 | 161.2B | 167.4B | 138.1B | 72.7B | 8.23B | 27.1B | 27.1B | 25.8B | 3.91B | 631.6B |
| TTM | 410.2B | 373B | 332.4B | 172B | 36.5B | – | – | – | – | 1324.1B |
| % of Total (TTM) | 31.0% | 28.2% | 25.1% | 13.0% | 2.8% | – | – | – | – | 100% |
Segment Performance (Axis 2)
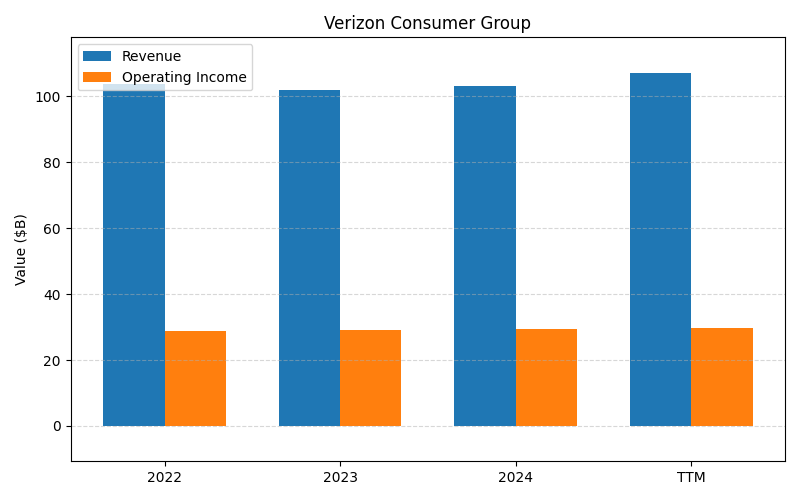
SEGMENTS v2025-09-09 · 2026-05-29 09:16 UTC — Units: $B. Rows list fiscal years (last 3 + TTM) with revenue and operating income for each segment; the final row shows the TTM revenue mix (operating income columns display “—” where mix is not applicable).
| Year | Verizon Consumer Group Rev | Verizon Consumer Group OI | Verizon Business Group Rev | Verizon Business Group OI | Total Rev | Total OI |
|---|---|---|---|---|---|---|
| 2023 | 101.8B | 29B | 30.2B | 2.07B | 132B | 31.1B |
| 2024 | 103.1B | 29.5B | 29.6B | 2.06B | 132.7B | 31.5B |
| 2025 | 107.1B | 29.6B | 29.1B | 2.53B | 136.2B | 32.2B |
| TTM | 262.4B | 74.2B | 73.4B | 6.14B | 335.8B | 80.4B |
| % of Total (TTM) | 78.1% | — | 21.9% | — | 100% | — |
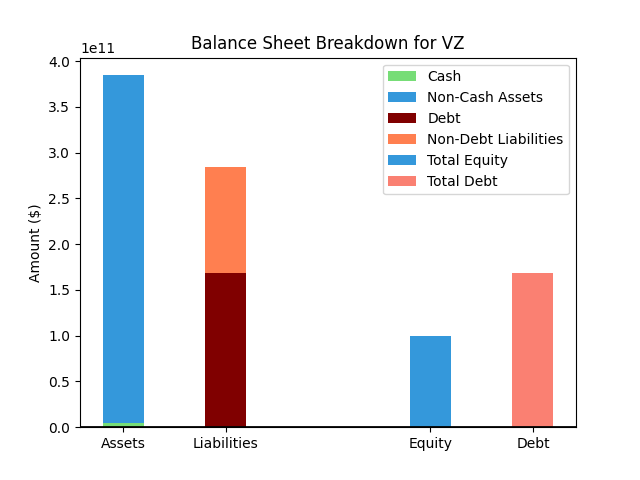
Balance Sheet
| Metric | Value | |
|---|---|---|
| 0 | Total Assets | $417,882M |
| 1 | Cash | $8,366M |
| 2 | Total Liabilities | $313,260M |
| 3 | Total Debt | $195,872M |
| 4 | Total Equity | $103,309M |
| 5 | Debt to Equity Ratio | 1.90 |
EPS & Dividend
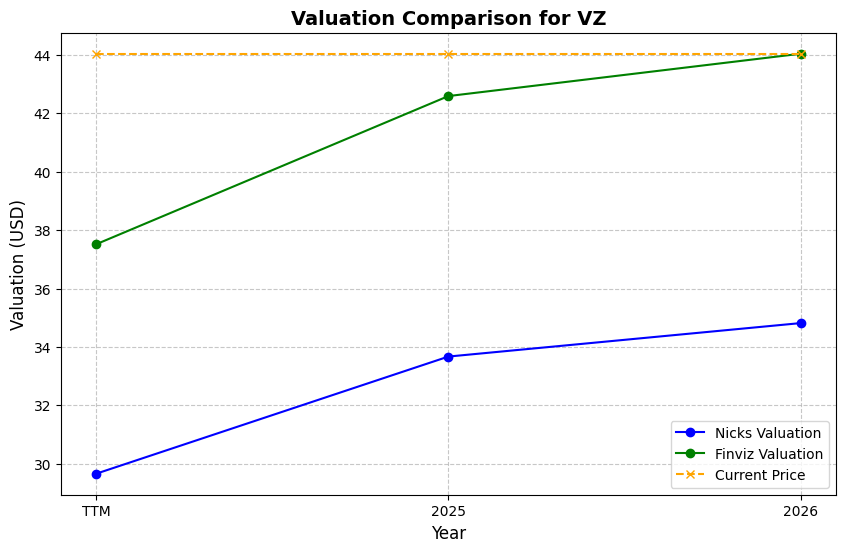
Valuation
| Share Price | Treasury Yield | Estimates | Fair Value (P/E) | Fair Value (P/S) | Current P/S | Current P/E |
|---|---|---|---|---|---|---|
| $47.81 | 4.5% | Nicks Growth: 1% Nick's Expected Margin: 15% FINVIZ Growth: 6% |
Nicks: 7 Finviz: 12 |
Nick's: 1.056 | 1.4 | 11.7 |
| Basis | Year | Nicks Valuation | Nicks vs Share Price | Finviz Valuation | Finviz vs Share Price |
|---|---|---|---|---|---|
| $4.10 EPS | TTM | $28.85 | -39.7% | $48.94 | 2.4% |
| $4.97 EPS | 2026 | $34.99 | -26.8% | $59.35 | 24.1% |
| $5.27 EPS | 2027 | $37.11 | -22.4% | $62.96 | 31.7% |
Implied Growth
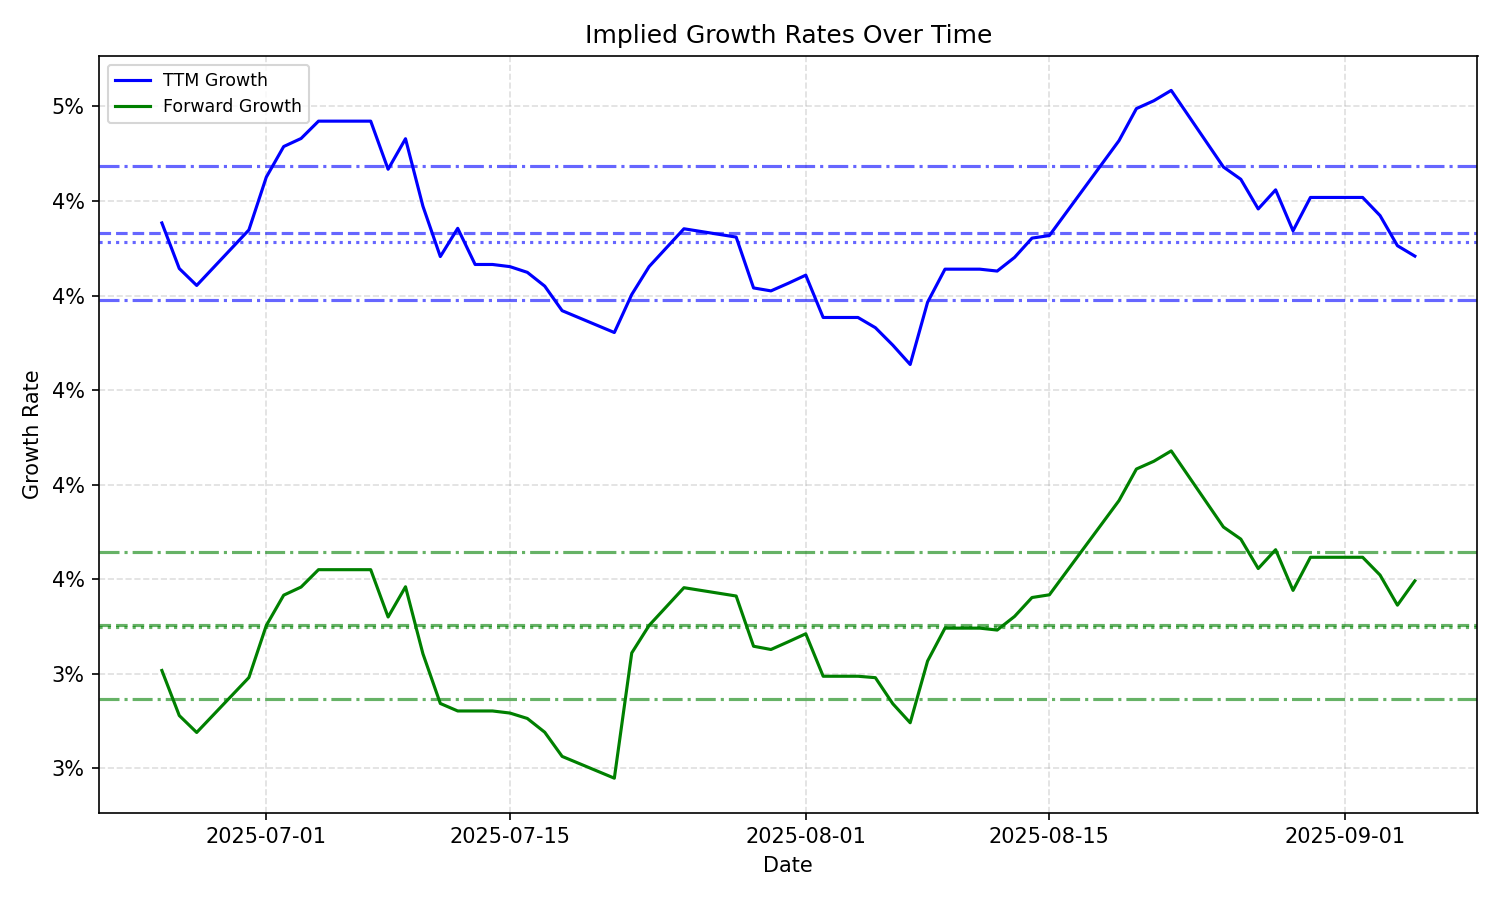
| Average | Median | Std Dev | Current | Percentile | ||||||
|---|---|---|---|---|---|---|---|---|---|---|
| TTM | Forward | TTM | Forward | TTM | Forward | TTM | Forward | TTM | Forward | |
| Timeframe | ||||||||||
| 1 Year | 4.43% | 3.11% | 4.33% | 3.26% | 1.36% | 0.51% | 6.05% | 3.52% | 83.4% | 80.1% |
| 3 Years | 4.43% | 3.11% | 4.33% | 3.26% | 1.36% | 0.51% | 6.05% | 3.52% | 83.4% | 80.1% |
| 5 Years | 4.43% | 3.11% | 4.33% | 3.26% | 1.36% | 0.51% | 6.05% | 3.52% | 83.4% | 80.1% |
| 10 Years | 4.43% | 3.11% | 4.33% | 3.26% | 1.36% | 0.51% | 6.05% | 3.52% | 83.4% | 80.1% |