VeriSign, Inc. — VRSN
| Close Price | Market Cap | P/E Ratio | Forward P/E Ratio | Implied Growth* | Implied Forward Growth* | Dividend | P/B Ratio |
|---|---|---|---|---|---|---|---|
| $285.38 | $25.97B | 31.5 | 26.8 | 16.6% | 14.8% | $3.24 1.1% | -11.7 |
Latest Headlines
- · What Are Wall Street Analysts' Target Price for VeriSign Stock?
- · The Bull Case For VeriSign (VRSN) Could Change Following Strong Q1, Higher Guidance And Dividend News - Learn Why
- · Is VeriSign, Inc. (VRSN) A Good Stock To Buy Now?
- · VeriSign, Inc. Q1 2026 Earnings Call Summary
- · VeriSign Inc (VRSN) Q1 2026 Earnings Call Highlights: Strong Revenue Growth and Record Domain ...
- · VeriSign Q1 Earnings Call Highlights
Revenue & Net Income
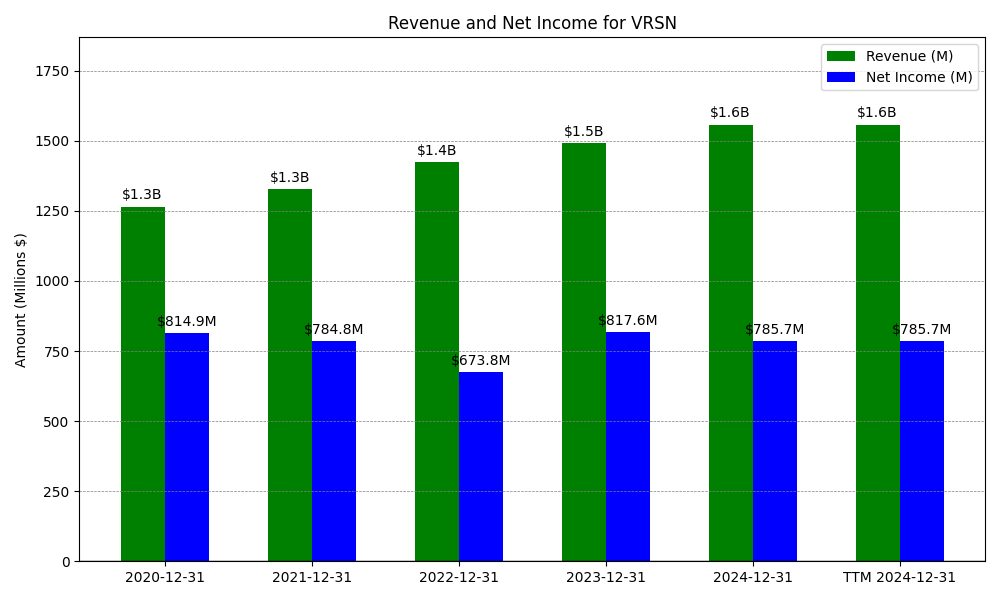
| Date | Revenue | Net_Income | EPS | Last_Updated | Revenue_Change | Net_Income_Change | EPS_Change | |
|---|---|---|---|---|---|---|---|---|
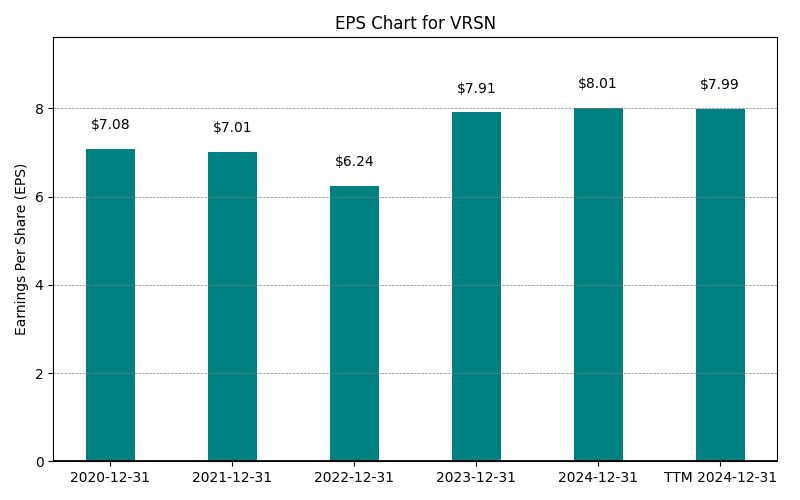
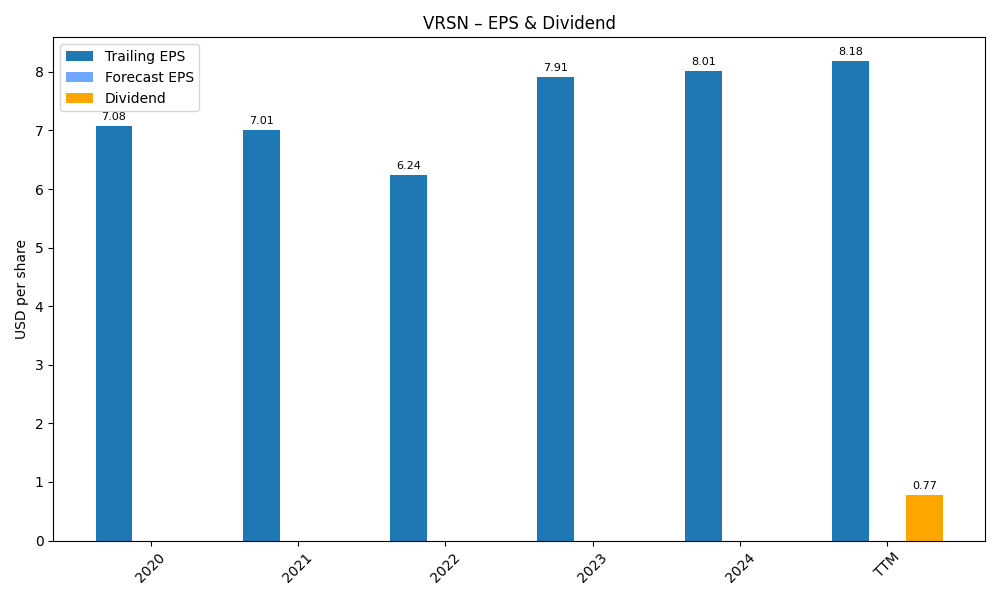
| 0 | 2020-12-31 | $1,265M | $815M | $7.08 | 2024-02-09 04:07:31 | N/A | N/A | N/A |
| 1 | 2021-12-31 | $1,328M | $785M | $7.01 | 2026-02-06 08:43:52 | 4.9% | -3.7% | -1.0% |
| 2 | 2022-12-31 | $1,425M | $674M | $6.24 | 2026-05-29 09:16:12 | 7.3% | -14.1% | -11.0% |
| 3 | 2023-12-31 | $1,493M | $818M | $7.91 | 2026-05-29 09:16:12 | 4.8% | 21.3% | 26.8% |
| 4 | 2024-12-31 | $1,557M | $786M | $8.01 | 2026-05-29 09:16:12 | 4.3% | -3.9% | 1.3% |
| 5 | 2025-12-31 | $1,657M | $826M | $8.83 | 2026-05-29 09:16:12 | 6.4% | 5.1% | 10.2% |
| 6 | TTM 2026-03-31 | $1,683M | $841M | $9.06 | 2026-04-27 09:00:45 | 1.6% | 1.8% | 2.6% |
EPS
Forecasts


Y/Y % Change


VRSN Year-over-Year Growth
| 2020 | 2021 | 2022 | 2023 | 2024 | 2025 | 2026 | 2027 | Average | |
|---|---|---|---|---|---|---|---|---|---|
| Revenue Growth (%) | 4.9% | 7.3% | 4.8% | 4.3% | 6.4% | 5.1% | 5.9% | 5.5% | |
| Revenue Analysts (#) | 0 | 0 | 0 | 0 | 0 | 0 | 4 | 4 | |
| EPS Growth (%) | -3.7% | -14.1% | 21.3% | -3.9% | 5.1% | 4.2% | 9.0% | 2.6% | |
| EPS Analysts (#) | 0 | 0 | 0 | 0 | 0 | 0 | 3 | 3 |
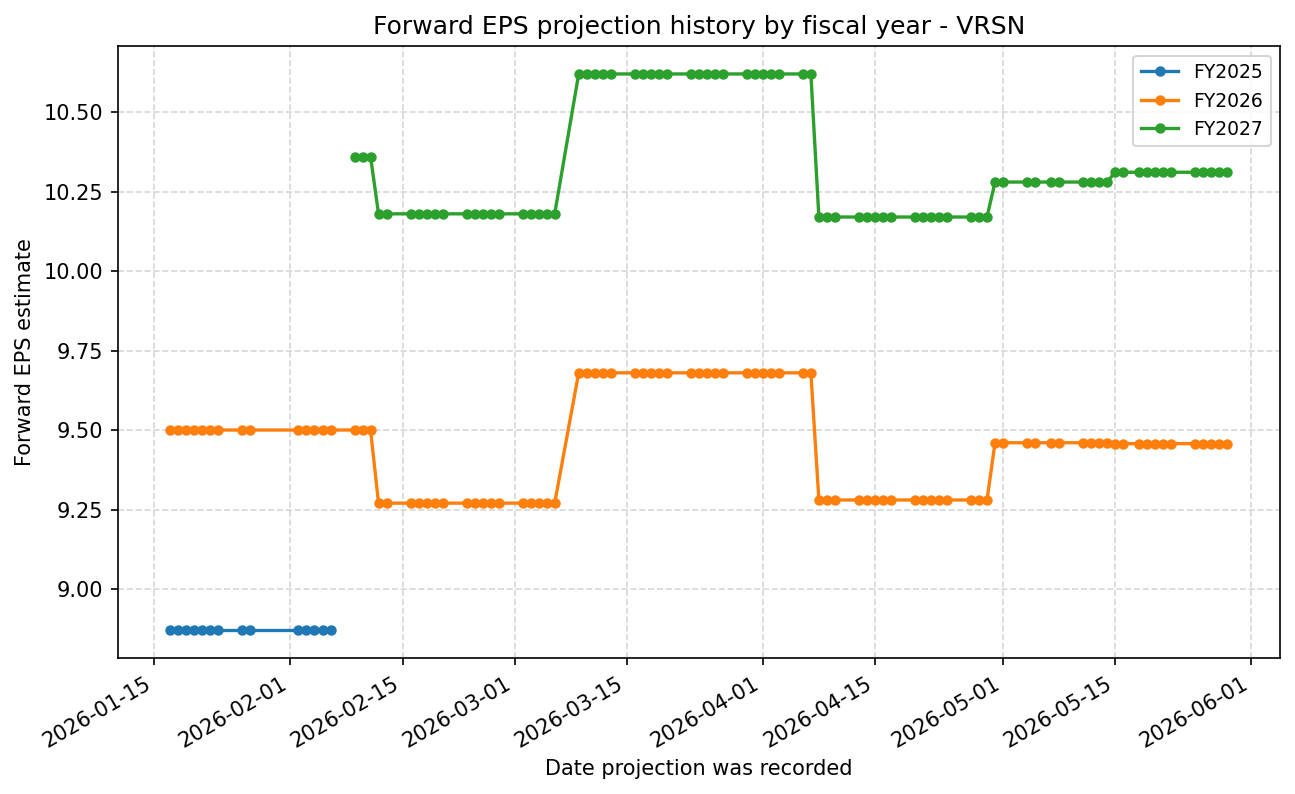
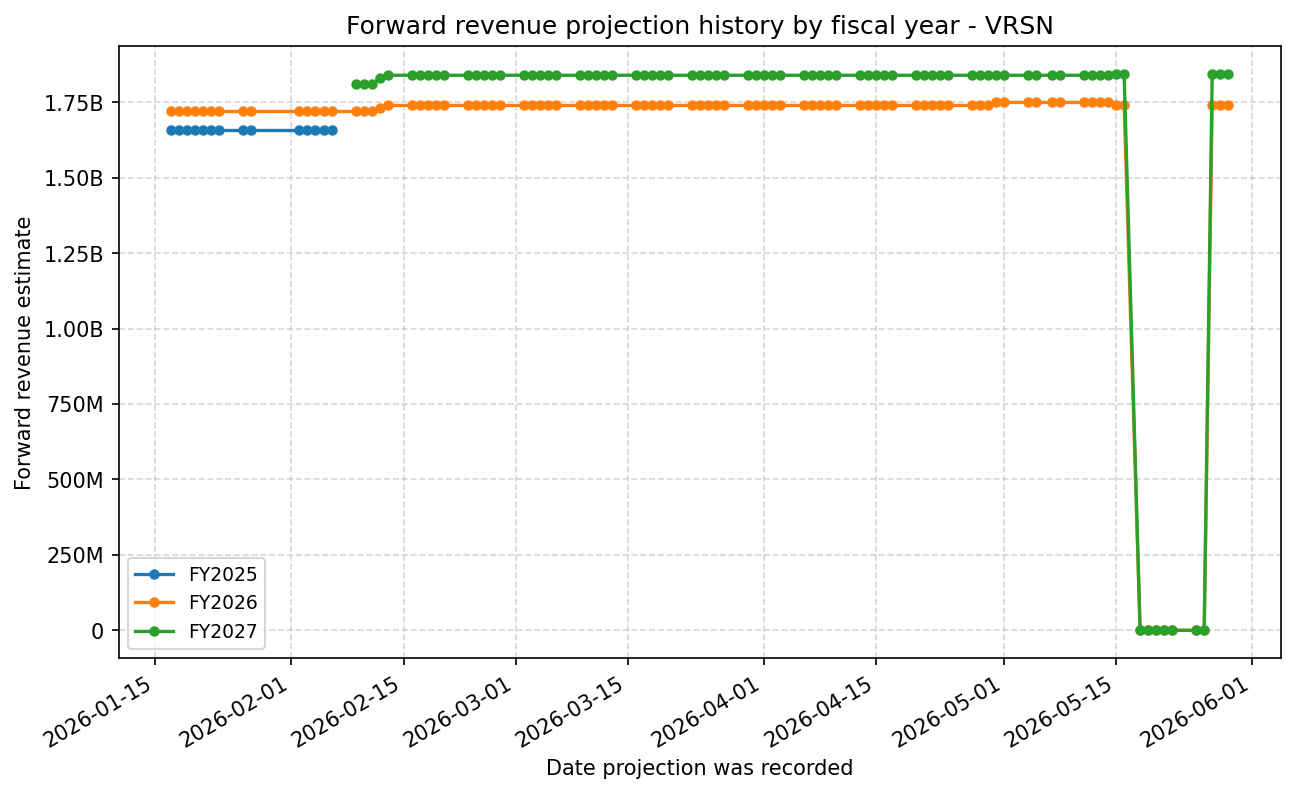
Forward Estimate History
How the next-FY EPS and revenue estimates have drifted over time. One line per fiscal year – past lines end when that FY became current.
Expenses
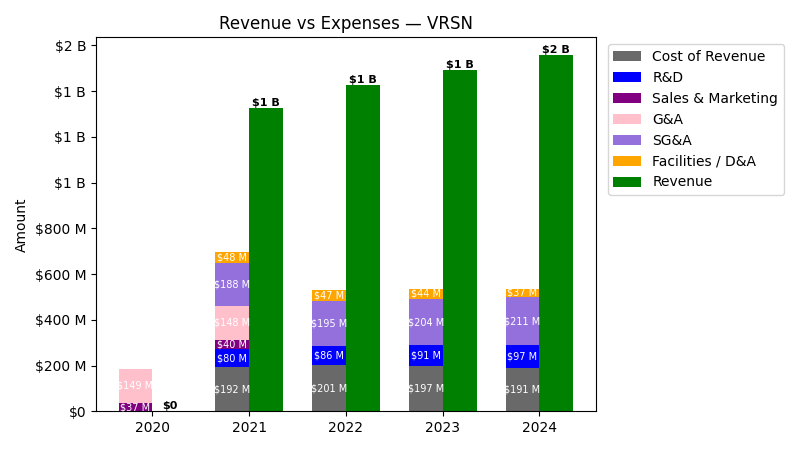
| Year | Revenue ($) | Cost of Revenue ($) | R&D ($) | SG&A ($) | Facilities / D&A ($) |
|---|---|---|---|---|---|
| 2022 | $1.4B | $153.8M | $85.7M | $195.4M | $46.9M |
| 2023 | $1.5B | $153.2M | $91.0M | $204.2M | $44.1M |
| 2024 | $1.6B | $154.5M | $96.7M | $211.1M | $36.9M |
| 2025 | $1.7B | $165.1M | $103.6M | $235.7M | $31.2M |
| TTM | $1.7B | $167.4M | $105.1M | $238.6M | $28.7M |
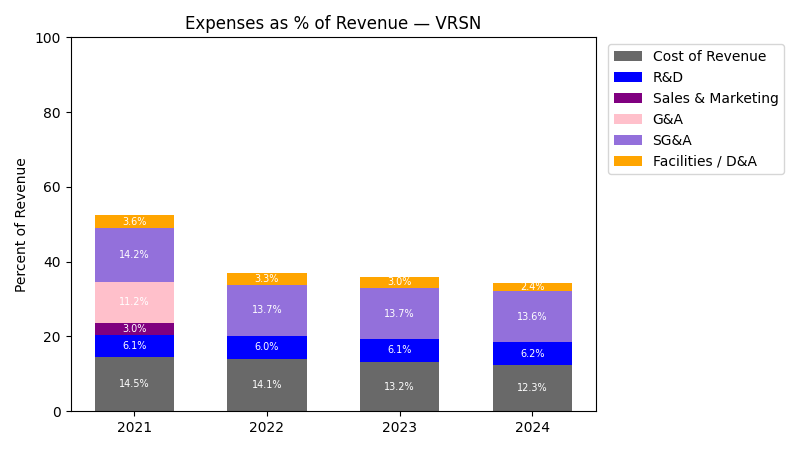
| Year | Revenue Change (%) | Cost of Revenue Change (%) | R&D Change (%) | SG&A Change (%) | Facilities / D&A Change (%) |
|---|---|---|---|---|---|
| 2023 | 4.79 | -0.39 | 6.18 | 4.50 | -5.97 |
| 2024 | 4.31 | 0.85 | 6.26 | 3.38 | -16.33 |
| 2025 | 6.37 | 6.86 | 7.14 | 11.65 | -15.45 |
| TTM | 1.61 | 1.39 | 1.45 | 1.23 | -8.01 |
No unmapped expenses.
Balance Sheet
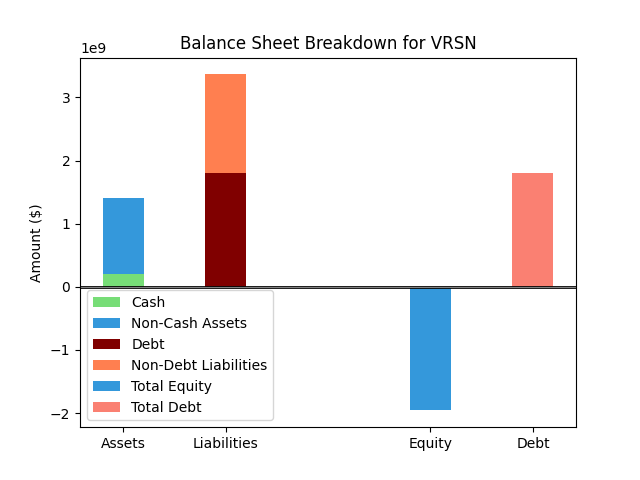
| Metric | Value | |
|---|---|---|
| 0 | Total Assets | $1,297M |
| 1 | Cash | $477M |
| 2 | Total Liabilities | $3,511M |
| 3 | Total Debt | $1,795M |
| 4 | Total Equity | $-2,213M |
| 5 | Debt to Equity Ratio | -0.81 |
EPS & Dividend
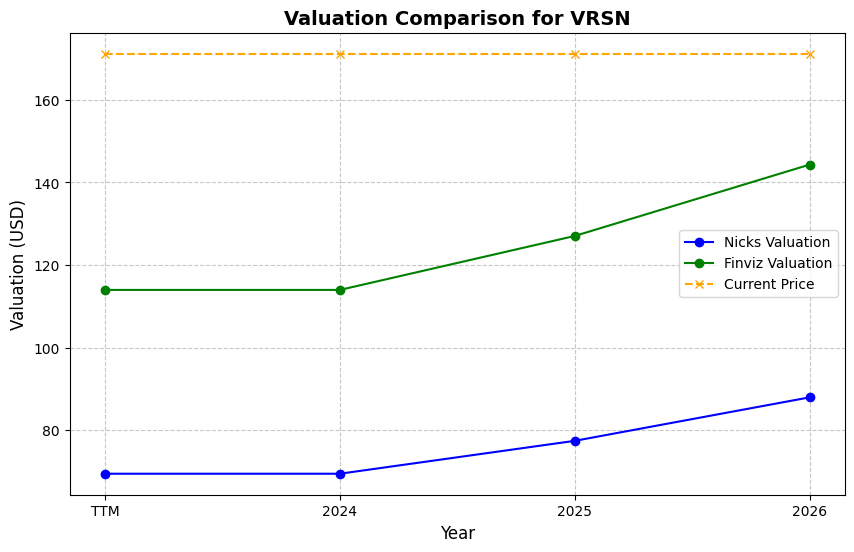
Valuation
| Share Price | Treasury Yield | Estimates | Fair Value (P/E) | Fair Value (P/S) | Current P/S | Current P/E |
|---|---|---|---|---|---|---|
| $285.38 | 4.5% | Nicks Growth: 3% Nick's Expected Margin: 55% FINVIZ Growth: 12% |
Nicks: 9 Finviz: 21 |
Nick's: 4.751 | 15.4 | 31.5 |
| Basis | Year | Nicks Valuation | Nicks vs Share Price | Finviz Valuation | Finviz vs Share Price |
|---|---|---|---|---|---|
| $9.06 EPS | TTM | $78.26 | -72.6% | $188.95 | -33.8% |
| $9.46 EPS | 2026 | $81.70 | -71.4% | $197.23 | -30.9% |
| $10.31 EPS | 2027 | $89.07 | -68.8% | $215.03 | -24.7% |
Implied Growth
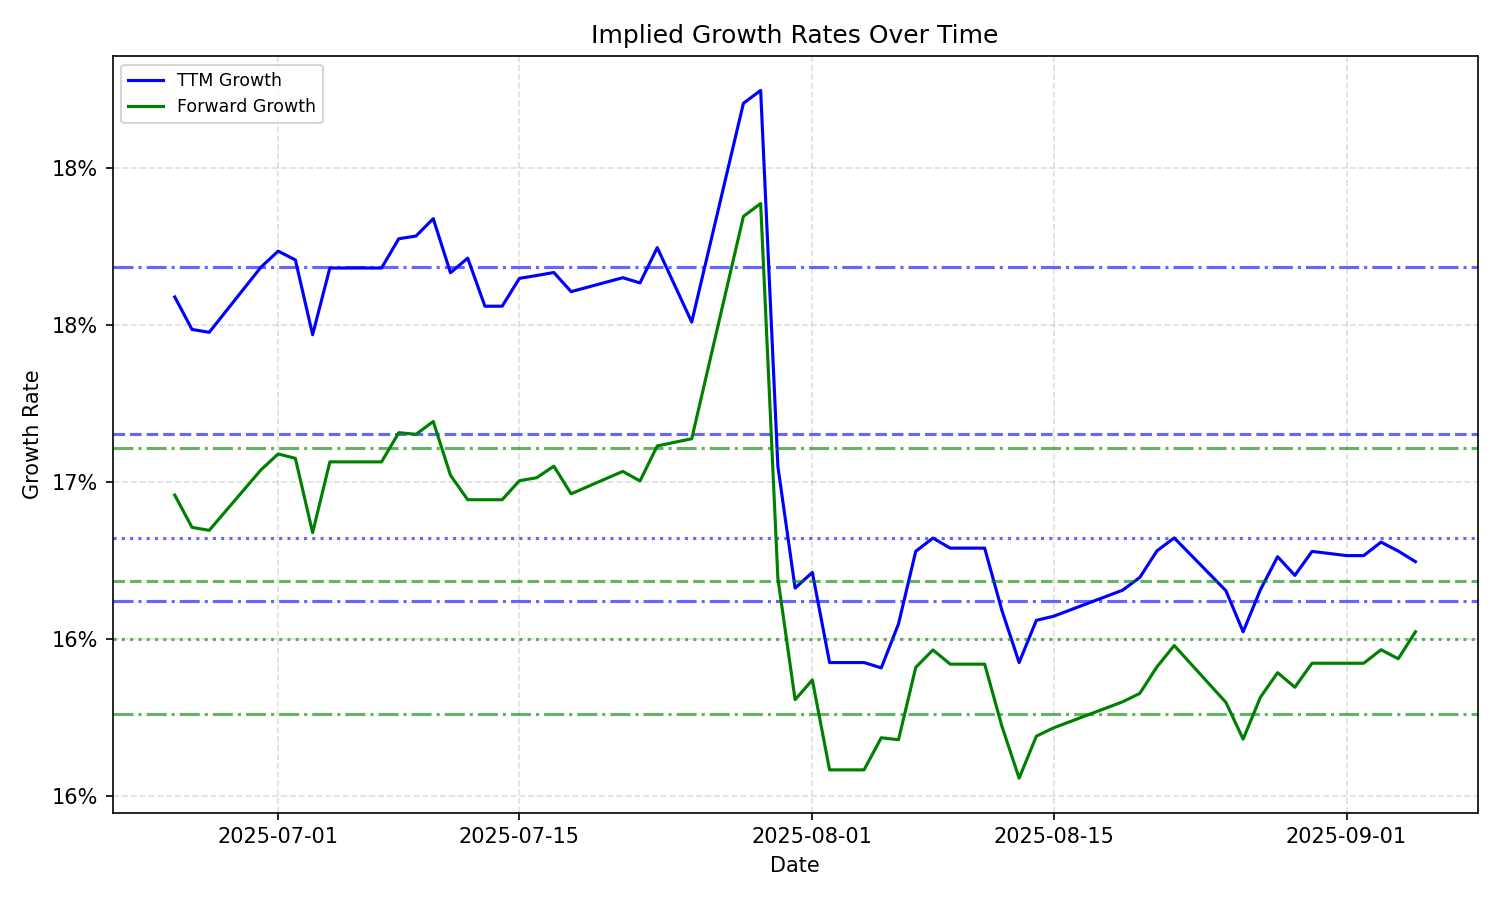
| Average | Median | Std Dev | Current | Percentile | ||||||
|---|---|---|---|---|---|---|---|---|---|---|
| TTM | Forward | TTM | Forward | TTM | Forward | TTM | Forward | TTM | Forward | |
| Timeframe | ||||||||||
| 1 Year | 16.02% | 15.11% | 16.14% | 15.25% | 1.14% | 1.48% | 17.03% | 15.22% | 77.2% | 48.1% |
| 3 Years | 16.02% | 15.11% | 16.14% | 15.25% | 1.14% | 1.48% | 17.03% | 15.22% | 77.2% | 48.1% |
| 5 Years | 16.02% | 15.11% | 16.14% | 15.25% | 1.14% | 1.48% | 17.03% | 15.22% | 77.2% | 48.1% |
| 10 Years | 16.02% | 15.11% | 16.14% | 15.25% | 1.14% | 1.48% | 17.03% | 15.22% | 77.2% | 48.1% |