Valero Energy Corporation — VLO
| Close Price | Market Cap | P/E Ratio | Forward P/E Ratio | Implied Growth* | Implied Forward Growth* | Dividend | P/B Ratio |
|---|---|---|---|---|---|---|---|
| $244.82 | $72.70B | 17.9 | 12.2 | 10.4% | 6.5% | $4.80 2.0% | 3.1 |
Latest Headlines
- · BP Eyes Growth Offshore Azerbaijan With Babek Gas Field Project
- · Brokers Suggest Investing in Valero Energy (VLO): Read This Before Placing a Bet
- · ExxonMobil Seeks Guyana EPA Clearance for Ninth Stabroek Development
- · Stocks Mixed Awaiting Fresh Iran News
- · Stocks Finish Mostly Higher on Iran Peace Progress
- · Is Valero Energy a Better Pick Than SM Despite Oil Trading Above $90?
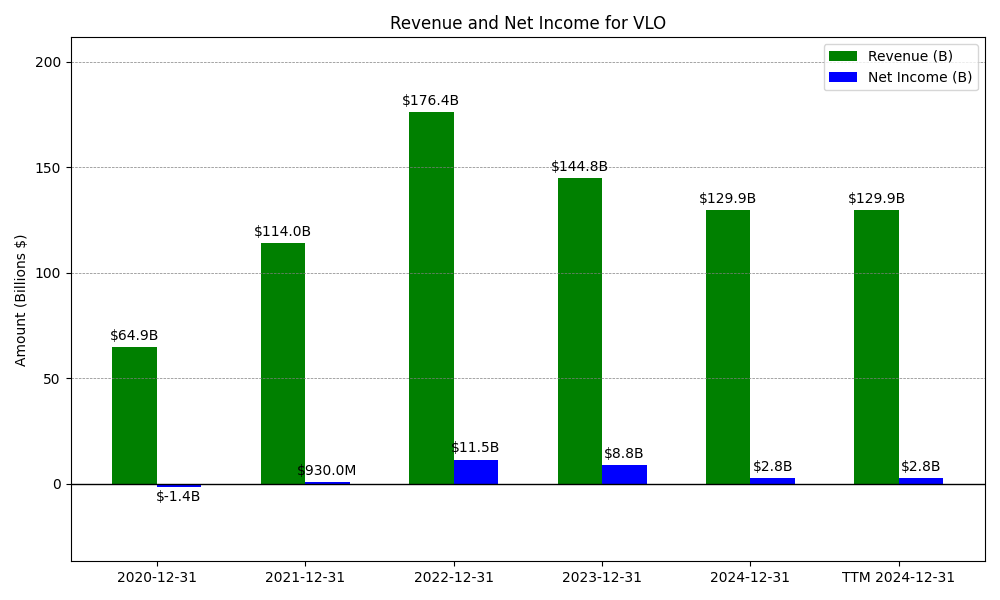
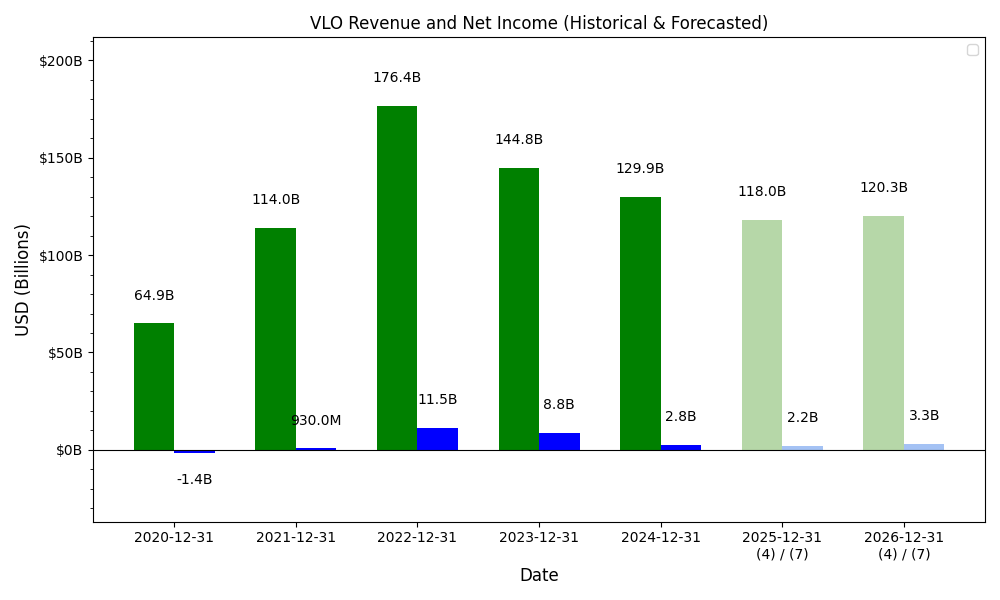
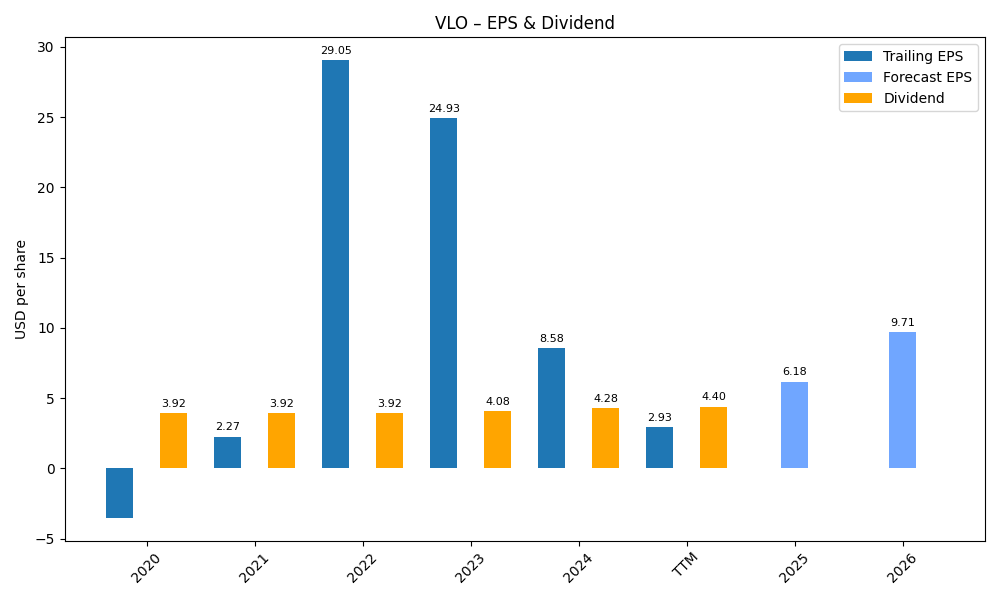
Revenue & Net Income
| Date | Revenue | Net_Income | EPS | Last_Updated | Revenue_Change | Net_Income_Change | EPS_Change | |
|---|---|---|---|---|---|---|---|---|
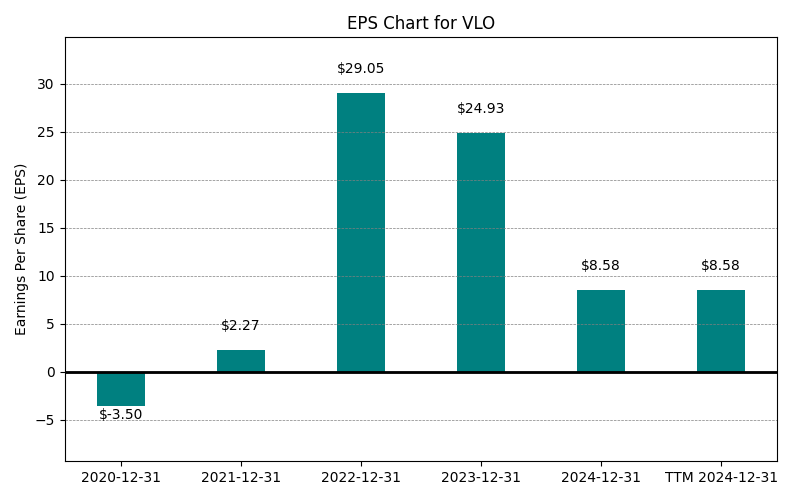
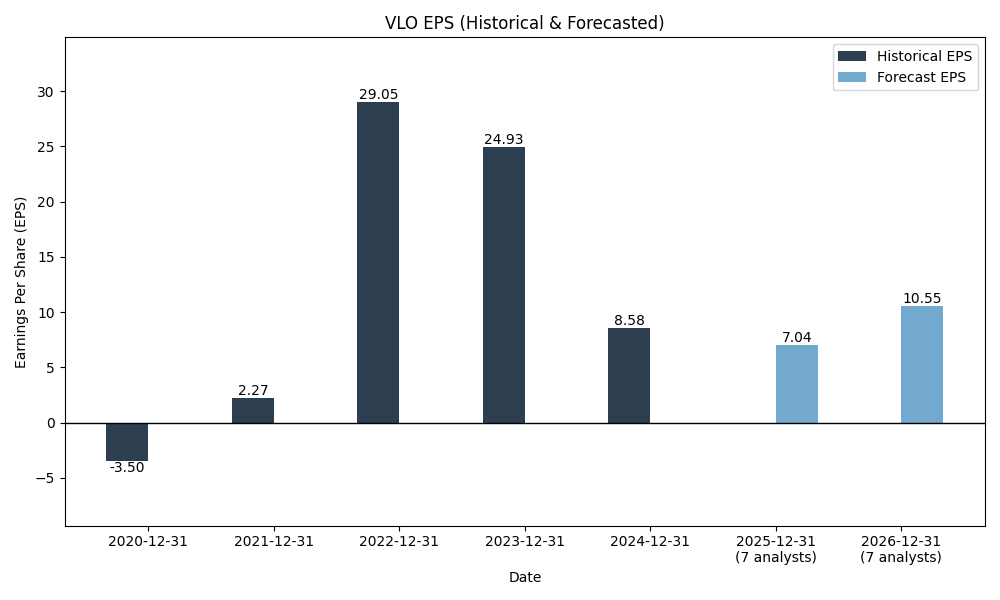
| 0 | 2020-12-31 | $64,912M | $-1,421M | $-3.50 | 2024-02-08 22:12:51 | N/A | N/A | N/A |
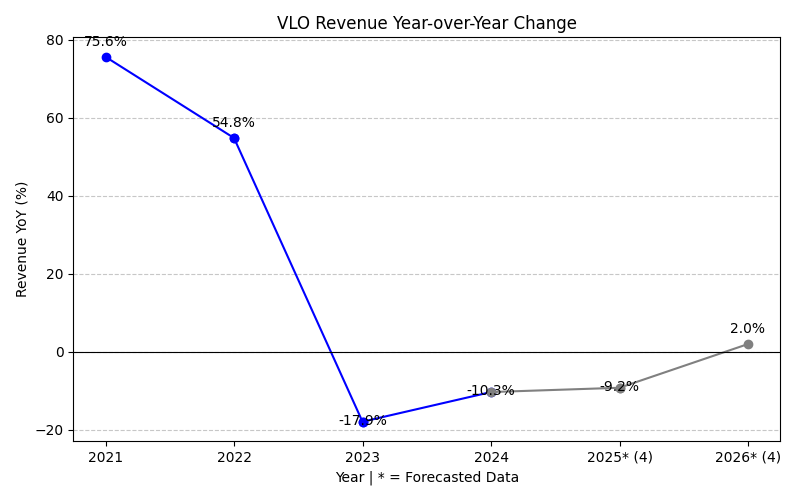
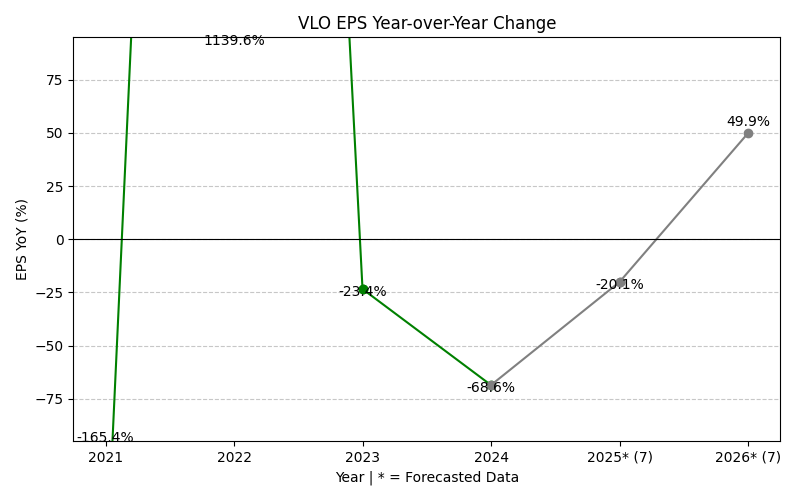
| 1 | 2021-12-31 | $113,977M | $930M | $29.05 | 2026-03-05 08:43:07 | 75.6% | -165.4% | -930.0% |
| 2 | 2022-12-31 | $176,383M | $11,528M | $29.05 | 2026-05-29 09:16:05 | 54.8% | 1139.6% | 0.0% |
| 3 | 2023-12-31 | $144,766M | $8,835M | $24.93 | 2026-05-29 09:16:05 | -17.9% | -23.4% | -14.2% |
| 4 | 2024-12-31 | $129,881M | $2,770M | $8.58 | 2026-05-29 09:16:05 | -10.3% | -68.6% | -65.6% |
| 5 | 2025-12-31 | $122,687M | $2,348M | $7.57 | 2026-05-29 09:16:05 | -5.5% | -15.2% | -11.8% |
| 6 | TTM 2026-03-31 | $124,810M | $4,206M | $13.69 | 2026-05-04 09:01:25 | 1.7% | 79.1% | 80.8% |
EPS
Forecasts
Y/Y % Change
VLO Year-over-Year Growth
| 2020 | 2021 | 2022 | 2023 | 2024 | 2025 | 2026 | 2027 | Average | |
|---|---|---|---|---|---|---|---|---|---|
| Revenue Growth (%) | 75.6% | 54.8% | -17.9% | -10.3% | -5.5% | 12.3% | -8.1% | 14.4% | |
| Revenue Analysts (#) | 0 | 0 | 0 | 0 | 0 | 0 | 11 | 12 | |
| EPS Growth (%) | -165.4% | 1139.6% | -23.4% | -68.6% | -15.2% | 270.1% | -28.2% | 158.4% | |
| EPS Analysts (#) | 0 | 0 | 0 | 0 | 0 | 0 | 17 | 18 |
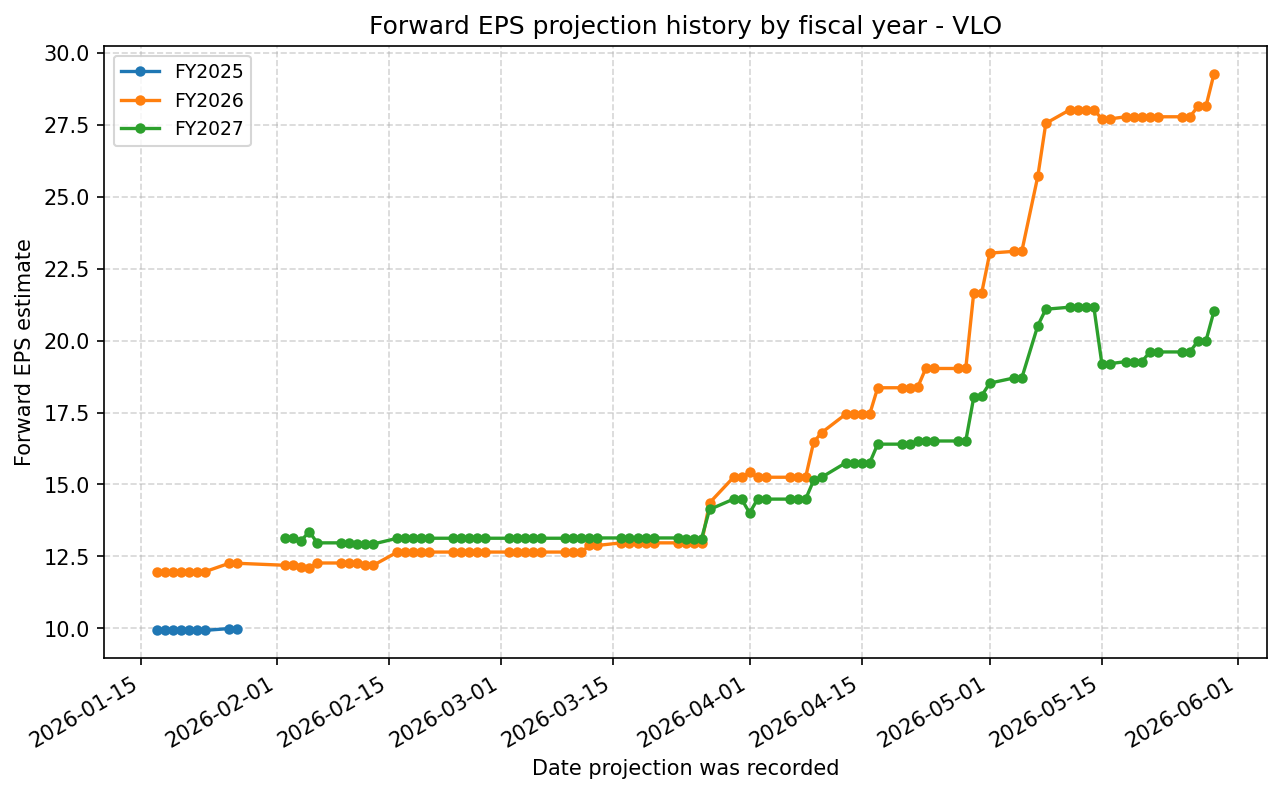
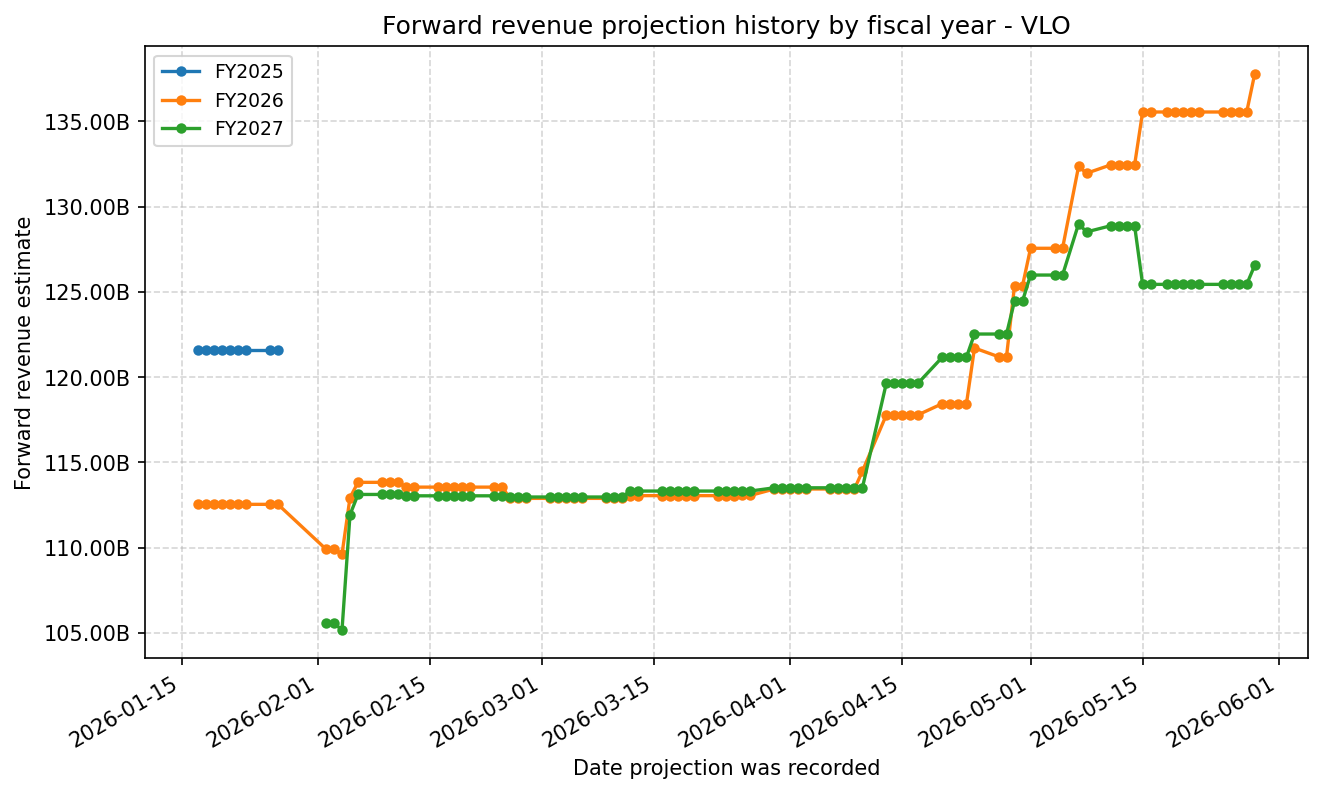
Forward Estimate History
How the next-FY EPS and revenue estimates have drifted over time. One line per fiscal year – past lines end when that FY became current.
Expenses
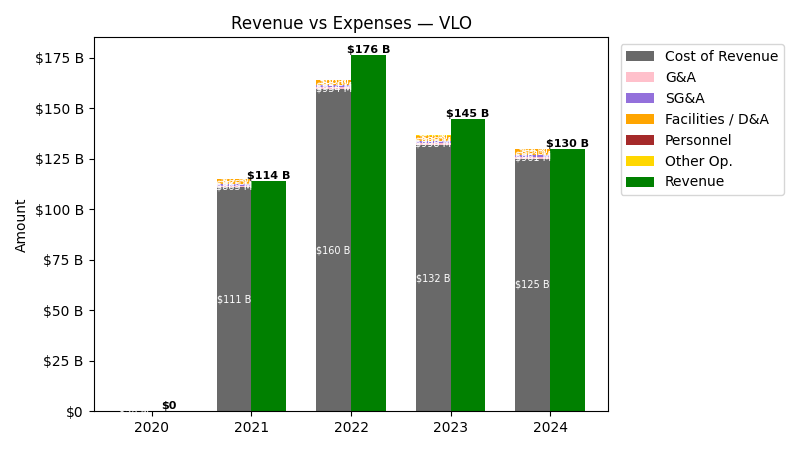
| Year | Revenue ($) | Cost of Revenue ($) | G&A ($) | SG&A ($) | Facilities / D&A ($) | Personnel ($) | Other Operating ($) |
|---|---|---|---|---|---|---|---|
| 2022 | $176.4B | $157.2B | $934.0M | $934.0M | $2.5B | $58.0M | $5.2B |
| 2023 | $144.8B | $129.2B | $998.0M | $998.0M | $2.7B | $0.0 | $5.8B |
| 2024 | $129.9B | $122.3B | $961.0M | $961.0M | $2.8B | $0.0 | $5.9B |
| 2025 | $122.7B | $114.2B | $1.0B | $1.0B | $3.2B | $0.0 | $6.7B |
| TTM | $124.8B | $114.6B | $1.1B | $1.1B | $3.3B | $0.0 | $7.0B |
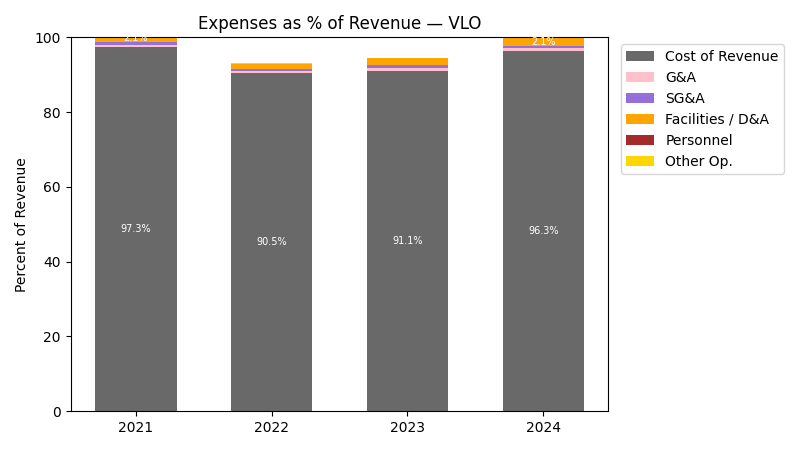
| Year | Revenue Change (%) | Cost of Revenue Change (%) | G&A Change (%) | SG&A Change (%) | Facilities / D&A Change (%) | Personnel Change (%) | Other Operating Change (%) |
|---|---|---|---|---|---|---|---|
| 2023 | -17.93 | -17.81 | 6.85 | 6.85 | 9.22 | -100.0 | 10.99 |
| 2024 | -10.28 | -5.29 | -3.71 | -3.71 | 2.70 | NaN | 2.46 |
| 2025 | -5.54 | -6.69 | 8.43 | 8.43 | 13.84 | NaN | 14.24 |
| TTM | 1.73 | 0.38 | 2.30 | 2.30 | 4.72 | NaN | 3.28 |
No unmapped expenses.
Segment Performance
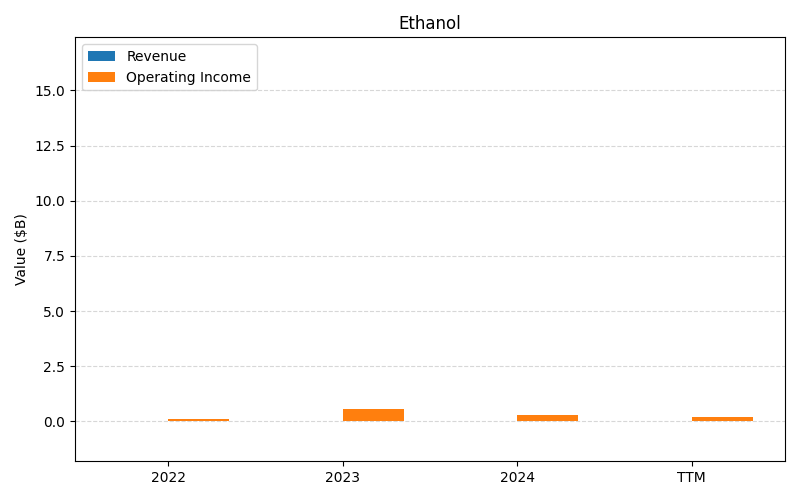
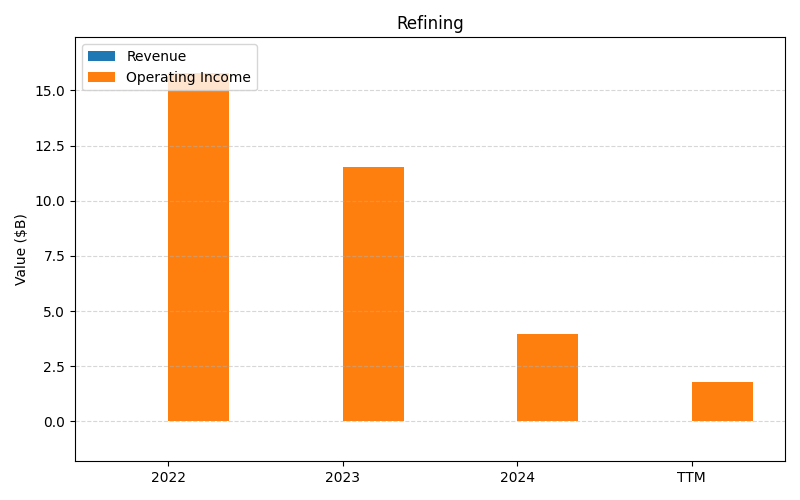
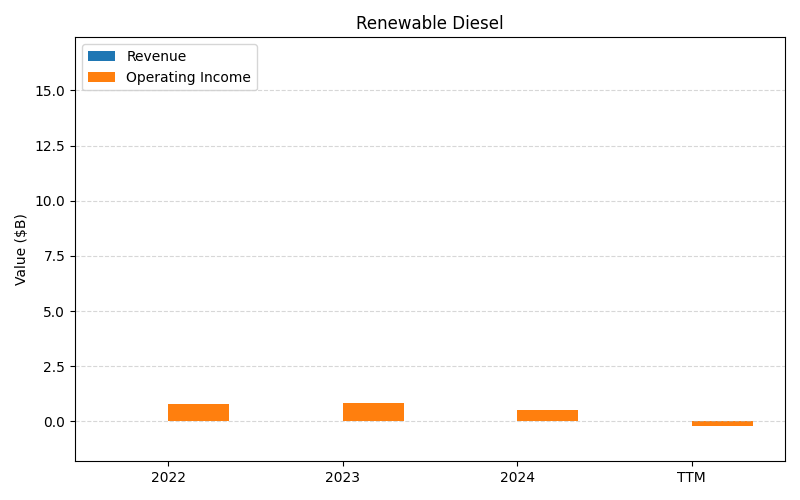
SEGMENTS v2025-09-09 · 2026-05-29 09:16 UTC — Units: $B. Rows list fiscal years (last 3 + TTM) with revenue and operating income for each segment; the final row shows the TTM revenue mix (operating income columns display “—” where mix is not applicable).
| Year | Ethanol Rev | Ethanol OI | Refining Rev | Refining OI | Renewable Diesel Rev | Renewable Diesel OI | Total Rev | Total OI |
|---|---|---|---|---|---|---|---|---|
| 2023 | – | 0.55B | – | 11.5B | – | 0.85B | – | 12.9B |
| 2024 | – | 0.29B | – | 3.97B | – | 0.51B | – | 4.77B |
| 2025 | – | 0.37B | – | 4.04B | – | -0.16B | – | 4.26B |
| TTM | 0.00B | 0.77B | 0.00B | 9.29B | 0.00B | 0.35B | 0.00B | 10.4B |
Balance Sheet
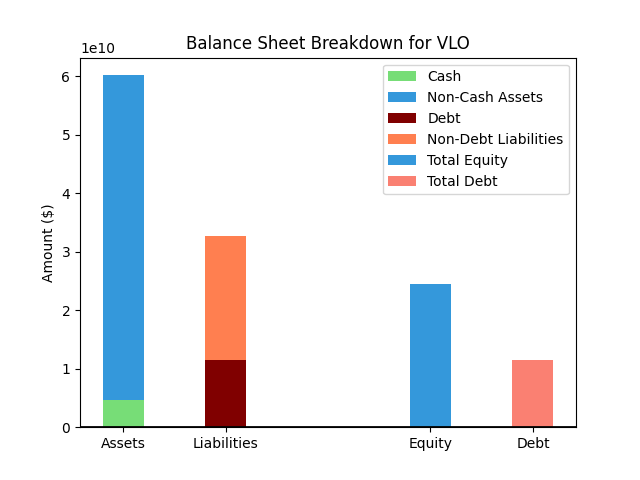
| Metric | Value | |
|---|---|---|
| 0 | Total Assets | $62,142M |
| 1 | Cash | $5,733M |
| 2 | Total Liabilities | $35,208M |
| 3 | Total Debt | $11,491M |
| 4 | Total Equity | $23,870M |
| 5 | Debt to Equity Ratio | 0.48 |
EPS & Dividend
Valuation
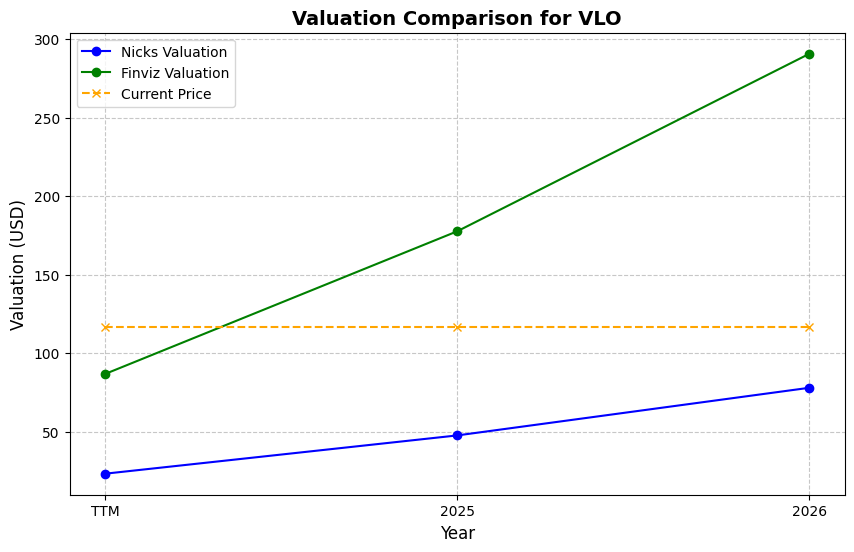
| Share Price | Treasury Yield | Estimates | Fair Value (P/E) | Fair Value (P/S) | Current P/S | Current P/E |
|---|---|---|---|---|---|---|
| $244.82 | 4.5% | Nicks Growth: 2% Nick's Expected Margin: 6% FINVIZ Growth: 19% |
Nicks: 8 Finviz: 40 |
Nick's: 0.468 | 0.6 | 17.9 |
| Basis | Year | Nicks Valuation | Nicks vs Share Price | Finviz Valuation | Finviz vs Share Price |
|---|---|---|---|---|---|
| $13.69 EPS | TTM | $106.79 | -56.4% | $547.46 | 123.6% |
| $29.27 EPS | 2026 | $228.30 | -6.7% | $1170.35 | 378.0% |
| $21.02 EPS | 2027 | $163.97 | -33.0% | $840.58 | 243.3% |
Implied Growth
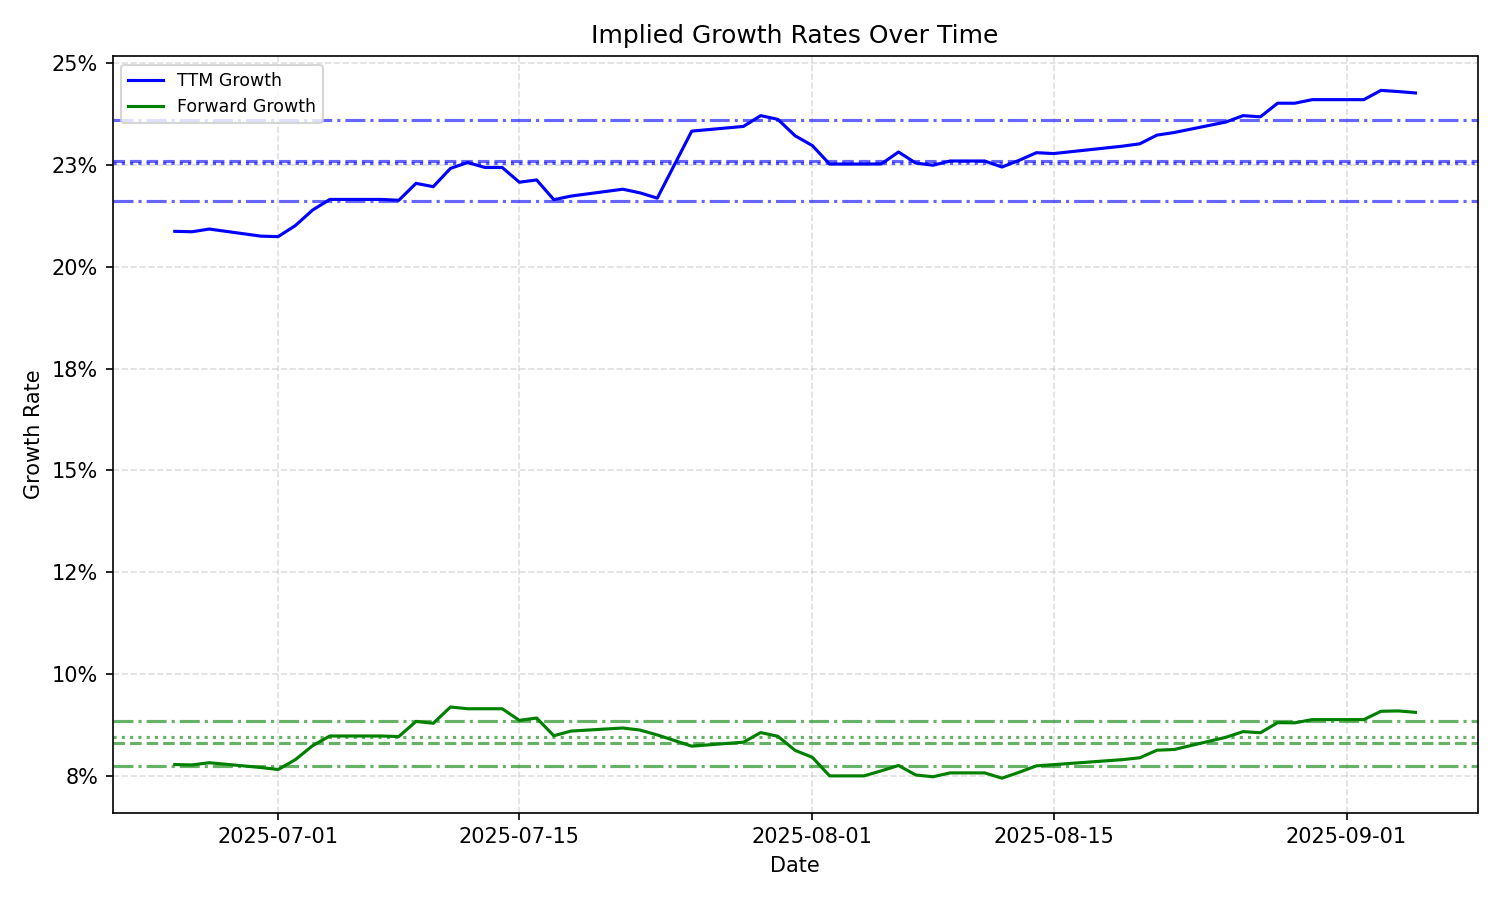
| Average | Median | Std Dev | Current | Percentile | ||||||
|---|---|---|---|---|---|---|---|---|---|---|
| TTM | Forward | TTM | Forward | TTM | Forward | TTM | Forward | TTM | Forward | |
| Timeframe | ||||||||||
| 1 Year | 18.95% | 8.67% | 18.18% | 8.66% | 4.26% | 1.08% | 10.44% | 6.51% | 3.3% | 1.2% |
| 3 Years | 18.95% | 8.67% | 18.18% | 8.66% | 4.26% | 1.08% | 10.44% | 6.51% | 3.3% | 1.2% |
| 5 Years | 18.95% | 8.67% | 18.18% | 8.66% | 4.26% | 1.08% | 10.44% | 6.51% | 3.3% | 1.2% |
| 10 Years | 18.95% | 8.67% | 18.18% | 8.66% | 4.26% | 1.08% | 10.44% | 6.51% | 3.3% | 1.2% |