United Parcel Service, Inc. — UPS
| Close Price | Market Cap | P/E Ratio | Forward P/E Ratio | Implied Growth* | Implied Forward Growth* | Dividend | P/B Ratio |
|---|---|---|---|---|---|---|---|
| $106.69 | $90.69B | 17.3 | 13.3 | 10.1% | 7.4% | $6.56 6.1% | 5.6 |
Latest Headlines
- · 3 Cash-Producing Stocks We’re Skeptical Of
- · UPS invests $50M in automotive, industrial logistics push
- · UPS Invests $50 Million to Transform Logistics for North American Automotive and Industrial Manufacturers, Launches Air Freight Expansion in Mexico
- · USPS, DHL partner in a $10 billion 'last-mile' delivery agreement
- · Why Is UPS (UPS) Down 2% Since Last Earnings Report?
- · 2 Reasons to Buy FedEx Stock Now, According to J.P. Morgan
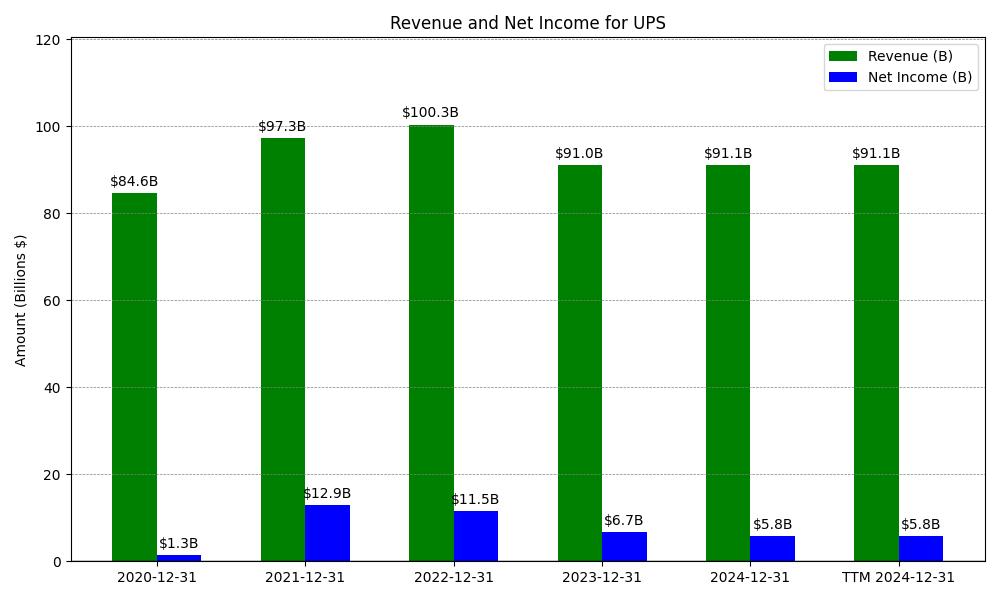
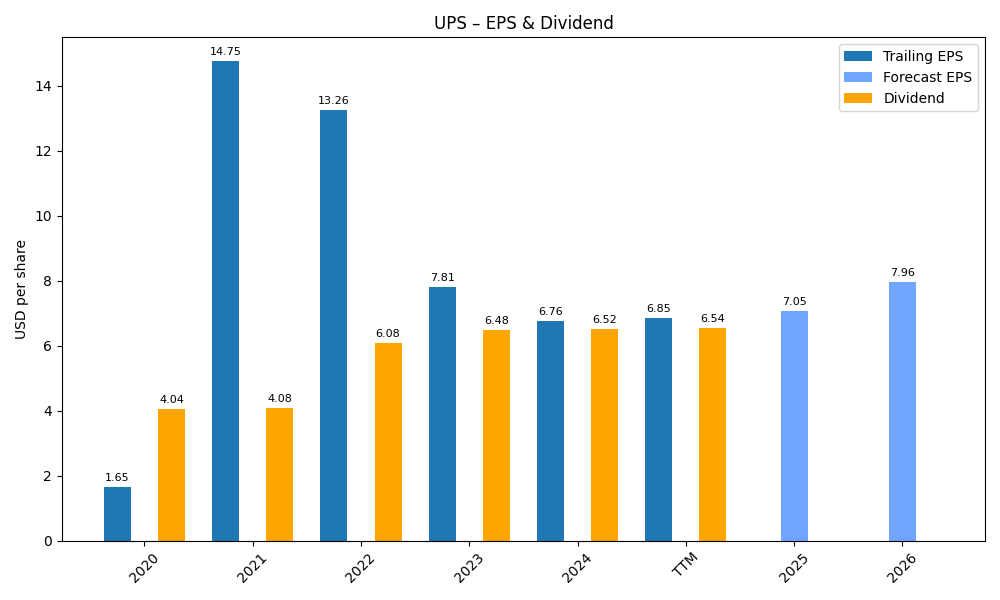
Revenue & Net Income
| Date | Revenue | Net_Income | EPS | Last_Updated | Revenue_Change | Net_Income_Change | EPS_Change | |
|---|---|---|---|---|---|---|---|---|
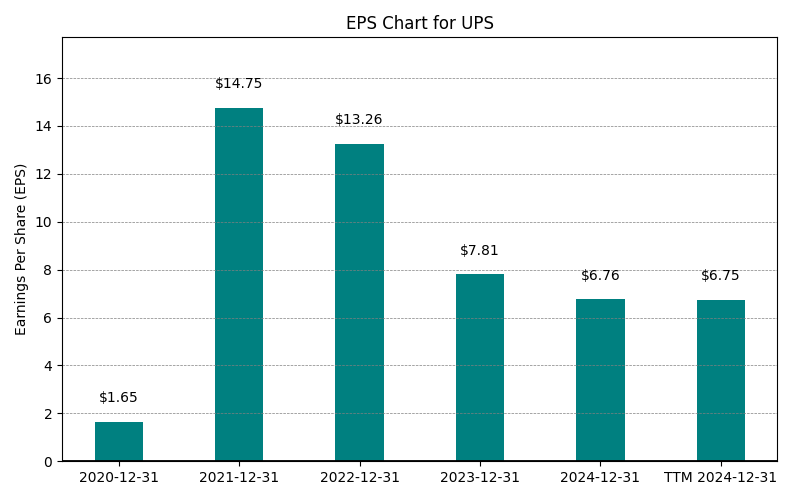
| 0 | 2020-12-31 | $84,628M | $1,343M | $1.65 | 2024-02-03 03:17:10 | N/A | N/A | N/A |
| 1 | 2021-12-31 | $97,287M | $12,890M | $13.26 | 2026-02-27 08:43:38 | 15.0% | 859.8% | 703.6% |
| 2 | 2022-12-31 | $100,338M | $11,548M | $13.26 | 2026-05-29 09:15:49 | 3.1% | -10.4% | 0.0% |
| 3 | 2023-12-31 | $90,958M | $6,708M | $7.81 | 2026-05-29 09:15:49 | -9.3% | -41.9% | -41.1% |
| 4 | 2024-12-31 | $91,070M | $5,782M | $6.76 | 2026-05-29 09:15:49 | 0.1% | -13.8% | -13.4% |
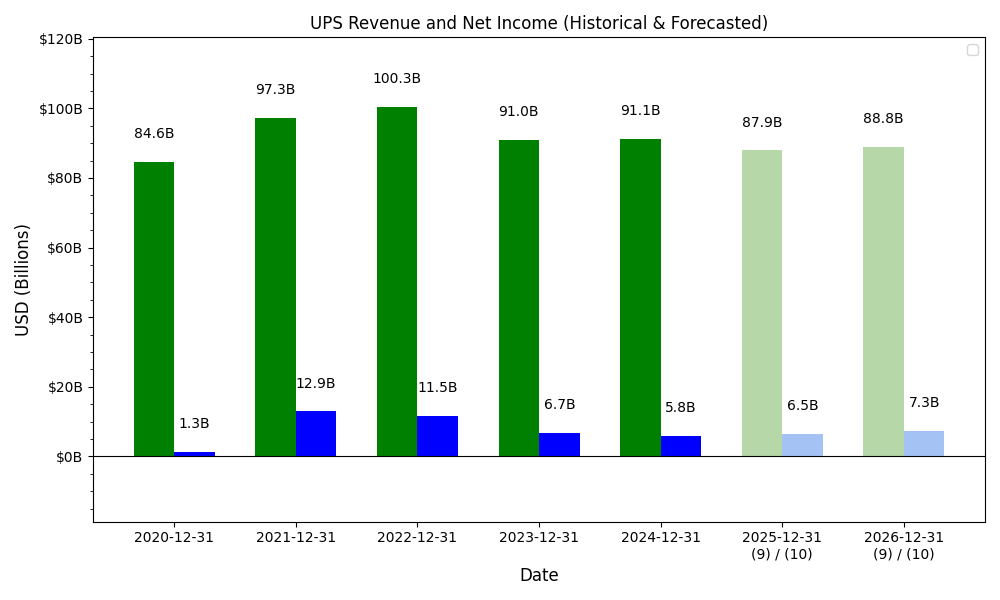
| 5 | 2025-12-31 | $88,661M | $5,572M | $6.56 | 2026-05-29 09:15:49 | -2.6% | -3.6% | -3.0% |
| 6 | TTM 2026-03-31 | $88,317M | $5,249M | $6.18 | 2026-04-30 08:56:39 | -0.4% | -5.8% | -5.8% |
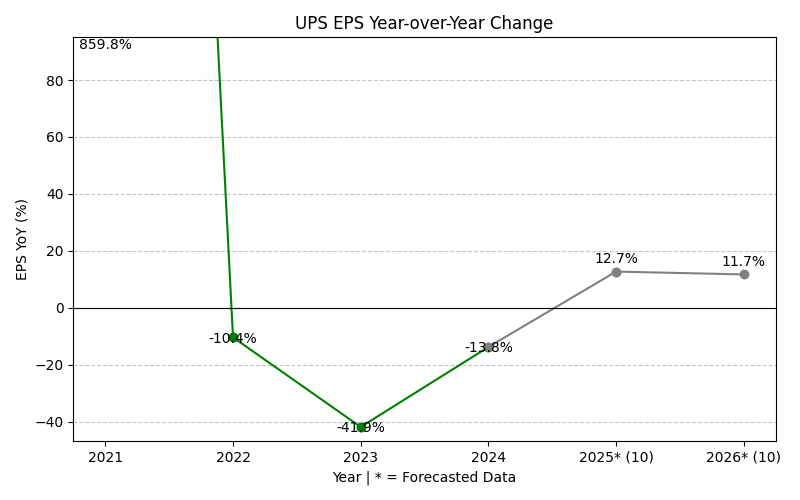
EPS
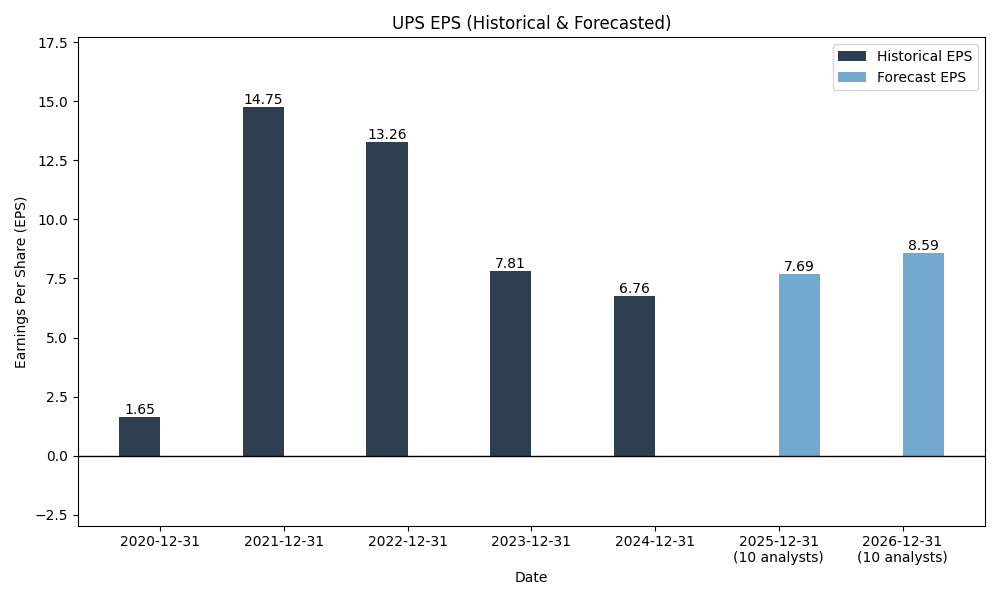
Forecasts
Y/Y % Change
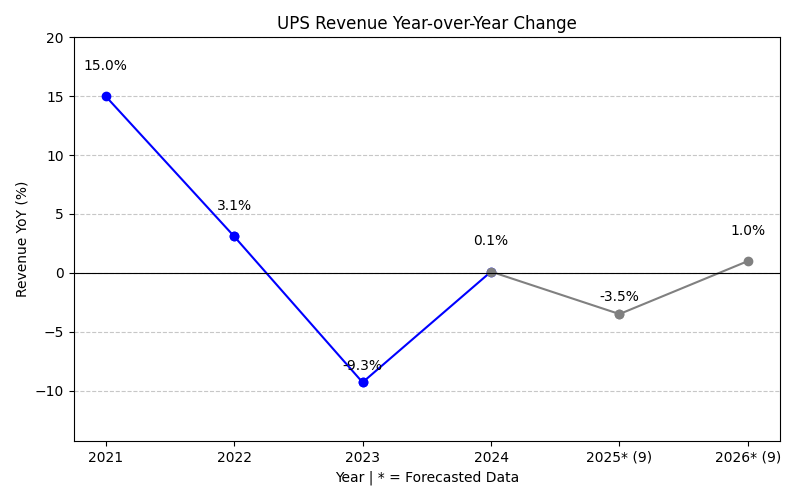
UPS Year-over-Year Growth
| 2020 | 2021 | 2022 | 2023 | 2024 | 2025 | 2026 | 2027 | Average | |
|---|---|---|---|---|---|---|---|---|---|
| Revenue Growth (%) | 15.0% | 3.1% | -9.3% | 0.1% | -2.6% | 1.5% | 4.0% | 1.7% | |
| Revenue Analysts (#) | 0 | 0 | 0 | 0 | 0 | 0 | 23 | 23 | |
| EPS Growth (%) | 859.8% | -10.4% | -41.9% | -13.8% | -3.6% | 8.8% | 12.2% | 115.9% | |
| EPS Analysts (#) | 0 | 0 | 0 | 0 | 0 | 0 | 27 | 26 |
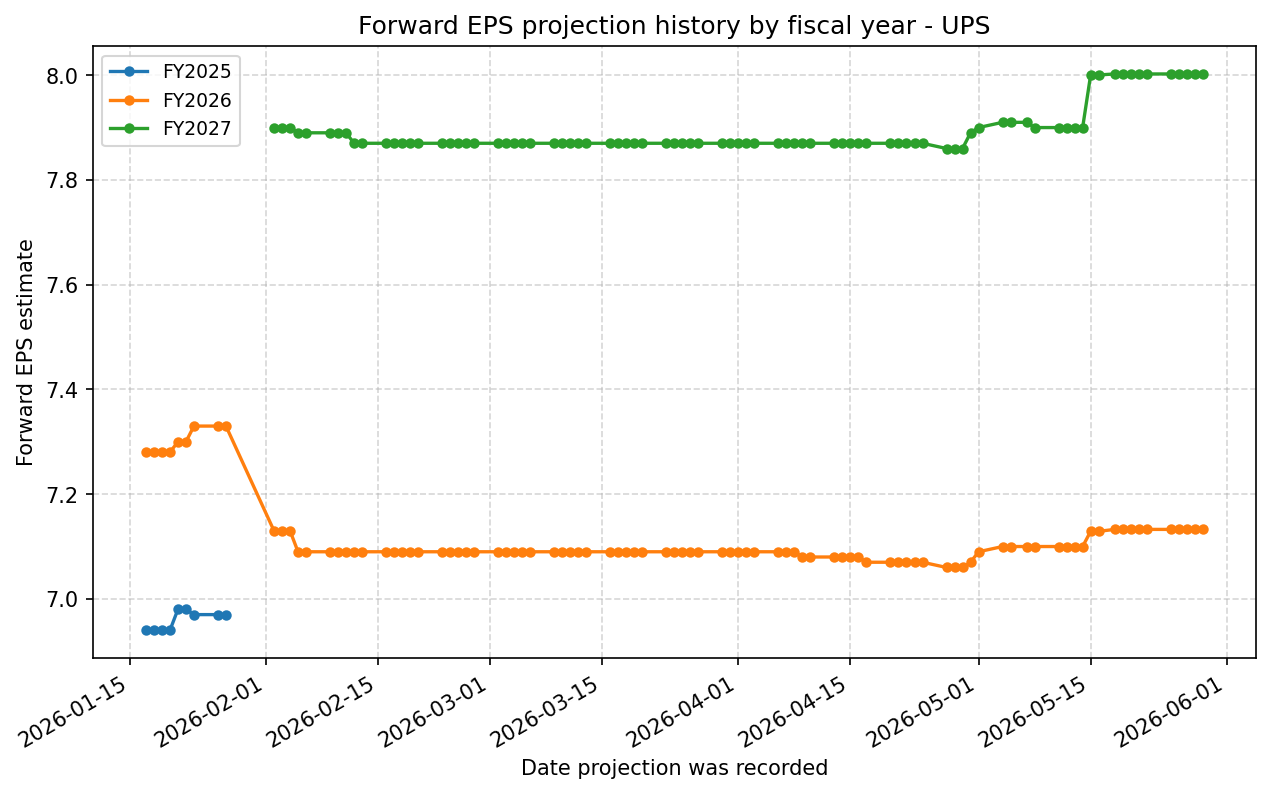
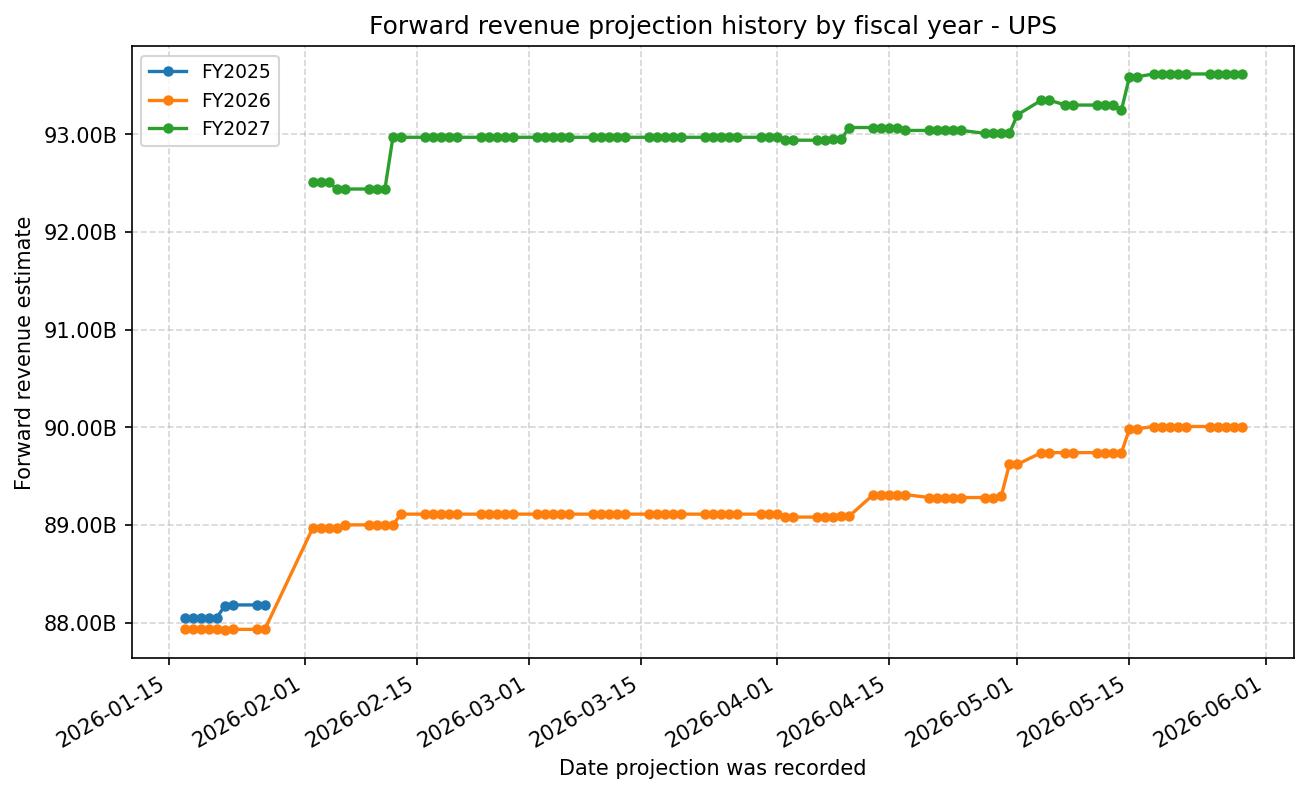
Forward Estimate History
How the next-FY EPS and revenue estimates have drifted over time. One line per fiscal year – past lines end when that FY became current.
Expenses
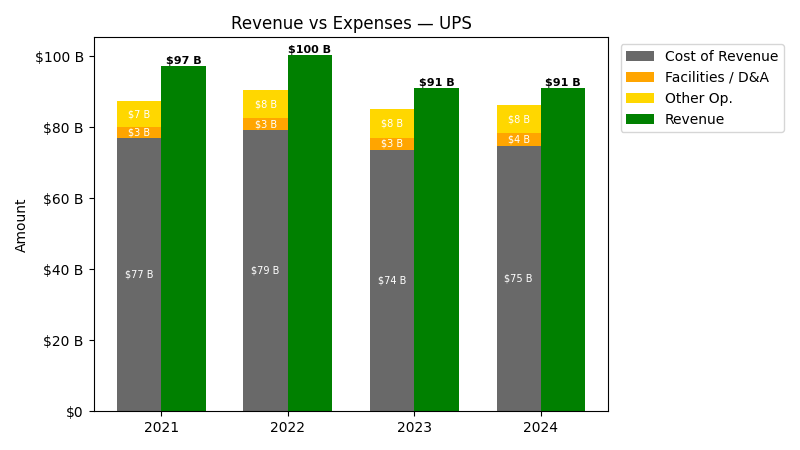
| Year | Revenue ($) | Cost of Revenue ($) | Facilities / D&A ($) |
|---|---|---|---|
| 2021 | $97.3B | $74.1B | $3.0B |
| 2022 | $100.3B | $76.1B | $3.2B |
| 2023 | $91.0B | $70.4B | $3.4B |
| 2024 | $91.1B | $71.1B | $3.6B |
| 2025 | $88.7B | $68.9B | $3.7B |
| TTM | $88.3B | $68.8B | $3.8B |
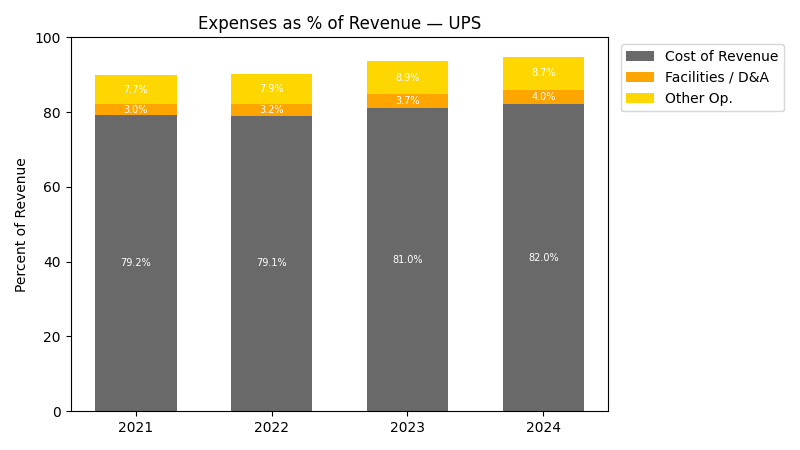
| Year | Revenue Change (%) | Cost of Revenue Change (%) | Facilities / D&A Change (%) |
|---|---|---|---|
| 2022 | 3.14 | 2.81 | 7.96 |
| 2023 | -9.35 | -7.59 | 5.58 |
| 2024 | 0.12 | 1.07 | 7.22 |
| 2025 | -2.65 | -3.12 | 3.80 |
| TTM | -0.39 | -0.14 | 1.95 |
No unmapped expenses.
Segment Performance
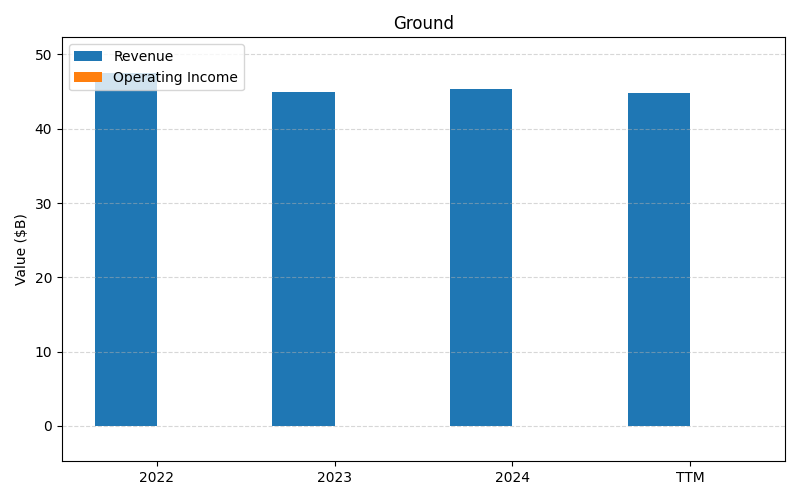
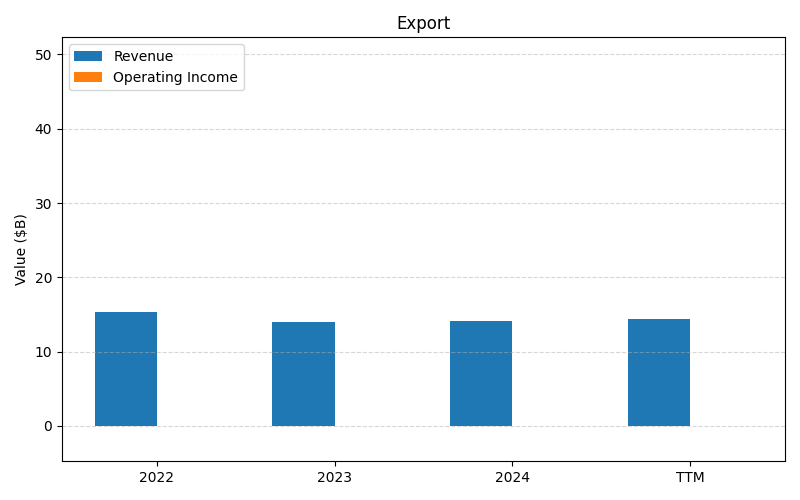
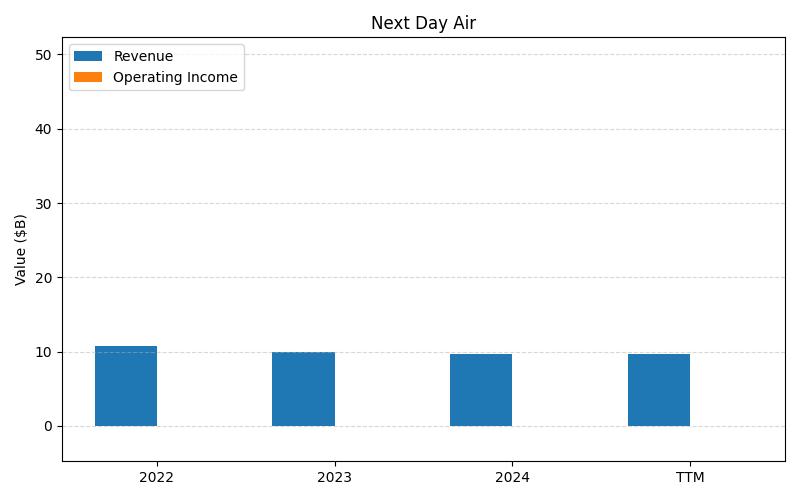
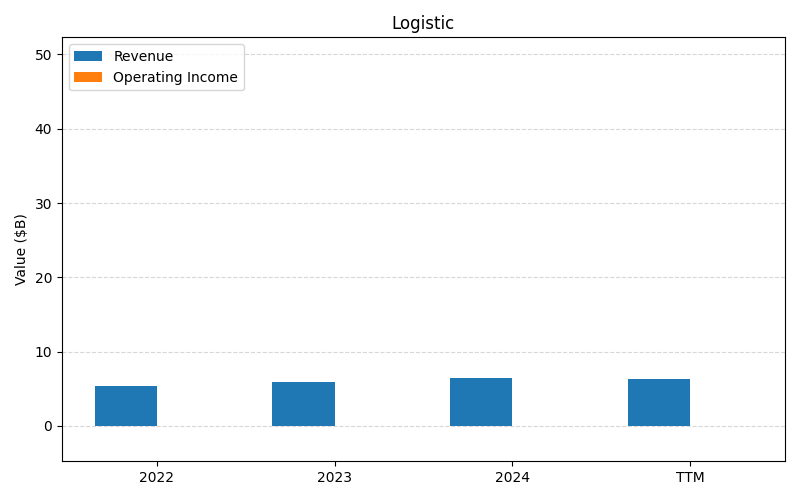
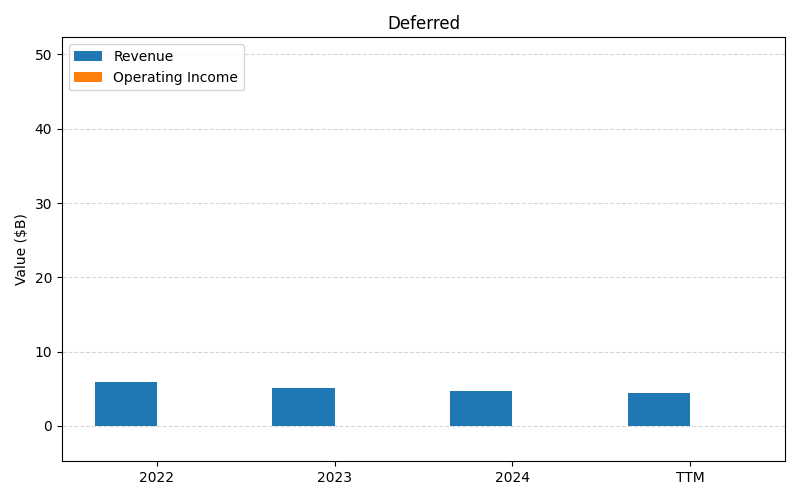
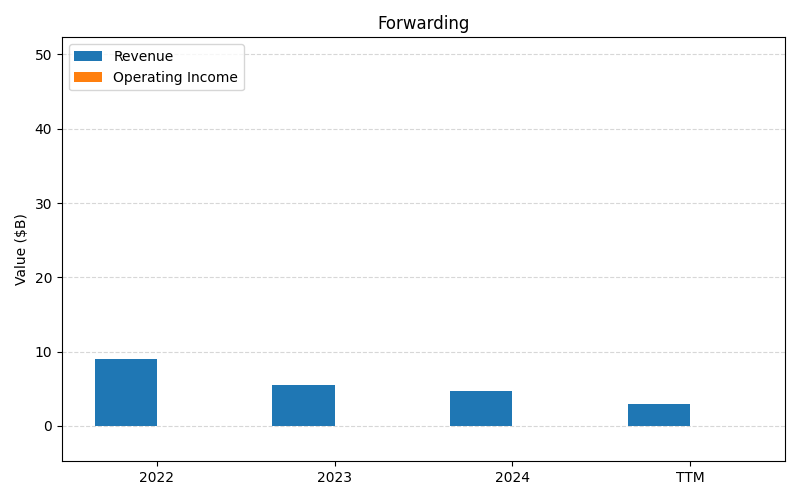
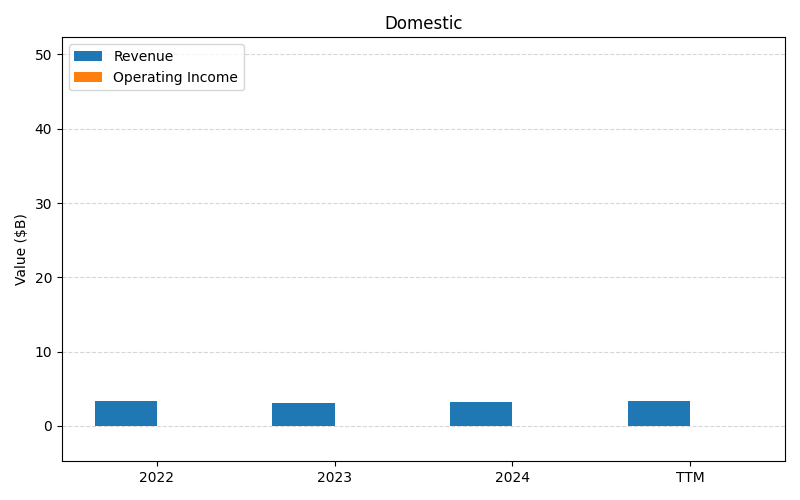
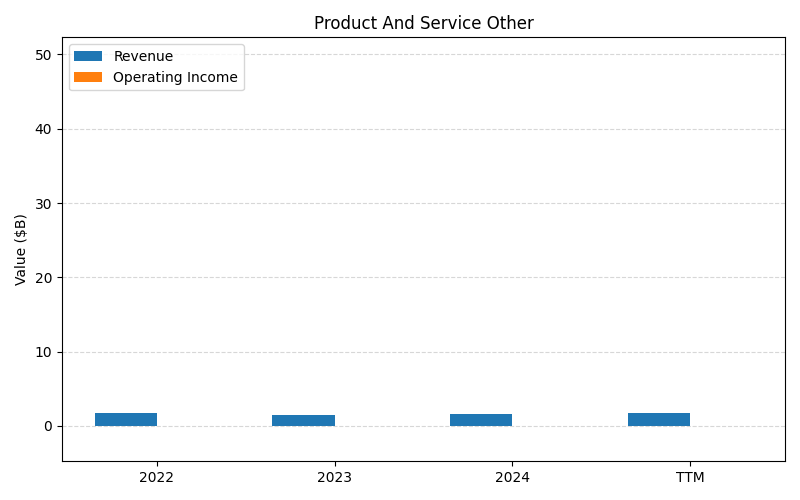
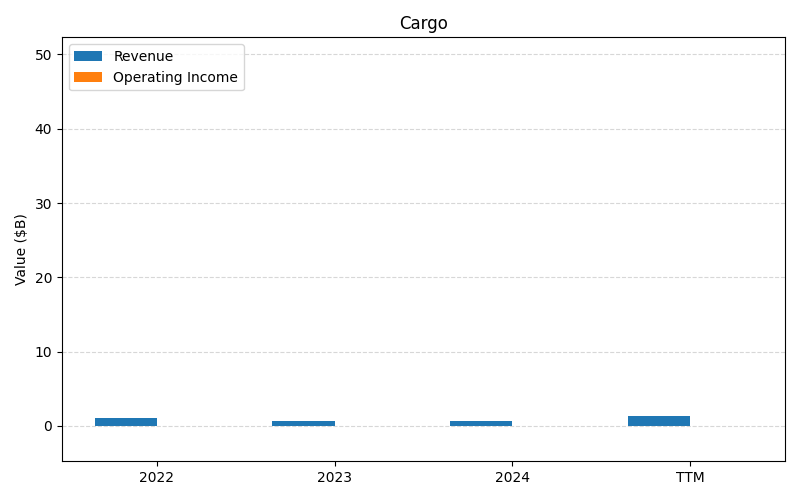
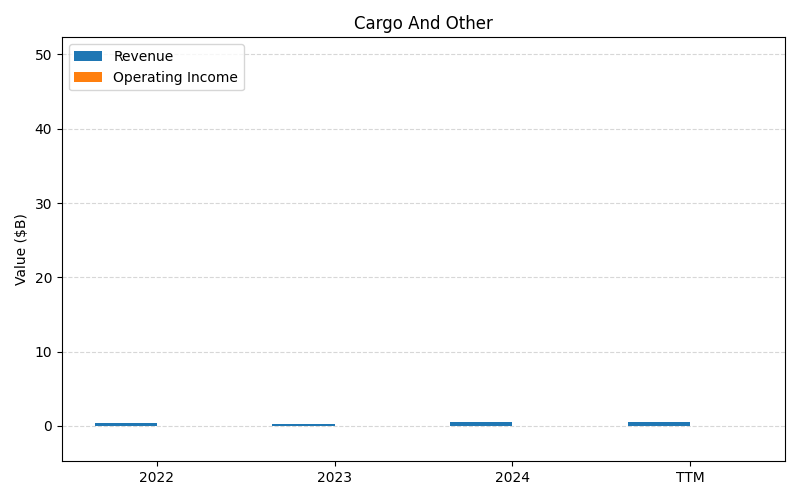
SEGMENTS v2025-09-09 · 2026-05-29 09:15 UTC — Units: $B. Rows list fiscal years (last 3 + TTM) with revenue for each segment; the final row shows the TTM revenue mix (operating income columns display “—” where mix is not applicable).
| Year | Ground Rev | Export Rev | Next Day Air Rev | Logistic Rev | Deferred Rev | Forwarding Rev | Domestic Rev | Product And Service Other Rev | Cargo Rev | Cargo And Other Rev | Total Rev |
|---|---|---|---|---|---|---|---|---|---|---|---|
| 2023 | 45B | 14B | 9.89B | 5.93B | 5.09B | 5.53B | 3.14B | 1.46B | 0.68B | 0.25B | 91B |
| 2024 | 45.3B | 14.1B | 9.70B | 6.44B | 4.76B | 4.73B | 3.19B | 1.57B | 0.63B | 0.57B | 91.1B |
| 2025 | 44.2B | 14.5B | 9.65B | 5.86B | 4.45B | 2.92B | 3.40B | 1.79B | 0.70B | 1.24B | 88.7B |
| TTM | 110.7B | 35.6B | 24.1B | 15.3B | 11.3B | 9.03B | 8.19B | 4.25B | 2.27B | – | 220.7B |
| % of Total (TTM) | 50.2% | 16.1% | 10.9% | 6.9% | 5.1% | 4.1% | 3.7% | 1.9% | 1.0% | – | 100% |
Segment Performance (Axis 2)
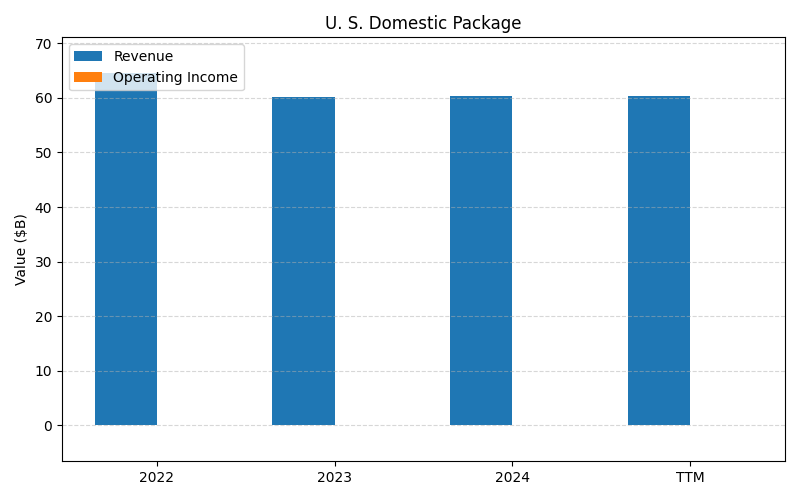
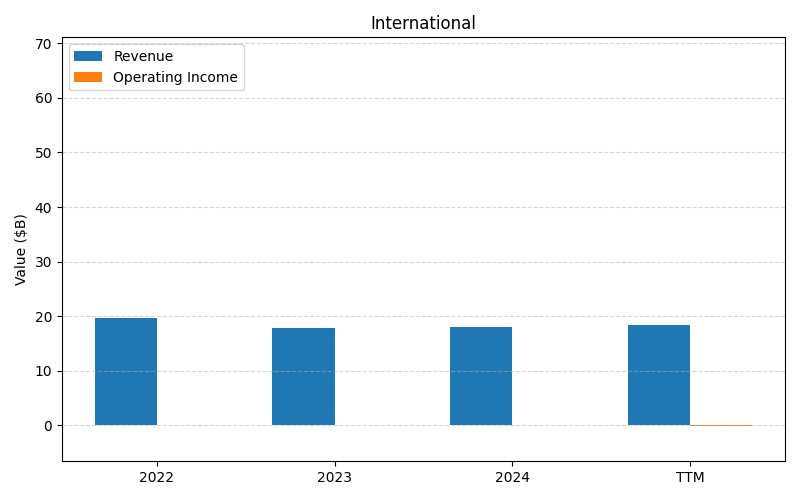
SEGMENTS v2025-09-09 · 2026-05-29 09:15 UTC — Units: $B. Rows list fiscal years (last 3 + TTM) with revenue and operating income for each segment; the final row shows the TTM revenue mix (operating income columns display “—” where mix is not applicable).
| Year | U. S. Domestic Package Rev | U. S. Domestic Package OI | International Rev | International OI | Total Rev | Total OI |
|---|---|---|---|---|---|---|
| 2023 | 120.4B | 5.16B | 35.7B | 3.23B | 156.1B | 8.39B |
| 2024 | 120.8B | 4.34B | 35.9B | 3.19B | 156.7B | 7.54B |
| 2025 | 119B | 3.93B | 37.2B | 2.87B | 156.2B | 6.80B |
| TTM | 268.4B | 9.77B | 82B | 7.25B | 350.4B | 17B |
| % of Total (TTM) | 76.6% | — | 23.4% | — | 100% | — |
Balance Sheet
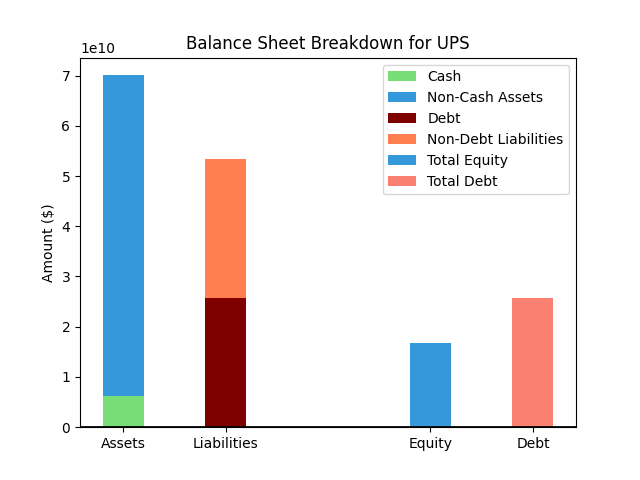
| Metric | Value | |
|---|---|---|
| 0 | Total Assets | $71,809M |
| 1 | Cash | $5,802M |
| 2 | Total Liabilities | $56,018M |
| 3 | Total Debt | $28,662M |
| 4 | Total Equity | $15,763M |
| 5 | Debt to Equity Ratio | 1.82 |
EPS & Dividend
Valuation
| Share Price | Treasury Yield | Estimates | Fair Value (P/E) | Fair Value (P/S) | Current P/S | Current P/E |
|---|---|---|---|---|---|---|
| $106.69 | 4.5% | Nicks Growth: 5% Nick's Expected Margin: 8% FINVIZ Growth: 6% |
Nicks: 11 Finviz: 12 |
Nick's: 0.845 | 1.0 | 17.3 |
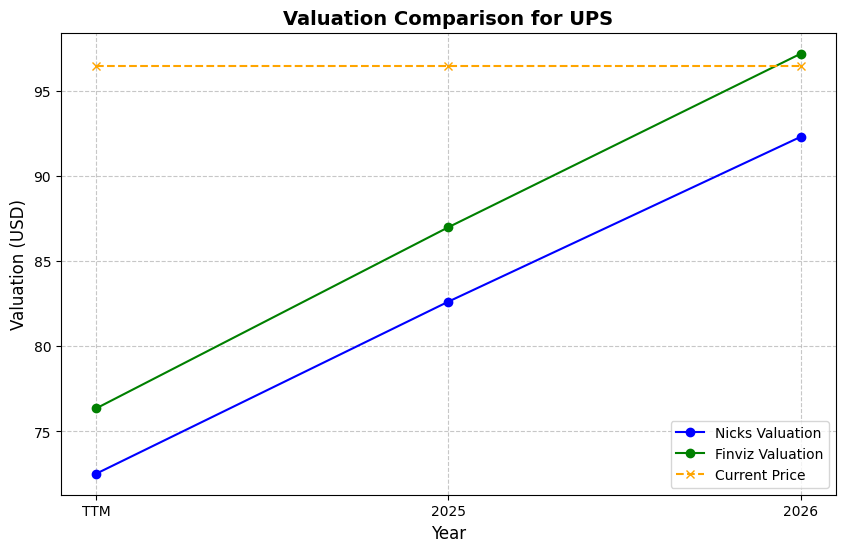
| Basis | Year | Nicks Valuation | Nicks vs Share Price | Finviz Valuation | Finviz vs Share Price |
|---|---|---|---|---|---|
| $6.18 EPS | TTM | $65.26 | -38.8% | $73.34 | -31.3% |
| $7.13 EPS | 2026 | $75.33 | -29.4% | $84.65 | -20.7% |
| $8.00 EPS | 2027 | $84.51 | -20.8% | $94.97 | -11.0% |
Implied Growth
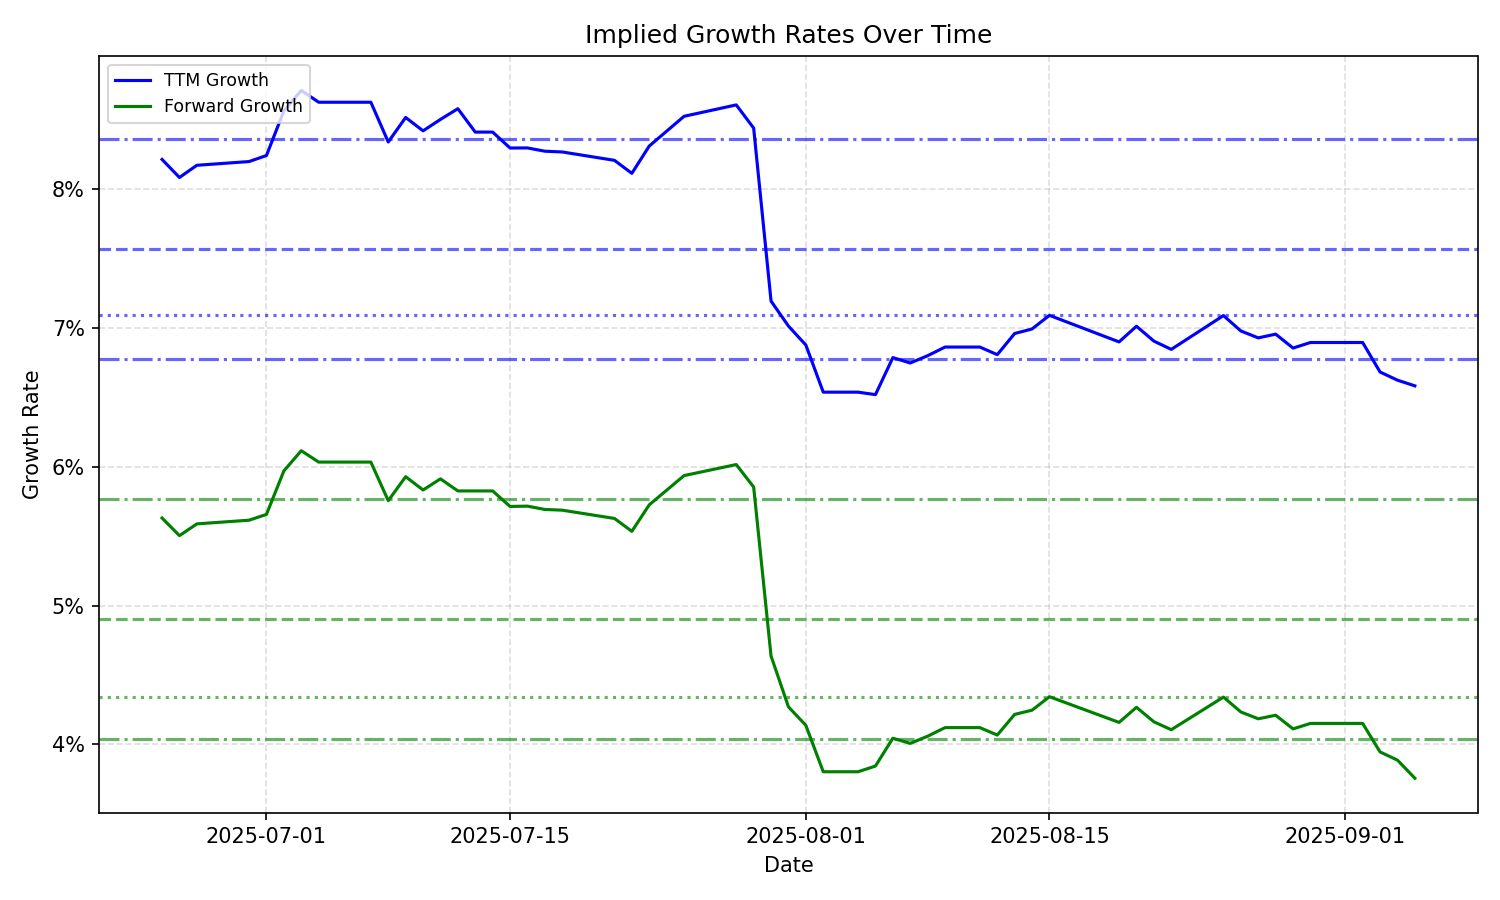
| Average | Median | Std Dev | Current | Percentile | ||||||
|---|---|---|---|---|---|---|---|---|---|---|
| TTM | Forward | TTM | Forward | TTM | Forward | TTM | Forward | TTM | Forward | |
| Timeframe | ||||||||||
| 1 Year | 8.18% | 5.80% | 8.30% | 5.84% | 1.19% | 1.60% | 10.07% | 7.37% | 95.9% | 76.9% |
| 3 Years | 8.18% | 5.80% | 8.30% | 5.84% | 1.19% | 1.60% | 10.07% | 7.37% | 95.9% | 76.9% |
| 5 Years | 8.18% | 5.80% | 8.30% | 5.84% | 1.19% | 1.60% | 10.07% | 7.37% | 95.9% | 76.9% |
| 10 Years | 8.18% | 5.80% | 8.30% | 5.84% | 1.19% | 1.60% | 10.07% | 7.37% | 95.9% | 76.9% |