UnitedHealth Group Incorporated — UNH
| Close Price | Market Cap | P/E Ratio | Forward P/E Ratio | Implied Growth* | Implied Forward Growth* | Dividend | P/B Ratio |
|---|---|---|---|---|---|---|---|
| $380.31 | $345.38B | 28.7 | 18.2 | 15.6% | 10.6% | $8.84 2.3% | 3.5 |
Latest Headlines
- · Massachusetts sues UnitedHealth unit over alleged Medicaid fraud
- · 3 Dow Jones Stocks to Consider Right Now
- · Humana (HUM) Up 30.6% Since Last Earnings Report: Can It Continue?
- · UnitedHealth Cuts Pediatric Prior Authorizations
- · Here’s Why UnitedHealth (UNH) Slid in Q1
- · UnitedHealthcare Eliminates Nearly Two-Thirds of Prior Authorization Requirements for Pediatric Care
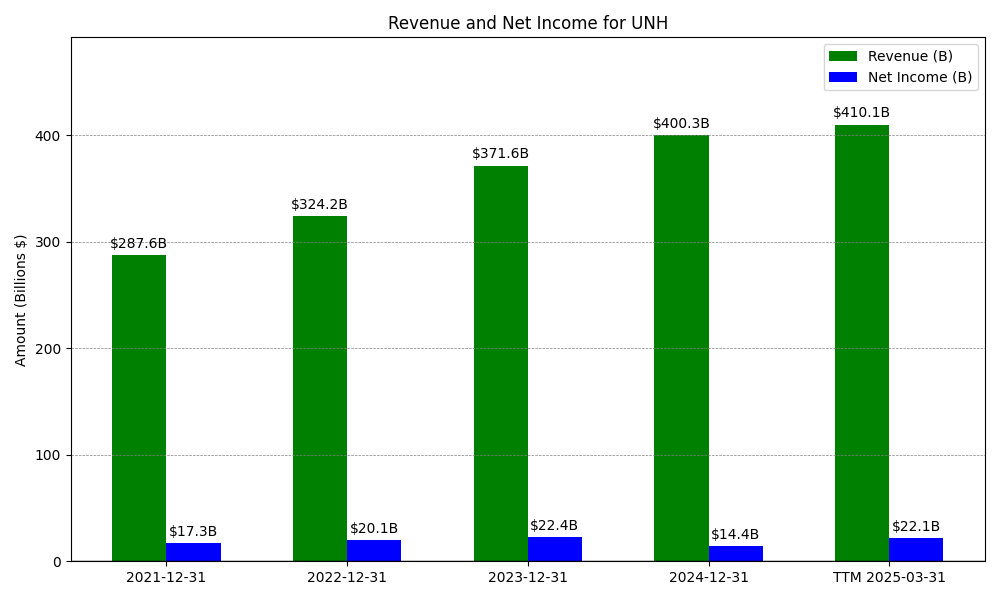
Revenue & Net Income
| Date | Revenue | Net_Income | EPS | Last_Updated | Revenue_Change | Net_Income_Change | EPS_Change | |
|---|---|---|---|---|---|---|---|---|
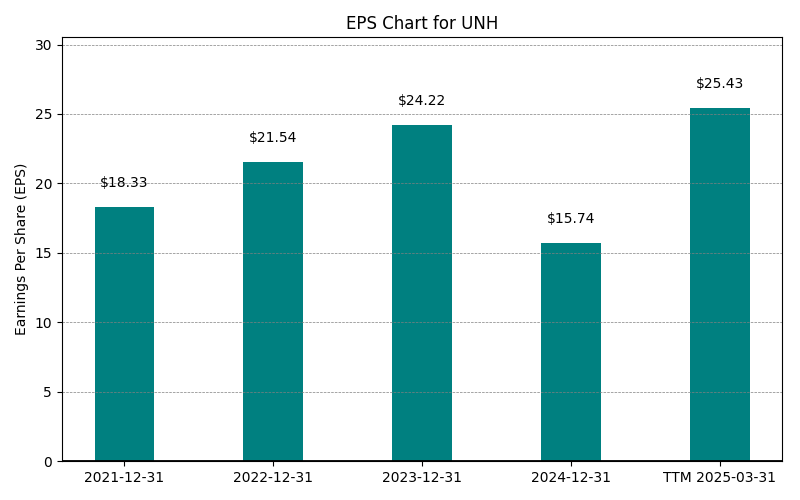
| 0 | 2021-12-31 | $287,597M | $17,285M | $21.54 | 2026-03-06 08:38:43 | N/A | N/A | N/A |
| 1 | 2022-12-31 | $324,162M | $20,120M | $21.54 | 2026-05-29 09:15:42 | 12.7% | 16.4% | 0.0% |
| 2 | 2023-12-31 | $371,622M | $22,381M | $24.22 | 2026-05-29 09:15:42 | 14.6% | 11.2% | 12.4% |
| 3 | 2024-12-31 | $400,278M | $14,405M | $15.74 | 2026-05-29 09:15:42 | 7.7% | -35.6% | -35.0% |
| 4 | 2025-12-31 | $447,567M | $12,056M | $13.28 | 2026-05-29 09:15:42 | 11.8% | -16.3% | -15.6% |
| 5 | TTM 2026-03-31 | $449,713M | $12,044M | $13.27 | 2026-05-08 08:40:45 | 0.5% | -0.1% | -0.1% |
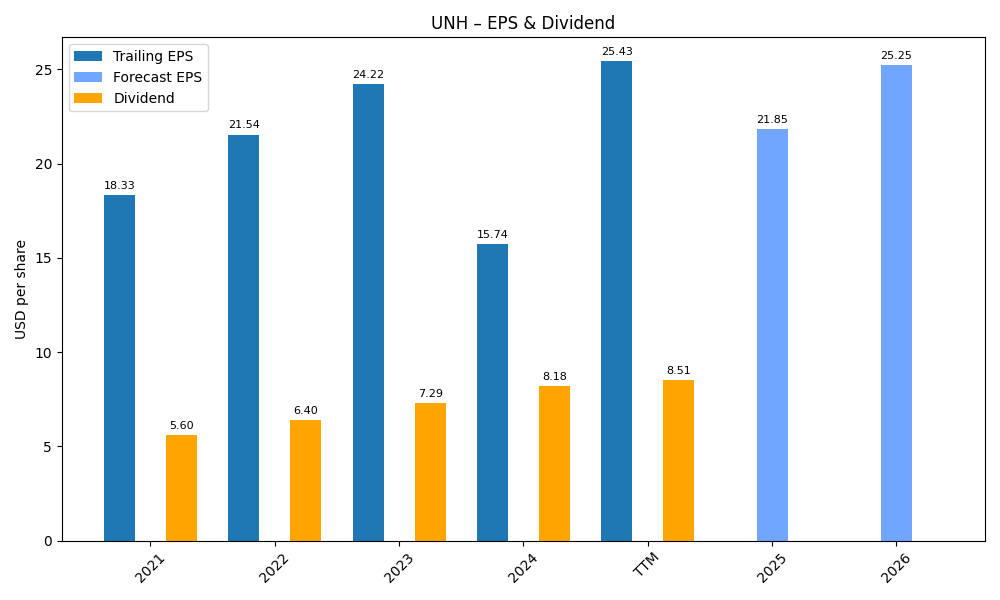
EPS
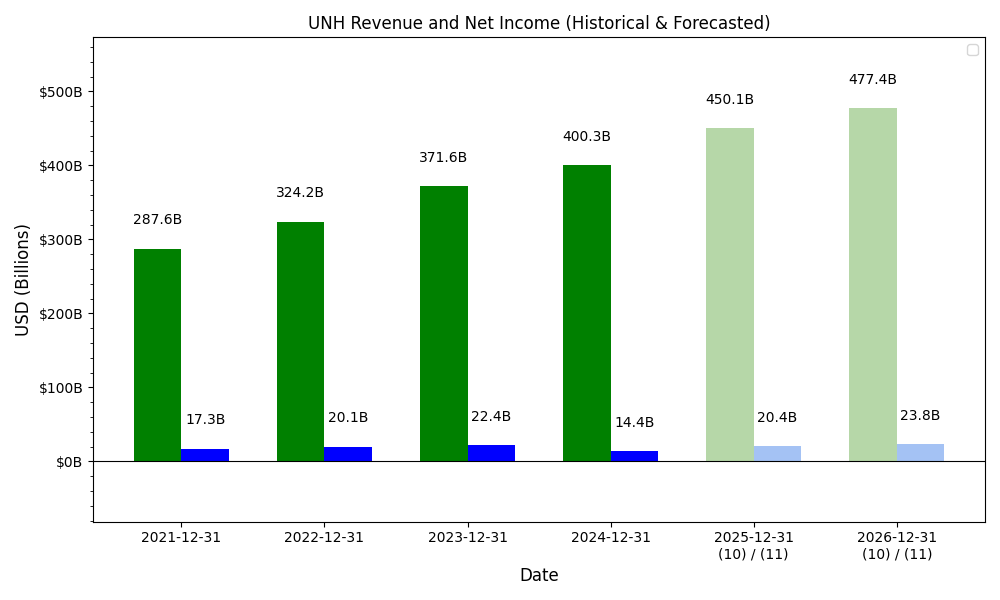
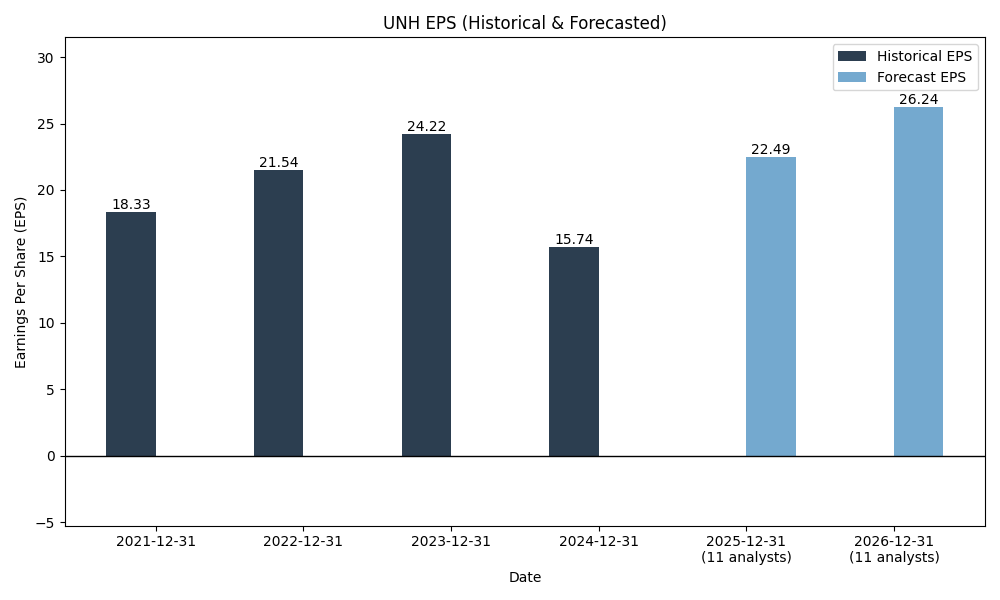
Forecasts
Y/Y % Change
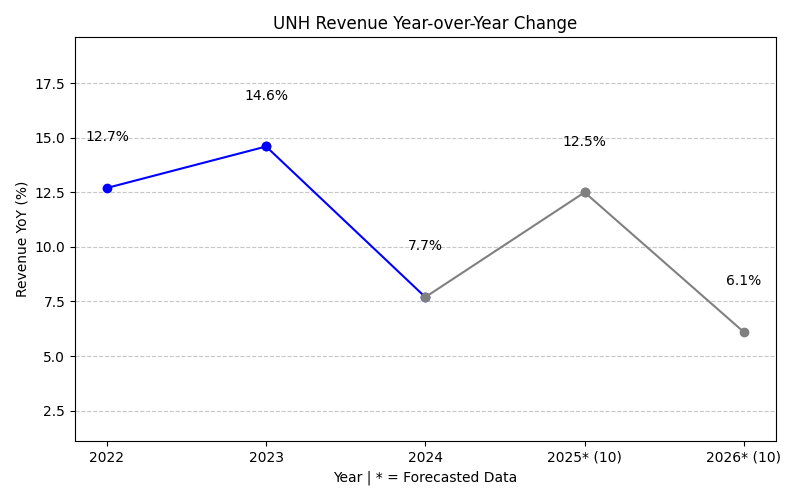
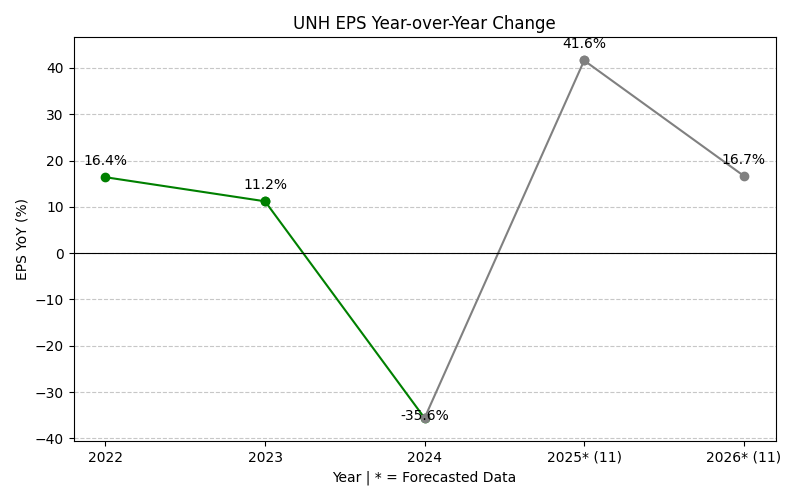
UNH Year-over-Year Growth
| 2021 | 2022 | 2023 | 2024 | 2025 | 2026 | 2027 | Average | |
|---|---|---|---|---|---|---|---|---|
| Revenue Growth (%) | 12.7% | 14.6% | 7.7% | 11.8% | -0.7% | 2.7% | 8.1% | |
| Revenue Analysts (#) | 0 | 0 | 0 | 0 | 0 | 23 | 23 | |
| EPS Growth (%) | 16.4% | 11.2% | -35.6% | -16.3% | 38.4% | 13.6% | 4.6% | |
| EPS Analysts (#) | 0 | 0 | 0 | 0 | 0 | 26 | 27 |
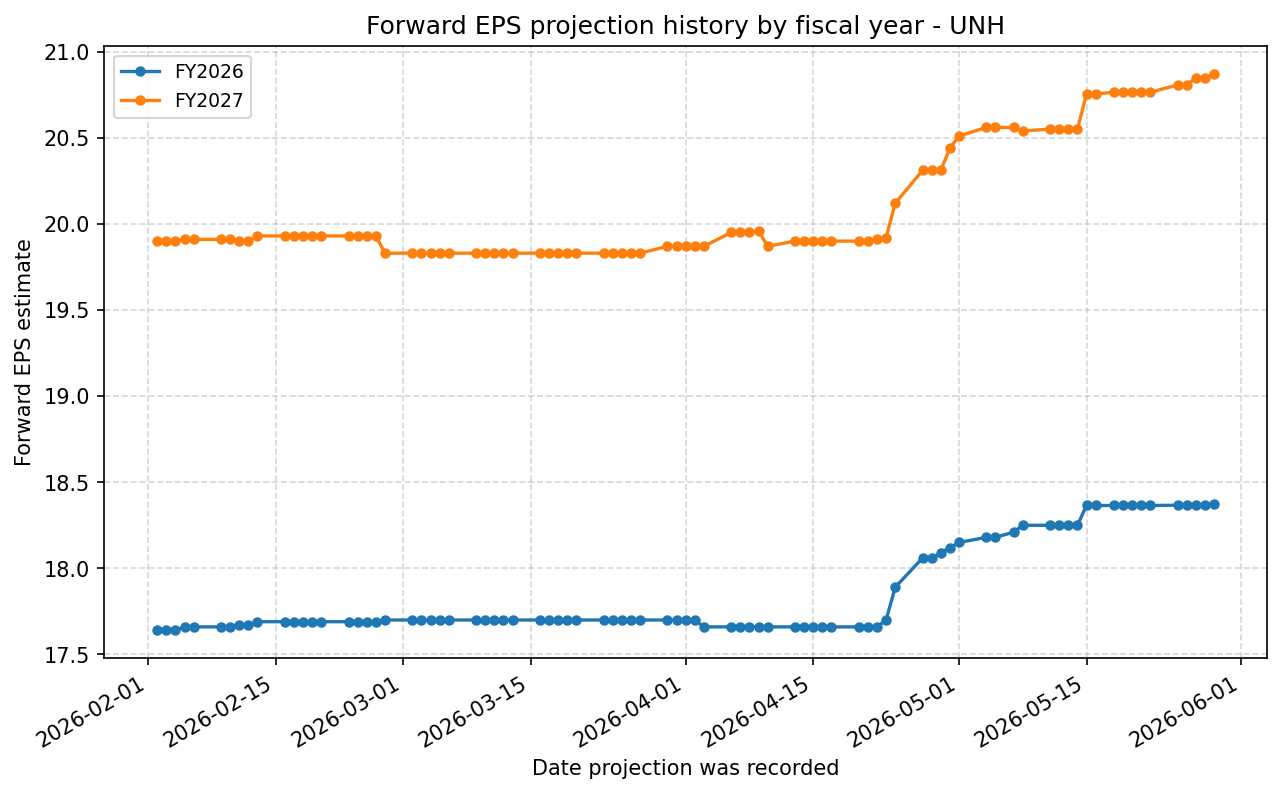
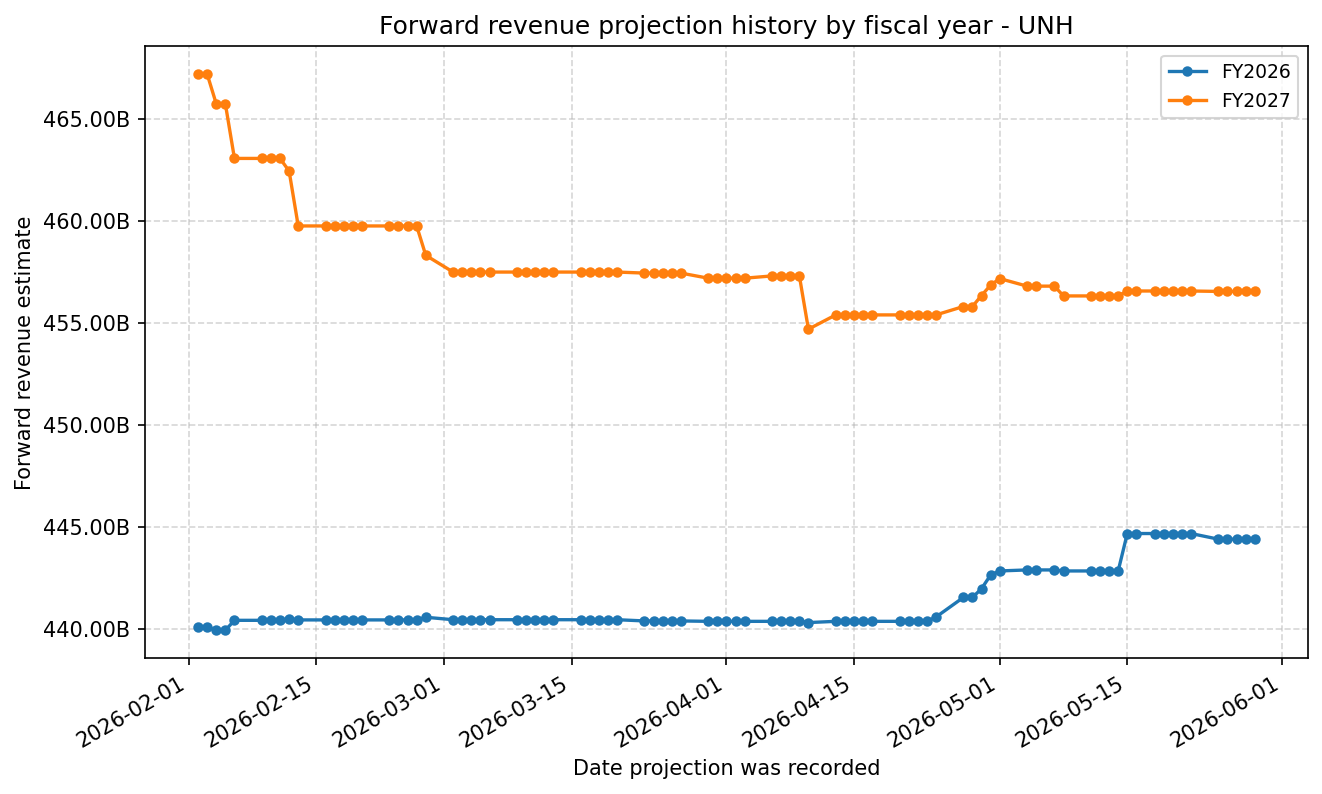
Forward Estimate History
How the next-FY EPS and revenue estimates have drifted over time. One line per fiscal year – past lines end when that FY became current.
Expenses
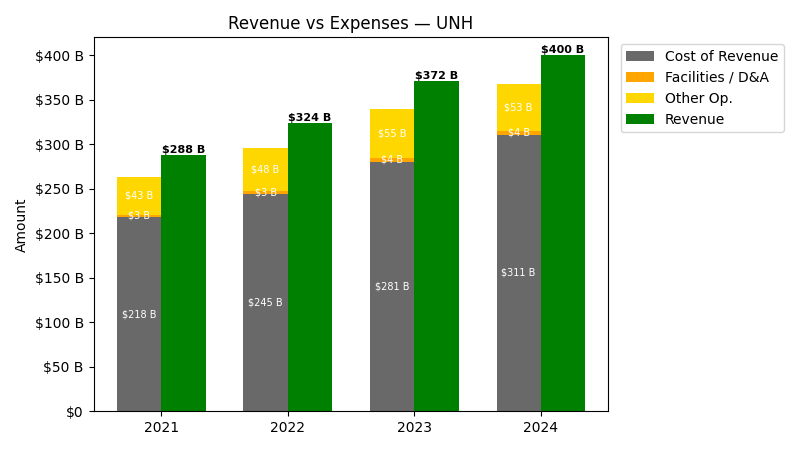
| Year | Revenue ($) | Cost of Revenue ($) | Facilities / D&A ($) |
|---|---|---|---|
| 2022 | $324.2B | $241.1B | $3.4B |
| 2023 | $371.6B | $276.7B | $4.0B |
| 2024 | $400.3B | $306.8B | $4.1B |
| 2025 | $447.6B | $360.3B | $4.4B |
| TTM | $449.7B | $360.8B | $4.3B |
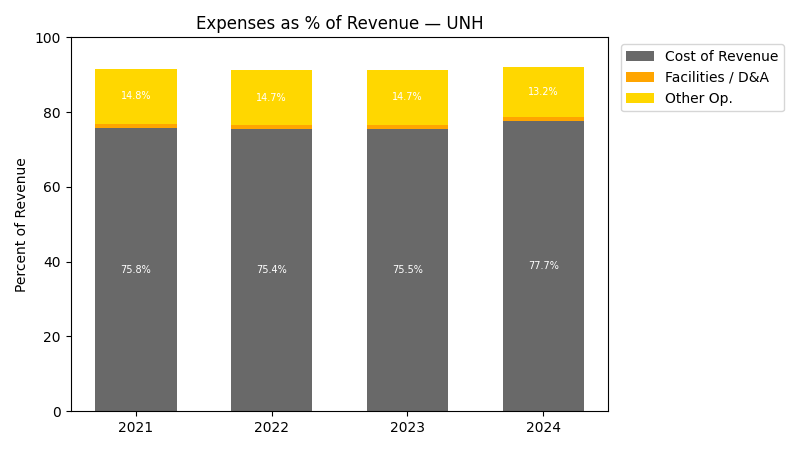
| Year | Revenue Change (%) | Cost of Revenue Change (%) | Facilities / D&A Change (%) |
|---|---|---|---|
| 2023 | 14.64 | 14.74 | 16.82 |
| 2024 | 7.71 | 10.87 | 3.20 |
| 2025 | 11.81 | 17.44 | 6.39 |
| TTM | 0.48 | 0.15 | -0.73 |
No unmapped expenses.
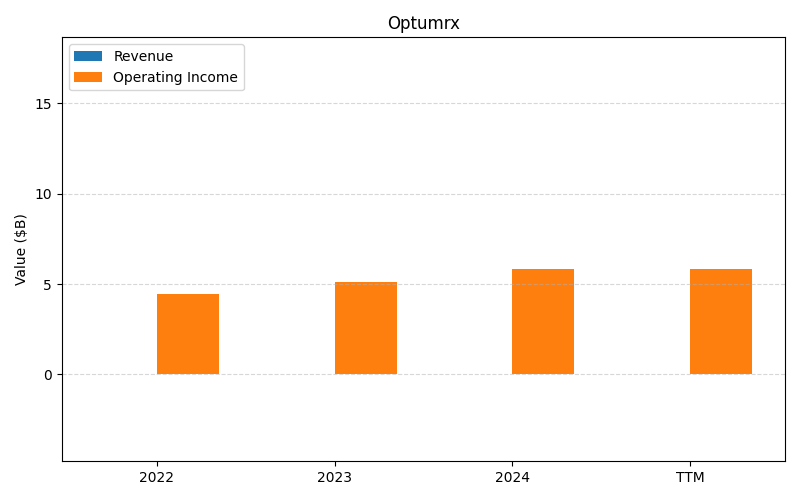
Segment Performance
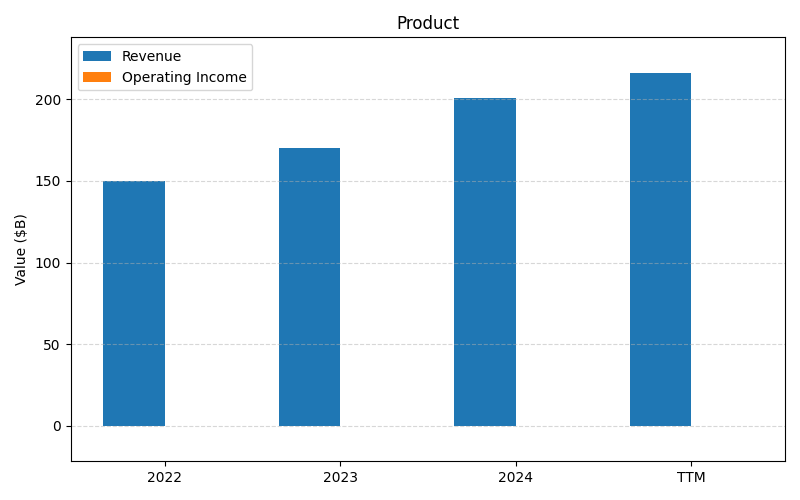
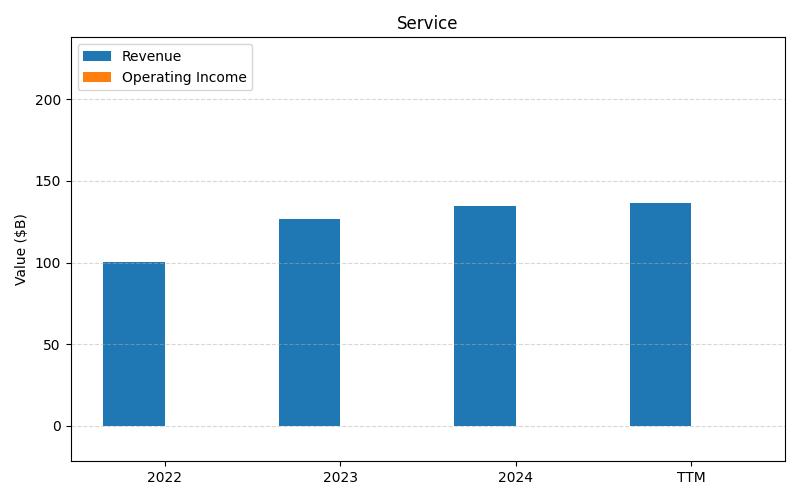
SEGMENTS v2025-09-09 · 2026-05-29 09:15 UTC — Units: $B. Rows list fiscal years (last 3 + TTM) with revenue for each segment; the final row shows the TTM revenue mix (operating income columns display “—” where mix is not applicable).
| Year | Prod Rev | Services Rev | Total Rev |
|---|---|---|---|
| 2023 | 170.3B | 126.4B | 296.8B |
| 2024 | 200.9B | 134.4B | 335.3B |
| 2025 | 213.5B | 141.8B | 355.3B |
| TTM | 519.6B | 345.8B | 865.4B |
| % of Total (TTM) | 60.0% | 40.0% | 100% |
Segment Performance (Axis 2)
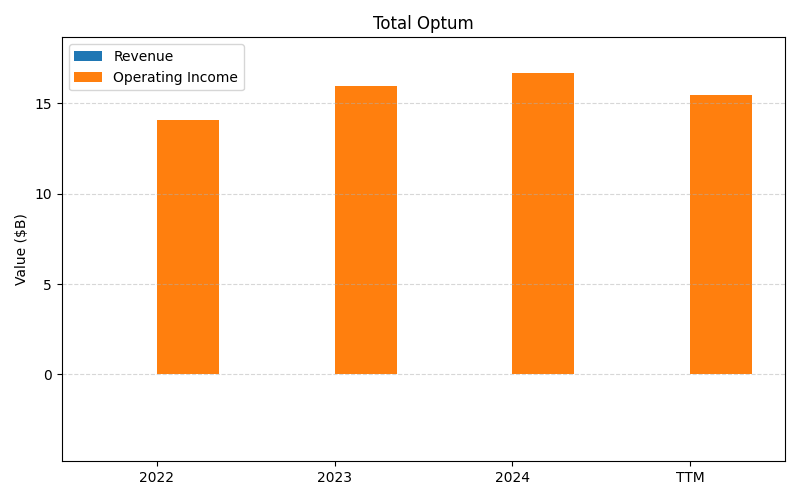
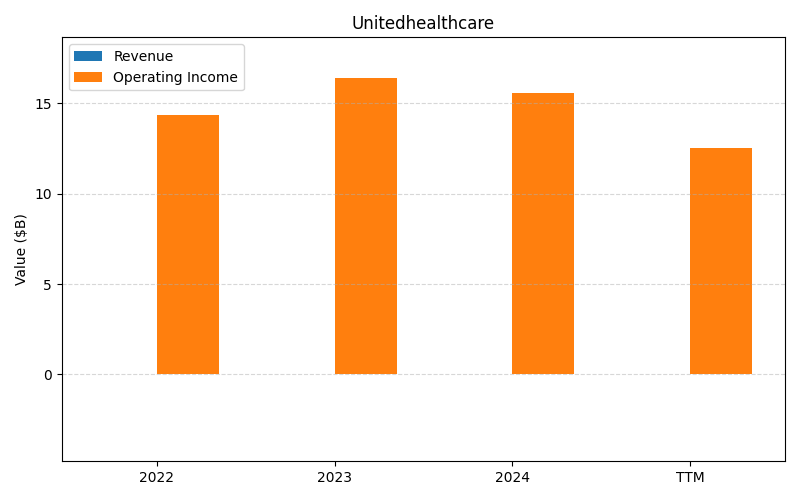
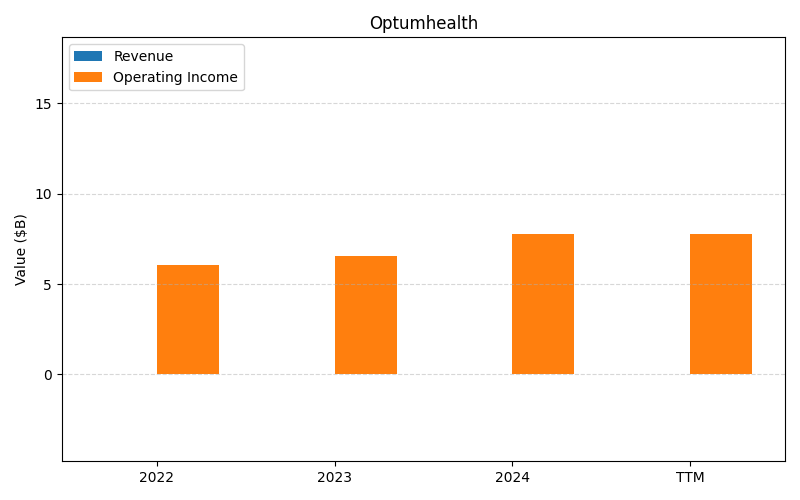
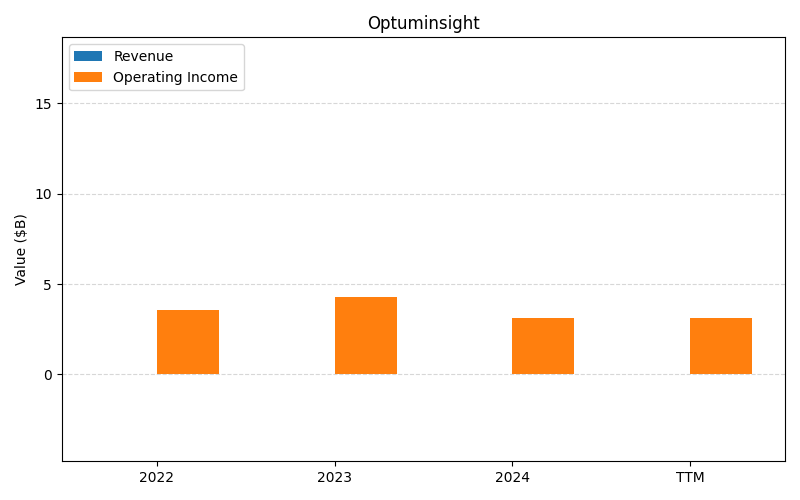
SEGMENTS v2025-09-09 · 2026-05-29 09:15 UTC — Units: $B. Rows list fiscal years (last 3 + TTM) with revenue and operating income for each segment; the final row shows the TTM revenue mix (operating income columns display “—” where mix is not applicable).
| Year | Total Optum Rev | Total Optum OI | Unitedhealthcare Rev | Unitedhealthcare OI | Optumhealth Rev | Optumhealth OI | Optuminsight Rev | Optuminsight OI | Optumrx Rev | Optumrx OI | Total Rev | Total OI |
|---|---|---|---|---|---|---|---|---|---|---|---|---|
| 2023 | – | 15.9B | – | 16.4B | – | 6.56B | – | 4.27B | – | 5.12B | – | 48.3B |
| 2024 | – | 16.7B | – | 15.6B | – | 7.77B | – | 3.10B | – | 5.84B | – | 49B |
| 2025 | – | 9.54B | – | 9.43B | – | -0.28B | – | 2.62B | – | 7.19B | – | 28.5B |
| TTM | 0.00B | 33.4B | 0.00B | 35.9B | – | – | – | – | – | – | 0.00B | 69.4B |
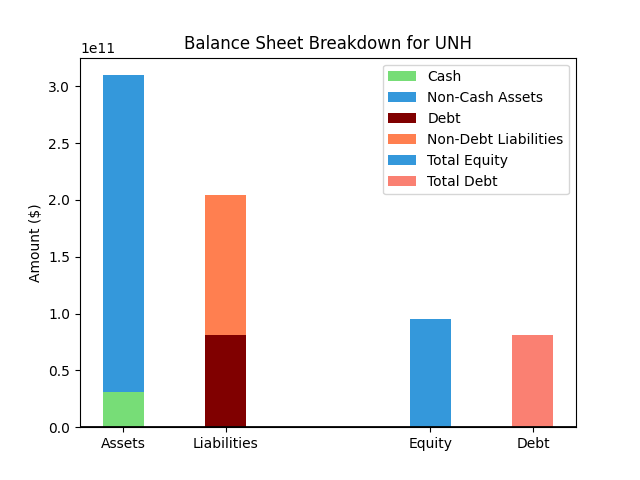
Balance Sheet
| Metric | Value | |
|---|---|---|
| 0 | Total Assets | $312,644M |
| 1 | Cash | $28,001M |
| 2 | Total Liabilities | $207,325M |
| 3 | Total Debt | $77,917M |
| 4 | Total Equity | $97,881M |
| 5 | Debt to Equity Ratio | 0.80 |
EPS & Dividend
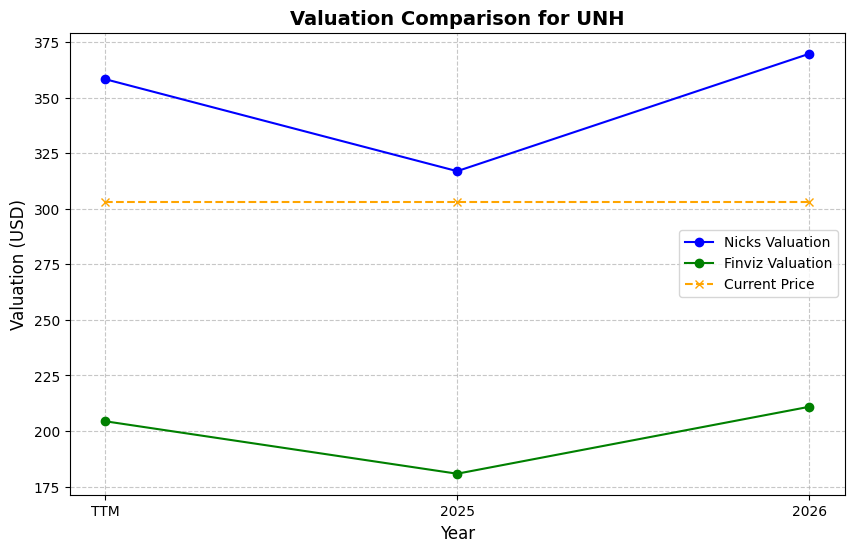
Valuation
| Share Price | Treasury Yield | Estimates | Fair Value (P/E) | Fair Value (P/S) | Current P/S | Current P/E |
|---|---|---|---|---|---|---|
| $380.31 | 4.5% | Nicks Growth: 8% Nick's Expected Margin: 6% FINVIZ Growth: 15% |
Nicks: 14 Finviz: 27 |
Nick's: 0.850 | 0.8 | 28.7 |
| Basis | Year | Nicks Valuation | Nicks vs Share Price | Finviz Valuation | Finviz vs Share Price |
|---|---|---|---|---|---|
| $13.27 EPS | TTM | $188.04 | -50.6% | $358.76 | -5.7% |
| $18.37 EPS | 2026 | $260.35 | -31.5% | $496.73 | 30.6% |
| $20.87 EPS | 2027 | $295.74 | -22.2% | $564.24 | 48.4% |
Implied Growth
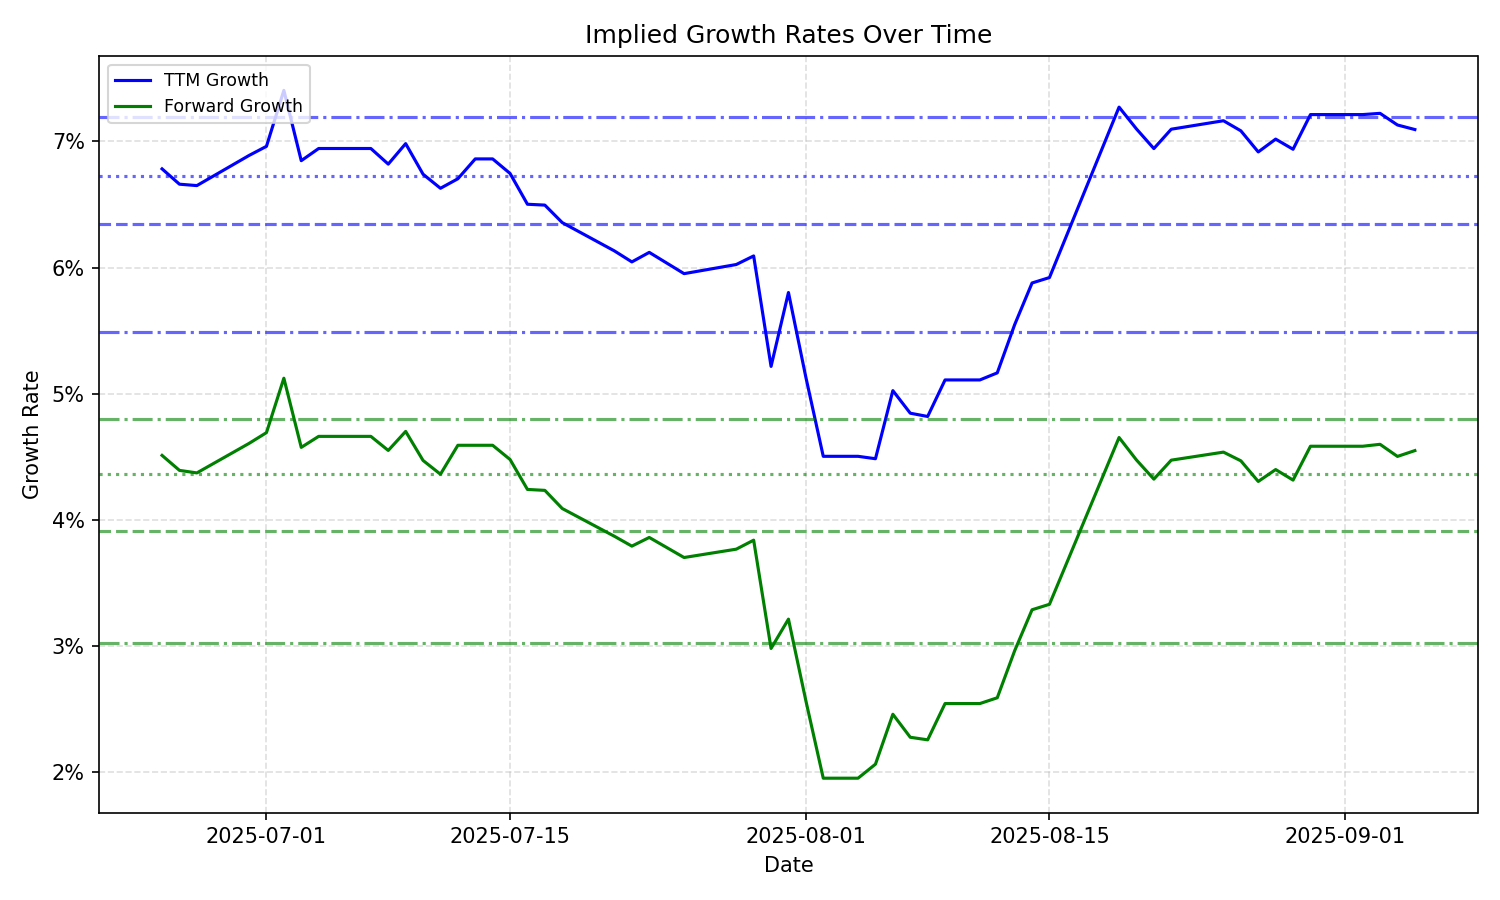
| Average | Median | Std Dev | Current | Percentile | ||||||
|---|---|---|---|---|---|---|---|---|---|---|
| TTM | Forward | TTM | Forward | TTM | Forward | TTM | Forward | TTM | Forward | |
| Timeframe | ||||||||||
| 1 Year | 8.54% | 5.67% | 8.38% | 4.98% | 2.59% | 2.40% | 15.62% | 10.70% | 93.5% | 91.0% |
| 3 Years | 8.54% | 5.67% | 8.38% | 4.98% | 2.59% | 2.40% | 15.62% | 10.70% | 93.5% | 91.0% |
| 5 Years | 8.54% | 5.67% | 8.38% | 4.98% | 2.59% | 2.40% | 15.62% | 10.70% | 93.5% | 91.0% |
| 10 Years | 8.54% | 5.67% | 8.38% | 4.98% | 2.59% | 2.40% | 15.62% | 10.70% | 93.5% | 91.0% |