Uber Technologies, Inc. — UBER
| Close Price | Market Cap | P/E Ratio | Forward P/E Ratio | Implied Growth* | Implied Forward Growth* | Dividend | P/B Ratio |
|---|---|---|---|---|---|---|---|
| $70.40 | $143.31B | 17.5 | 16.1 | 10.2% | 9.3% | - | 5.4 |
Latest Headlines
- · Uber Unveils $49 World Cup Shuttle Service Across Major US Venues
- · More Drivers Are Joining the High-Miles Club. This Stock Could Pull Ahead.
- · Uber raises Delivery Hero stake, increasing takeover odds
- · Tesla Prepares To Use Cybercabs As Robotaxis. Here's How Big Its Fleet Is.
- · Tesla Stock Fans Just Got Worrying News From Texas
- · Uber wants to answer the hotel industry’s most asked question. Now it’s integrating into 15,000 hotels globally
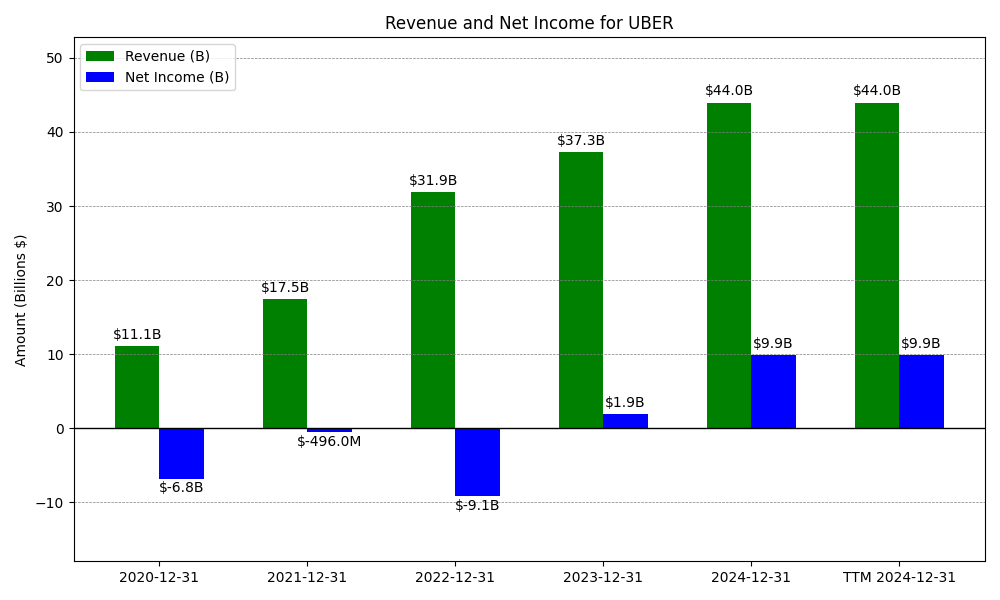
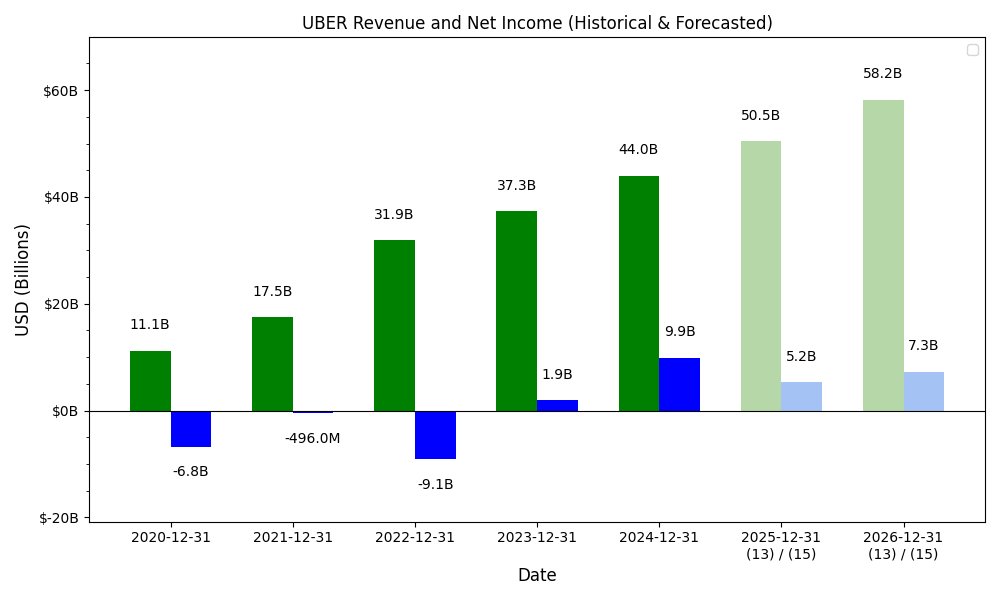
Revenue & Net Income
| Date | Revenue | Net_Income | EPS | Last_Updated | Revenue_Change | Net_Income_Change | EPS_Change | |
|---|---|---|---|---|---|---|---|---|
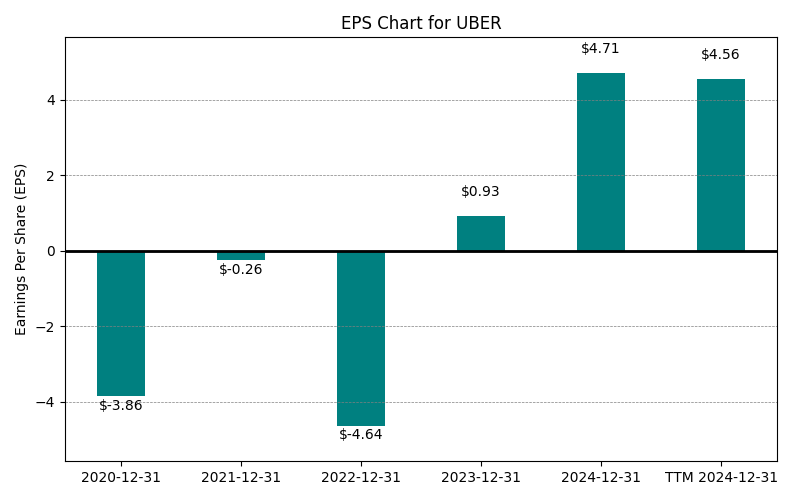
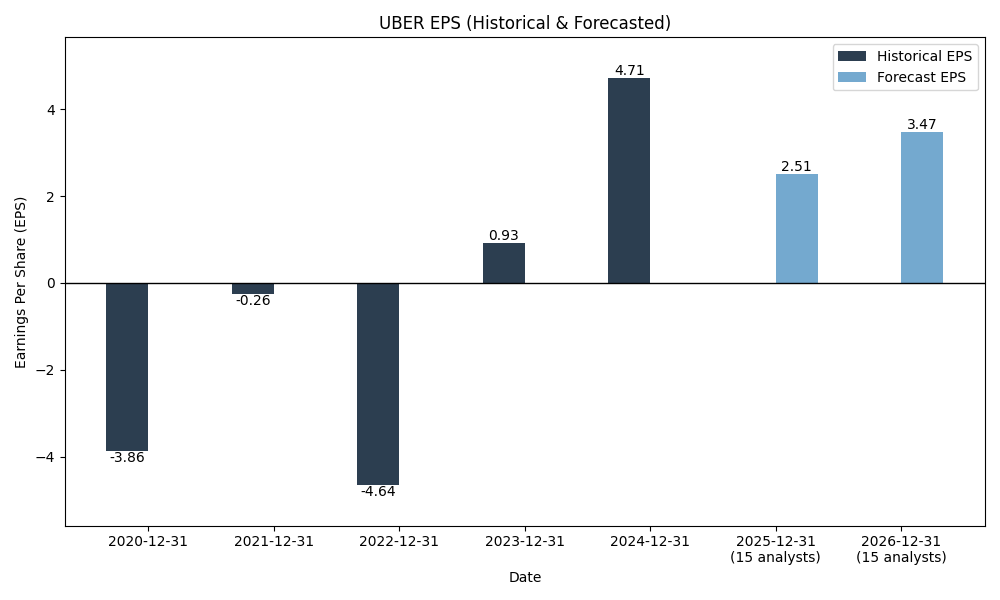
| 0 | 2020-12-31 | $11,139M | $-6,768M | $-3.86 | 2024-02-03 03:17:10 | N/A | N/A | N/A |
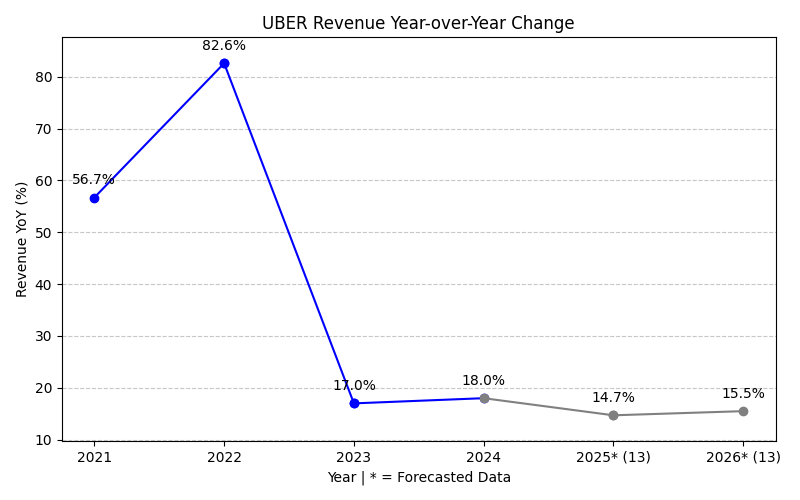
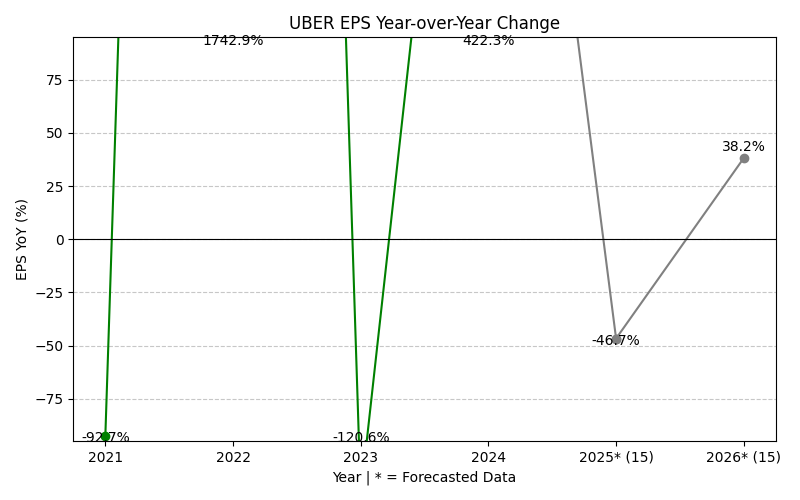
| 1 | 2021-12-31 | $17,455M | $-496M | $-0.26 | 2026-02-16 08:49:56 | 56.7% | -92.7% | -93.3% |
| 2 | 2022-12-31 | $31,877M | $-9,141M | $-4.64 | 2026-05-29 09:15:35 | 82.6% | 1742.9% | 1684.6% |
| 3 | 2023-12-31 | $37,281M | $1,887M | $0.93 | 2026-05-29 09:15:35 | 17.0% | -120.6% | -120.0% |
| 4 | 2024-12-31 | $43,978M | $9,856M | $4.71 | 2026-05-29 09:15:35 | 18.0% | 422.3% | 406.5% |
| 5 | 2025-12-31 | $52,017M | $10,053M | $4.82 | 2026-05-29 09:15:35 | 18.3% | 2.0% | 2.3% |
| 6 | TTM 2026-03-31 | $53,687M | $8,540M | $4.03 | 2026-05-11 09:16:23 | 3.2% | -15.1% | -16.4% |
EPS
Forecasts
Y/Y % Change
UBER Year-over-Year Growth
| 2020 | 2021 | 2022 | 2023 | 2024 | 2025 | 2026 | 2027 | Average | |
|---|---|---|---|---|---|---|---|---|---|
| Revenue Growth (%) | 56.7% | 82.6% | 17.0% | 18.0% | 18.3% | 11.8% | 15.3% | 31.4% | |
| Revenue Analysts (#) | 0 | 0 | 0 | 0 | 0 | 0 | 49 | 47 | |
| EPS Growth (%) | -92.7% | 1742.9% | -120.6% | 422.3% | 2.0% | -40.5% | 51.0% | 280.6% | |
| EPS Analysts (#) | 0 | 0 | 0 | 0 | 0 | 0 | 34 | 38 |
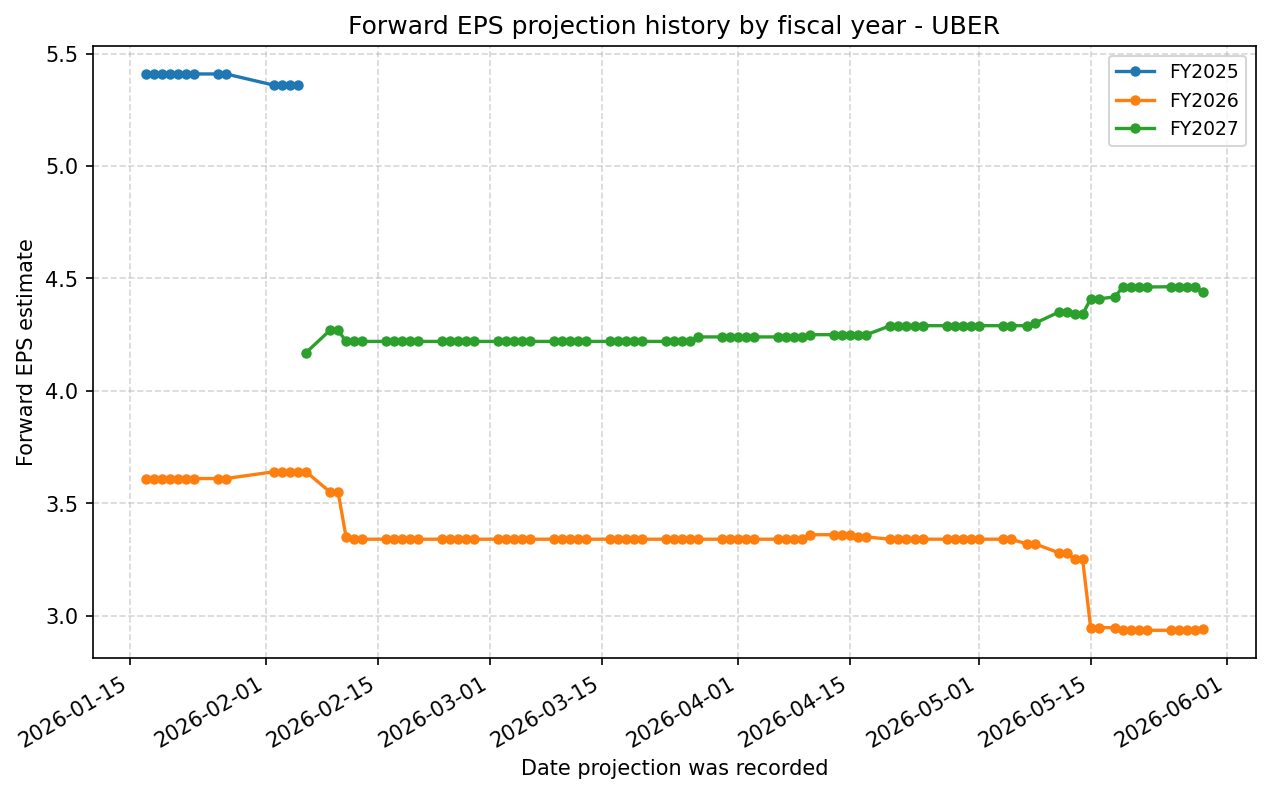
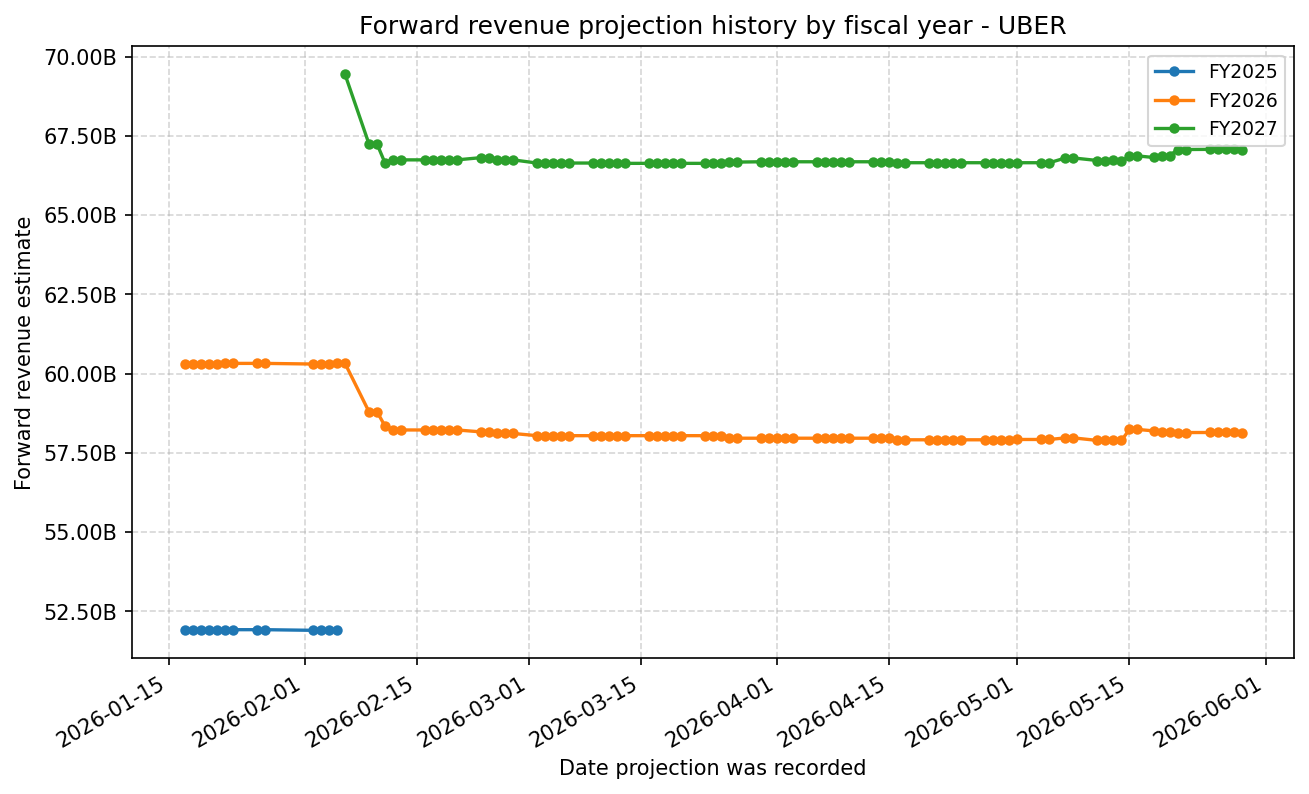
Forward Estimate History
How the next-FY EPS and revenue estimates have drifted over time. One line per fiscal year – past lines end when that FY became current.
Expenses
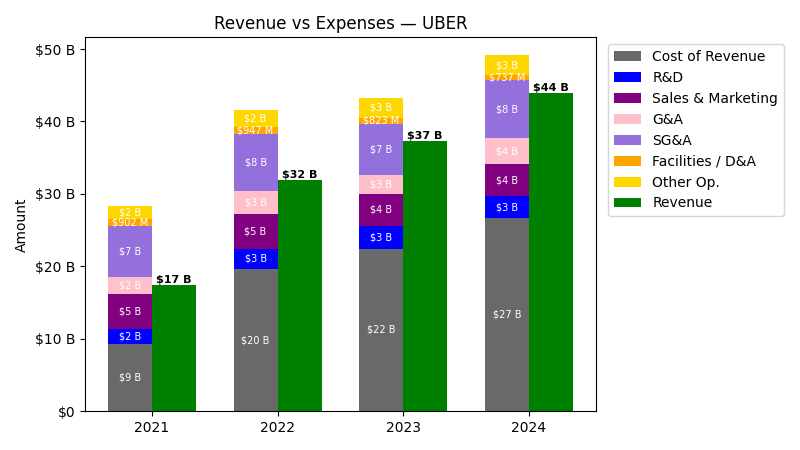
| Year | Revenue ($) | Cost of Revenue ($) | R&D ($) | Sales & Marketing ($) | G&A ($) | SG&A ($) | Facilities / D&A ($) |
|---|---|---|---|---|---|---|---|
| 2022 | $31.9B | $18.7B | $2.8B | $4.8B | $3.1B | $7.9B | $947.0M |
| 2023 | $37.3B | $21.6B | $3.2B | $4.4B | $2.7B | $7.0B | $823.0M |
| 2024 | $44.0B | $25.9B | $3.1B | $4.3B | $3.6B | $8.0B | $737.0M |
| 2025 | $52.0B | $30.6B | $3.4B | $4.9B | $3.2B | $8.1B | $747.0M |
| TTM | $53.7B | $30.9B | $3.5B | $5.2B | $3.4B | $8.5B | $760.0M |
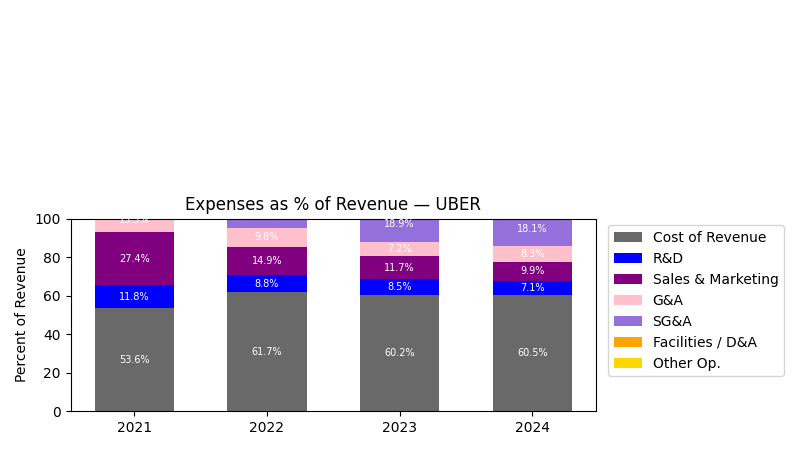
| Year | Revenue Change (%) | Cost of Revenue Change (%) | R&D Change (%) | Sales & Marketing Change (%) | G&A Change (%) | SG&A Change (%) | Facilities / D&A Change (%) |
|---|---|---|---|---|---|---|---|
| 2023 | 16.95 | 15.62 | 13.08 | -8.41 | -14.48 | -10.82 | -13.09 |
| 2024 | 17.96 | 19.66 | -1.74 | -0.44 | 35.68 | 13.33 | -10.45 |
| 2025 | 18.28 | 18.06 | 9.42 | 12.94 | -10.94 | 2.04 | 1.36 |
| TTM | 3.21 | 1.01 | 4.00 | 5.49 | 4.35 | 5.04 | 1.74 |
No unmapped expenses.
Segment Performance
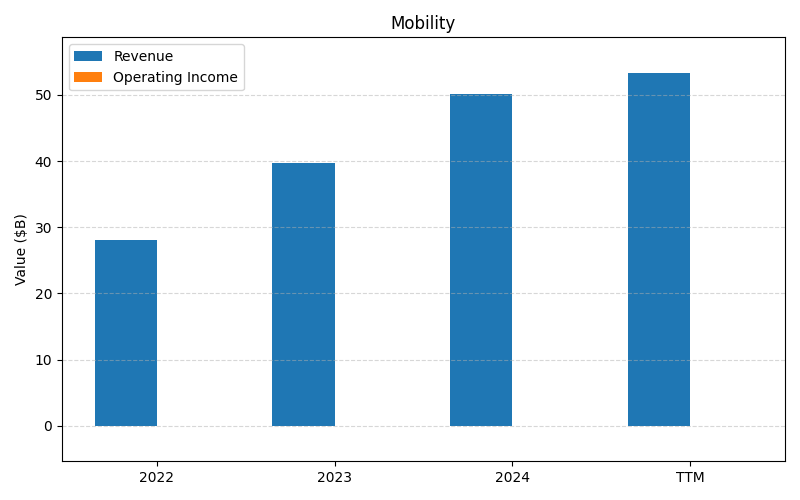
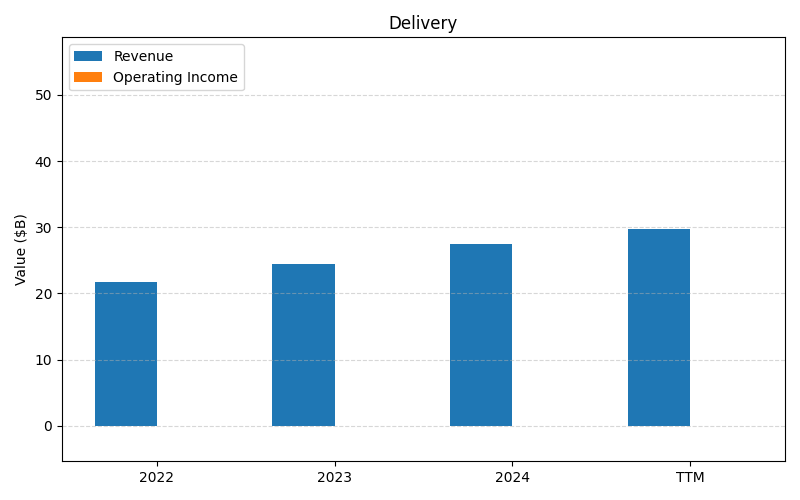
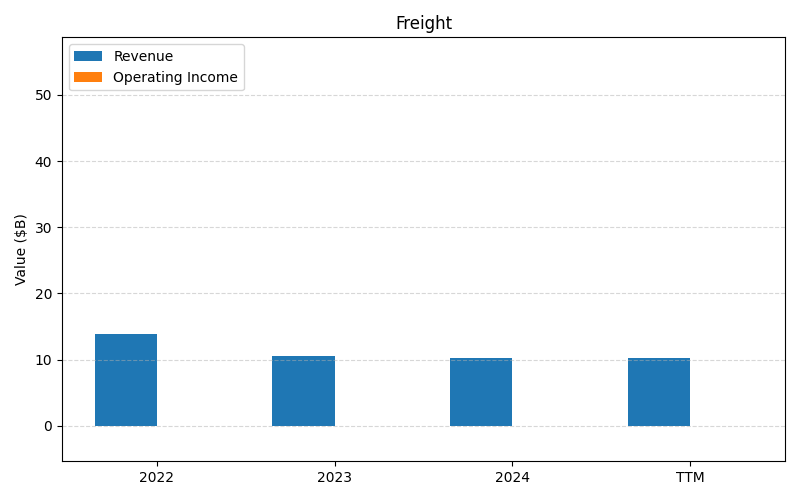
SEGMENTS v2025-09-09 · 2026-05-29 09:15 UTC — Units: $B. Rows list fiscal years (last 3 + TTM) with revenue and operating income for each segment; the final row shows the TTM revenue mix (operating income columns display “—” where mix is not applicable).
| Year | Mobility Rev | Mobility OI | Delivery Rev | Delivery OI | Freight Rev | Freight OI | Total Rev | Total OI |
|---|---|---|---|---|---|---|---|---|
| 2023 | 19.8B | – | 12.2B | – | 5.25B | – | 37.3B | – |
| 2024 | 25.1B | – | 13.8B | – | 5.14B | – | 44B | – |
| 2025 | 29.7B | – | 17.2B | – | 5.10B | – | 52B | – |
| TTM | 68.1B | 3.62B | 39.8B | 1.63B | 12.8B | -0.06B | 120.7B | 5.19B |
| % of Total (TTM) | 56.4% | — | 33.0% | — | 10.6% | — | 100% | — |
Balance Sheet
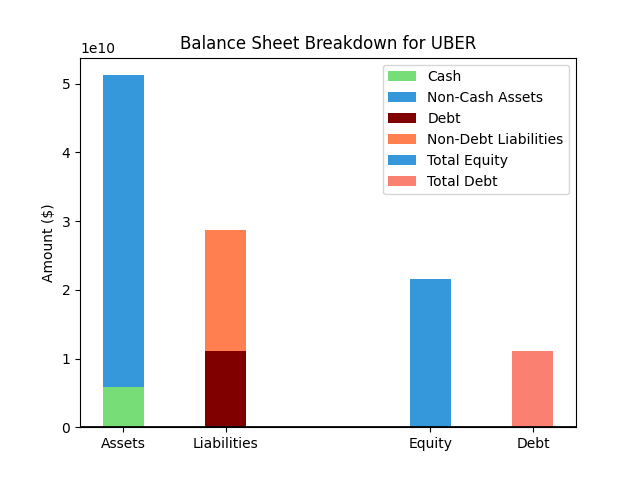
| Metric | Value | |
|---|---|---|
| 0 | Total Assets | $59,885M |
| 1 | Cash | $5,558M |
| 2 | Total Liabilities | $34,073M |
| 3 | Total Debt | $12,419M |
| 4 | Total Equity | $24,751M |
| 5 | Debt to Equity Ratio | 0.50 |
EPS & Dividend

Valuation
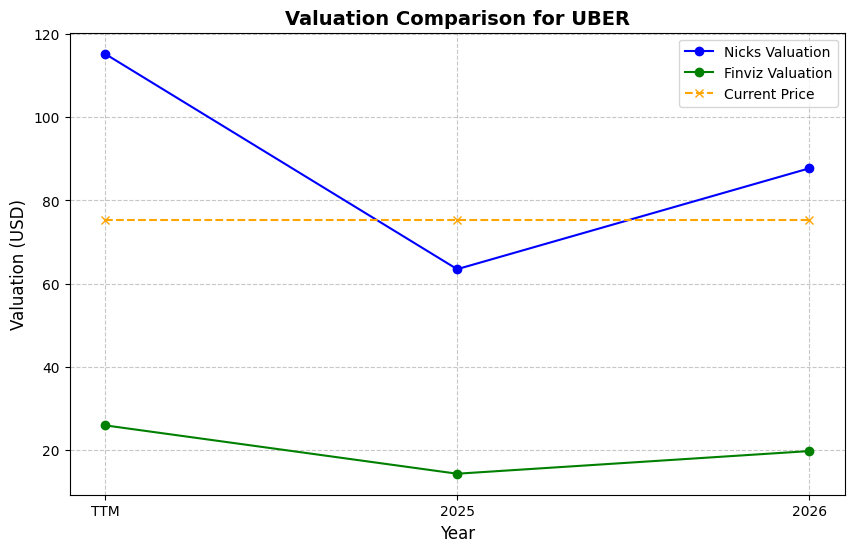
| Share Price | Treasury Yield | Estimates | Fair Value (P/E) | Fair Value (P/S) | Current P/S | Current P/E |
|---|---|---|---|---|---|---|
| $70.40 | 4.5% | Nicks Growth: 14% Nick's Expected Margin: 15% FINVIZ Growth: 4% |
Nicks: 25 Finviz: 9 |
Nick's: 3.733 | 2.7 | 17.5 |
| Basis | Year | Nicks Valuation | Nicks vs Share Price | Finviz Valuation | Finviz vs Share Price |
|---|---|---|---|---|---|
| $4.03 EPS | TTM | $100.30 | 42.5% | $37.14 | -47.2% |
| $2.94 EPS | 2026 | $73.16 | 3.9% | $27.09 | -61.5% |
| $4.44 EPS | 2027 | $110.49 | 57.0% | $40.91 | -41.9% |
Implied Growth
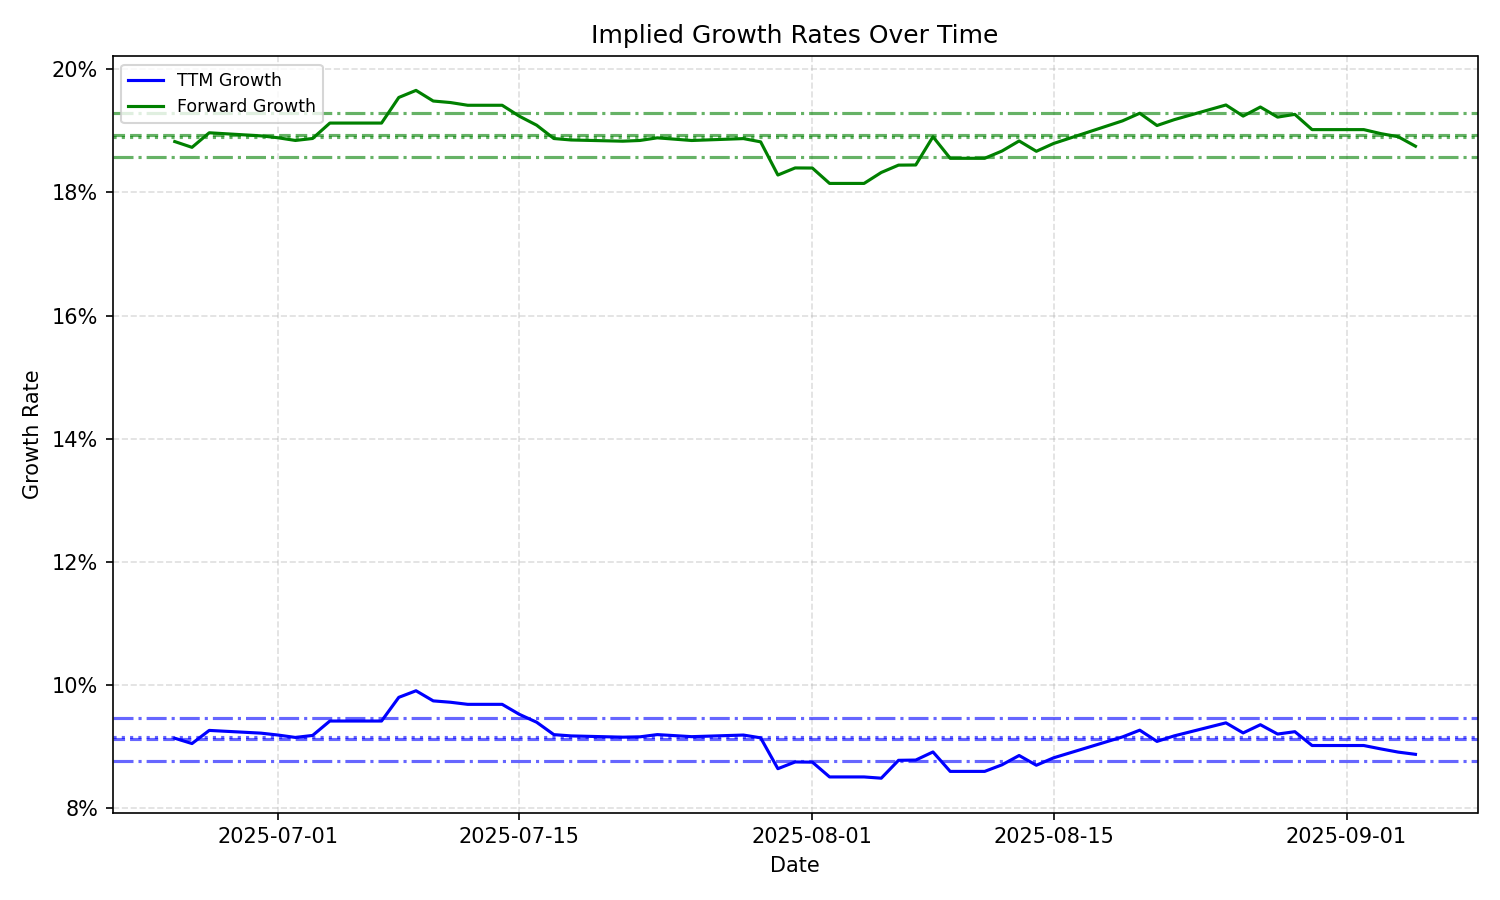
| Average | Median | Std Dev | Current | Percentile | ||||||
|---|---|---|---|---|---|---|---|---|---|---|
| TTM | Forward | TTM | Forward | TTM | Forward | TTM | Forward | TTM | Forward | |
| Timeframe | ||||||||||
| 1 Year | 9.21% | 14.89% | 8.95% | 18.12% | 3.29% | 4.36% | 10.27% | 9.42% | 87.6% | 5.0% |
| 3 Years | 9.21% | 14.89% | 8.95% | 18.12% | 3.29% | 4.36% | 10.27% | 9.42% | 87.6% | 5.0% |
| 5 Years | 9.21% | 14.89% | 8.95% | 18.12% | 3.29% | 4.36% | 10.27% | 9.42% | 87.6% | 5.0% |
| 10 Years | 9.21% | 14.89% | 8.95% | 18.12% | 3.29% | 4.36% | 10.27% | 9.42% | 87.6% | 5.0% |