United Airlines Holdings, Inc. — UAL
| Close Price | Market Cap | P/E Ratio | Forward P/E Ratio | Implied Growth* | Implied Forward Growth* | Dividend | P/B Ratio |
|---|---|---|---|---|---|---|---|
| $114.80 | $37.26B | 10.3 | 8.1 | 4.7% | 2.3% | - | 2.4 |
Latest Headlines
- · This Risk ETF Is Riding Its Best Seven-Day Stretch in a Year
- · 3 Profitable Stocks with Warning Signs
- · Airline CEOs Defend Demand As Fuel Costs Hit Consumers
- · United Airlines (UAL) Exceeds Market Returns: Some Facts to Consider
- · Stock Market Today: Nasdaq Leads Rise To Record Highs On Iran Deal Hopes; Drone Stocks Fly High
- · Analysts Name Best Picks In Industrials. One Is Topping A Buy Point Today.
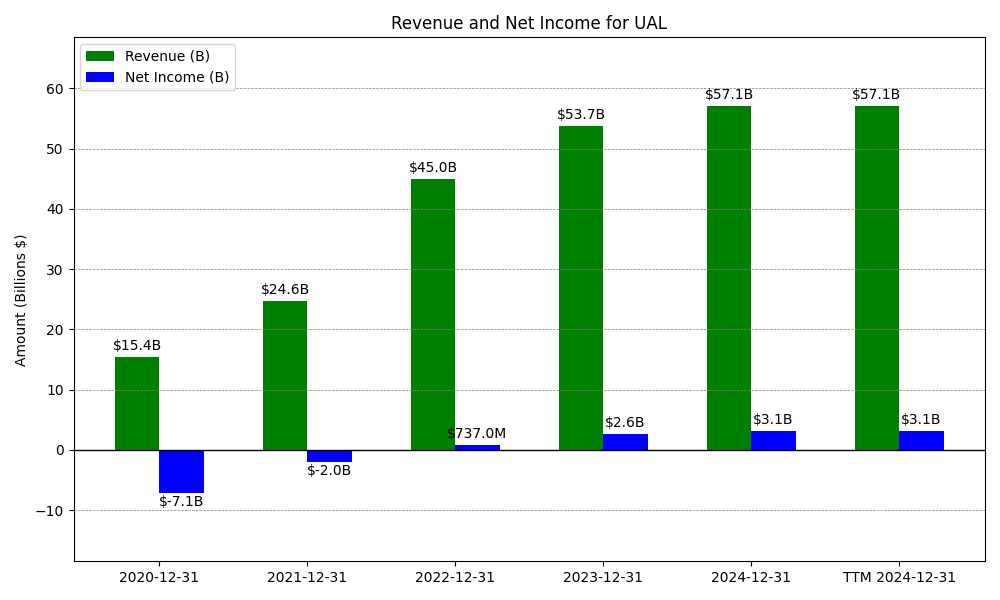
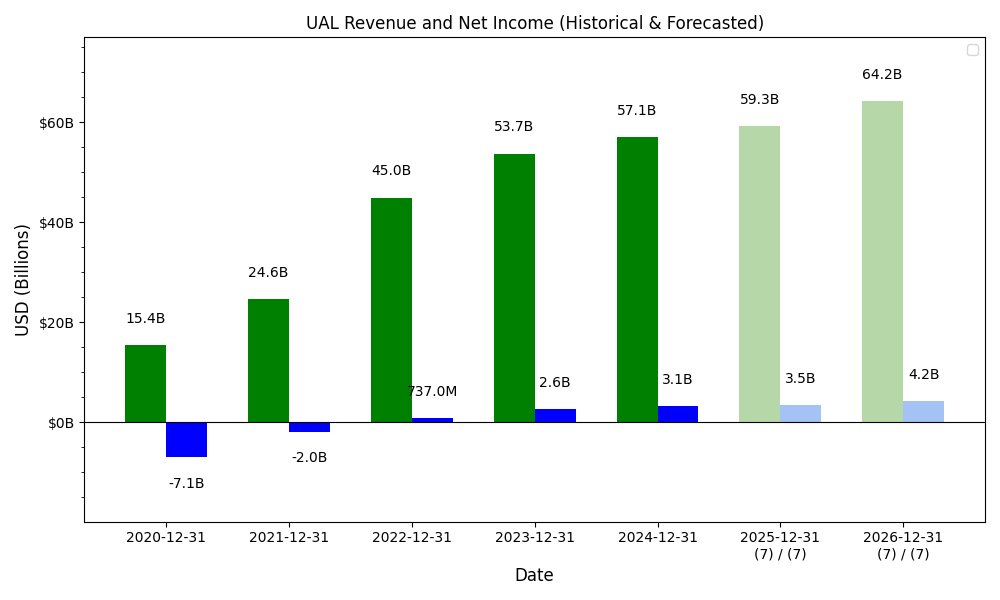
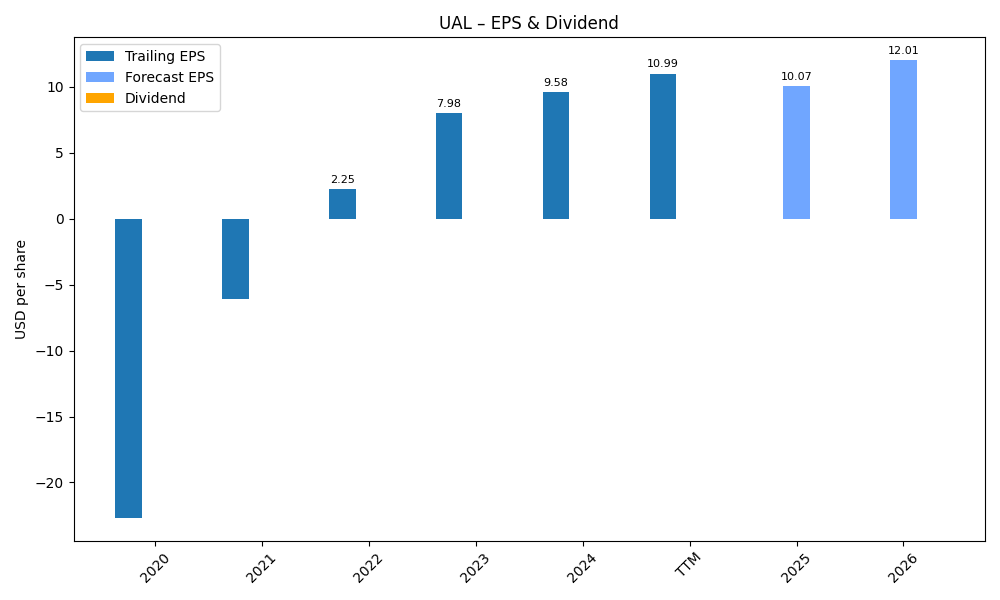
Revenue & Net Income
| Date | Revenue | Net_Income | EPS | Last_Updated | Revenue_Change | Net_Income_Change | EPS_Change | |
|---|---|---|---|---|---|---|---|---|
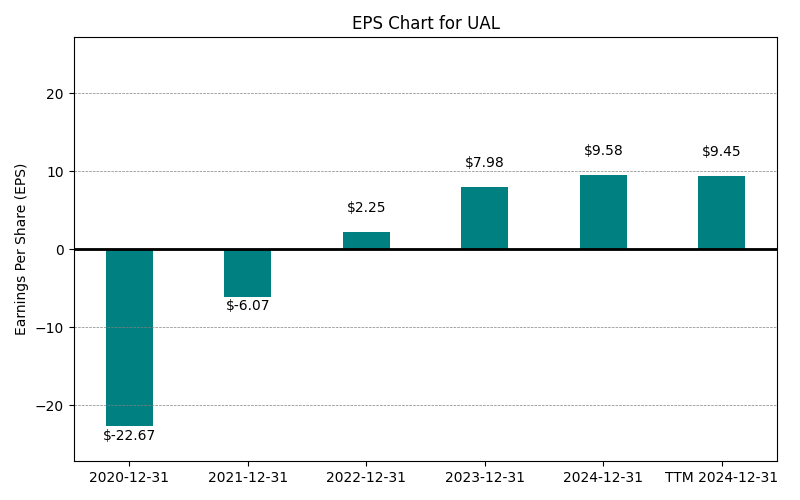
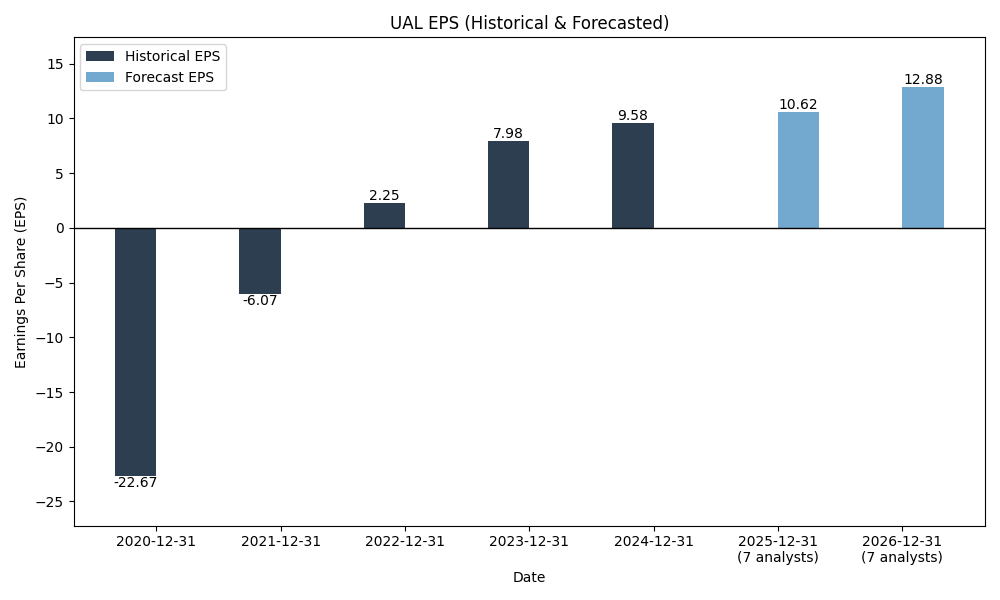
| 0 | 2020-12-31 | $15,355M | $-7,069M | $-22.67 | 2024-02-08 22:12:48 | N/A | N/A | N/A |
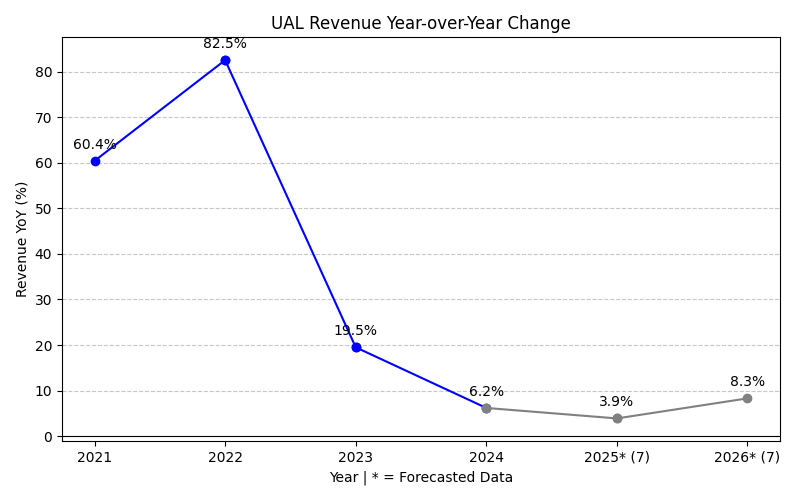
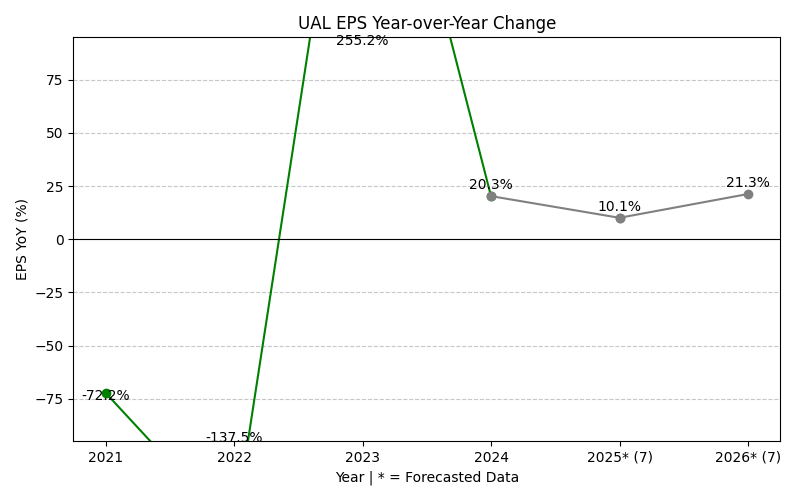
| 1 | 2021-12-31 | $24,634M | $-1,964M | $-6.07 | 2026-02-13 08:46:28 | 60.4% | -72.2% | -73.2% |
| 2 | 2022-12-31 | $44,955M | $737M | $2.25 | 2026-05-29 09:15:29 | 82.5% | -137.5% | -137.2% |
| 3 | 2023-12-31 | $53,717M | $2,618M | $7.98 | 2026-05-29 09:15:29 | 19.5% | 255.2% | 254.0% |
| 4 | 2024-12-31 | $57,063M | $3,149M | $9.60 | 2026-05-29 09:15:29 | 6.2% | 20.3% | 20.3% |
| 5 | 2025-12-31 | $59,070M | $3,353M | $10.37 | 2026-05-29 09:15:29 | 3.5% | 6.5% | 7.9% |
| 6 | TTM 2026-03-31 | $60,465M | $3,665M | $11.18 | 2026-04-24 08:51:16 | 2.4% | 9.3% | 7.9% |
EPS
Forecasts
Y/Y % Change
UAL Year-over-Year Growth
| 2020 | 2021 | 2022 | 2023 | 2024 | 2025 | 2026 | 2027 | Average | |
|---|---|---|---|---|---|---|---|---|---|
| Revenue Growth (%) | 60.4% | 82.5% | 19.5% | 6.2% | 3.5% | 13.0% | 4.3% | 27.1% | |
| Revenue Analysts (#) | 0 | 0 | 0 | 0 | 0 | 0 | 21 | 21 | |
| EPS Growth (%) | -72.2% | -137.5% | 255.2% | 20.3% | 6.5% | -10.2% | 53.3% | 16.5% | |
| EPS Analysts (#) | 0 | 0 | 0 | 0 | 0 | 0 | 24 | 24 |
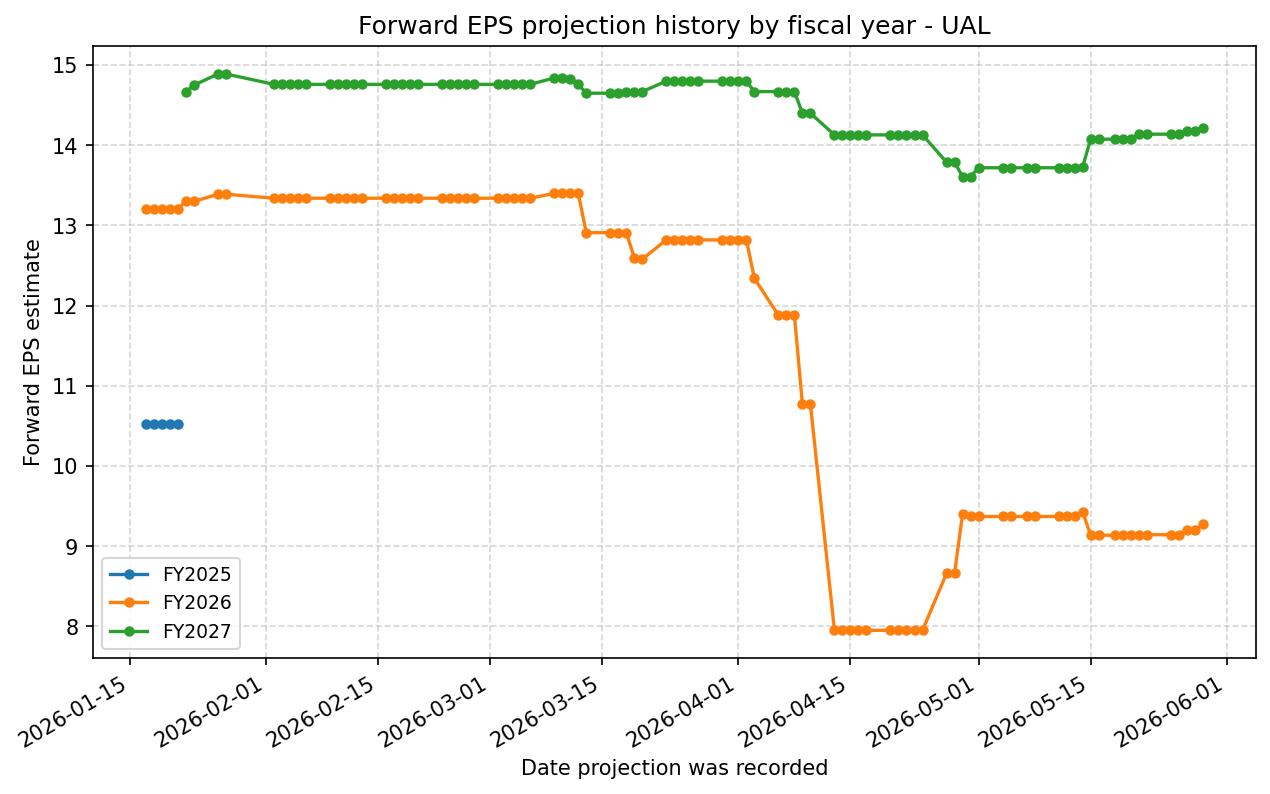
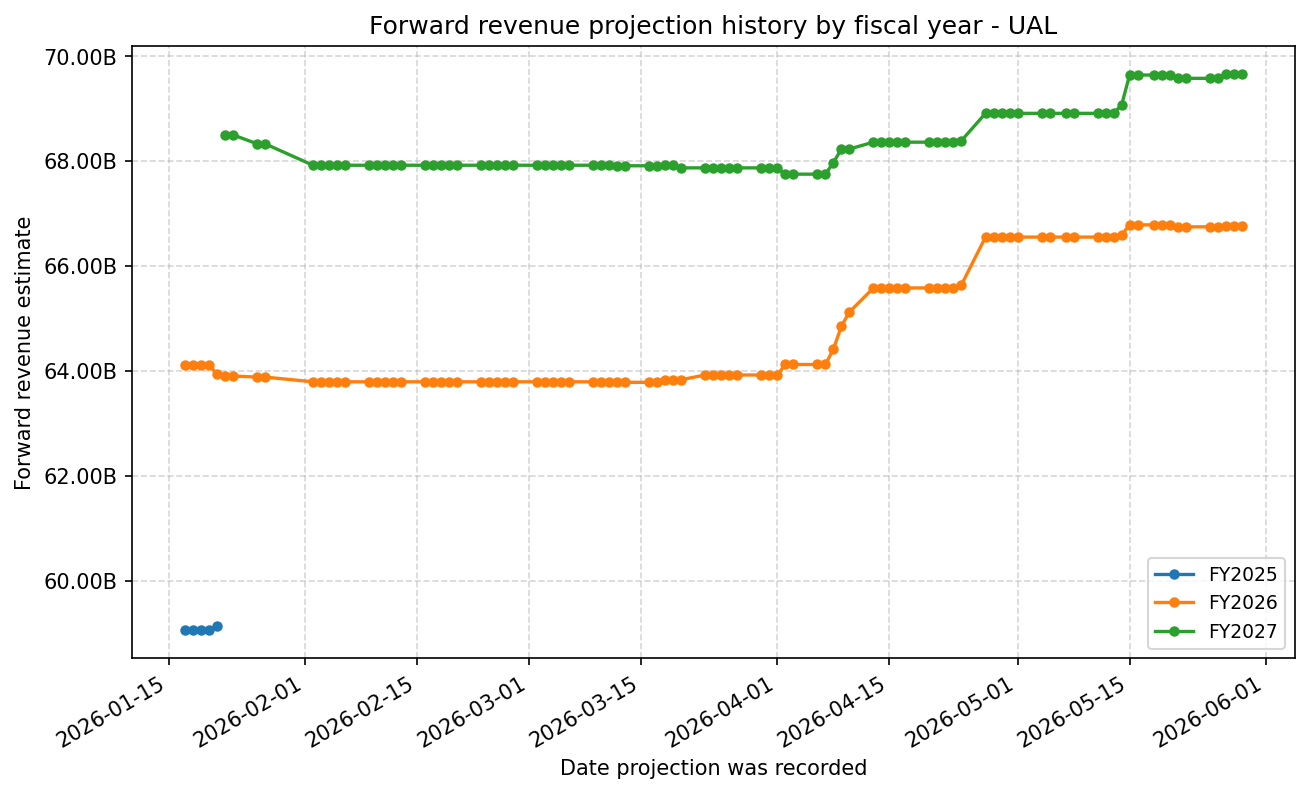
Forward Estimate History
How the next-FY EPS and revenue estimates have drifted over time. One line per fiscal year – past lines end when that FY became current.
Expenses
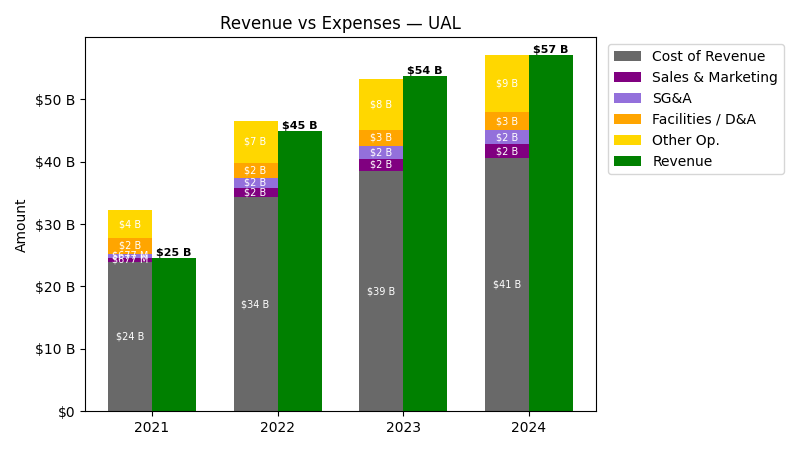
| Year | Revenue ($) | Cost of Revenue ($) | Sales & Marketing ($) | SG&A ($) | Facilities / D&A ($) |
|---|---|---|---|---|---|
| 2022 | $45.0B | $31.9B | $1.5B | $1.5B | $2.5B |
| 2023 | $53.7B | $35.8B | $2.0B | $2.0B | $2.7B |
| 2024 | $57.1B | $37.6B | $2.2B | $2.2B | $2.9B |
| 2025 | $59.1B | $39.1B | $2.1B | $2.1B | $2.9B |
| TTM | $60.5B | $38.9B | $2.1B | $2.1B | $4.2B |
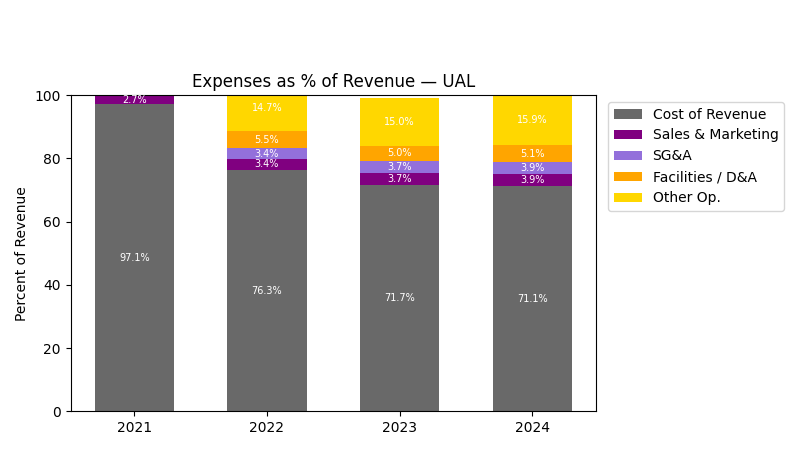
| Year | Revenue Change (%) | Cost of Revenue Change (%) | Sales & Marketing Change (%) | SG&A Change (%) | Facilities / D&A Change (%) |
|---|---|---|---|---|---|
| 2023 | 19.49 | 12.52 | 28.79 | 28.79 | 8.75 |
| 2024 | 6.23 | 5.01 | 12.85 | 12.85 | 9.62 |
| 2025 | 3.52 | 3.95 | -5.47 | -5.47 | 0.38 |
| TTM | 2.36 | -0.56 | 1.23 | 1.23 | 43.18 |
No unmapped expenses.
Segment Performance
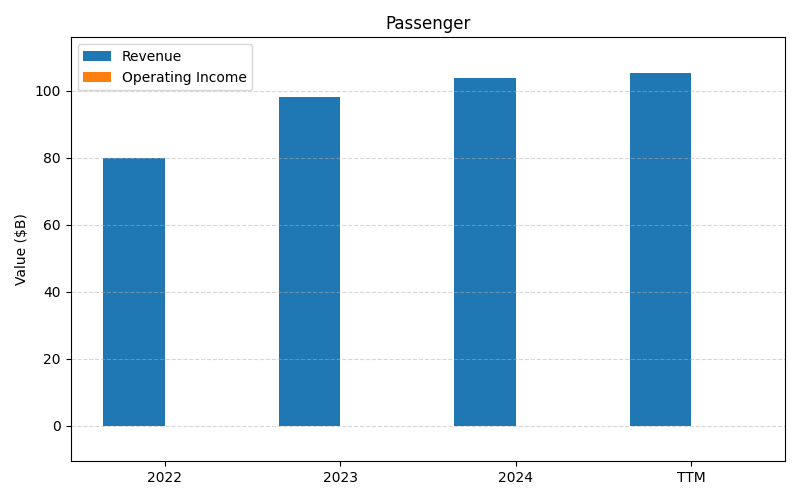
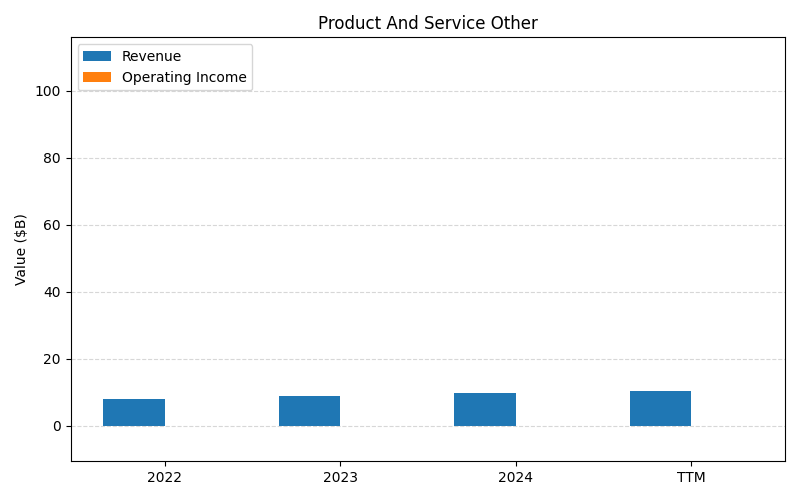
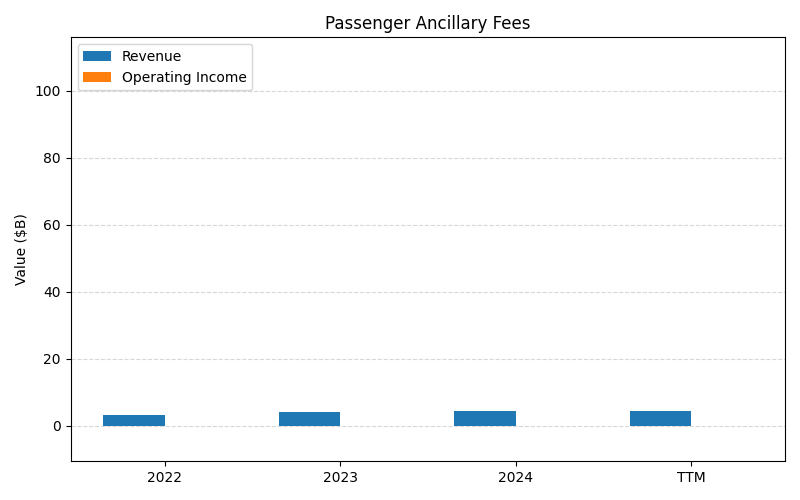
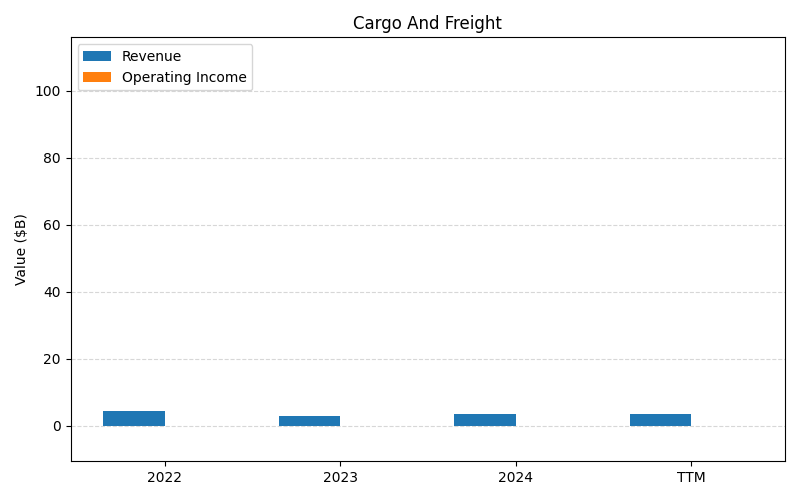
SEGMENTS v2025-09-09 · 2026-05-29 09:15 UTC — Units: $B. Rows list fiscal years (last 3 + TTM) with revenue for each segment; the final row shows the TTM revenue mix (operating income columns display “—” where mix is not applicable).
| Year | Passenger Rev | Product And Service Other Rev | Passenger Ancillary Fees Rev | Cargo And Freight Rev | Total Rev |
|---|---|---|---|---|---|
| 2023 | 98.1B | 9.05B | 4.10B | 2.99B | 114.2B |
| 2024 | 103.7B | 9.88B | 4.50B | 3.49B | 121.5B |
| 2025 | 106.9B | 10.9B | 4.80B | 3.56B | 126.1B |
| TTM | 260.6B | 26.3B | 11.5B | 8.75B | 307.1B |
| % of Total (TTM) | 84.8% | 8.6% | 3.7% | 2.8% | 100% |
Balance Sheet
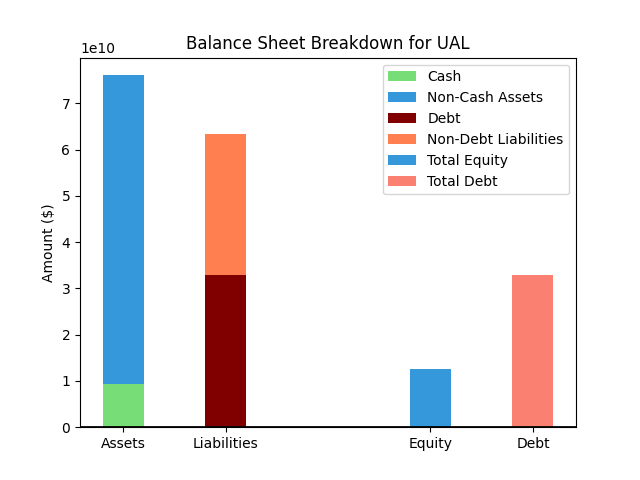
| Metric | Value | |
|---|---|---|
| 0 | Total Assets | $80,941M |
| 1 | Cash | $7,869M |
| 2 | Total Liabilities | $65,065M |
| 3 | Total Debt | $30,971M |
| 4 | Total Equity | $15,876M |
| 5 | Debt to Equity Ratio | 1.95 |
EPS & Dividend
Valuation
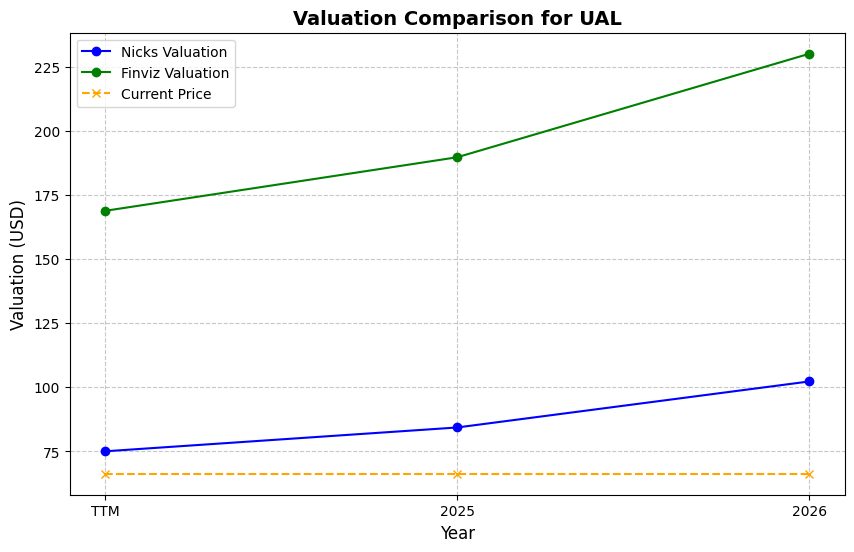
| Share Price | Treasury Yield | Estimates | Fair Value (P/E) | Fair Value (P/S) | Current P/S | Current P/E |
|---|---|---|---|---|---|---|
| $114.80 | 4.5% | Nicks Growth: 2% Nick's Expected Margin: 7% FINVIZ Growth: 17% |
Nicks: 8 Finviz: 32 |
Nick's: 0.546 | 0.6 | 10.3 |
| Basis | Year | Nicks Valuation | Nicks vs Share Price | Finviz Valuation | Finviz vs Share Price |
|---|---|---|---|---|---|
| $11.18 EPS | TTM | $87.21 | -24.0% | $362.31 | 215.6% |
| $9.27 EPS | 2026 | $72.34 | -37.0% | $300.51 | 161.8% |
| $14.22 EPS | 2027 | $110.91 | -3.4% | $460.74 | 301.3% |
Implied Growth
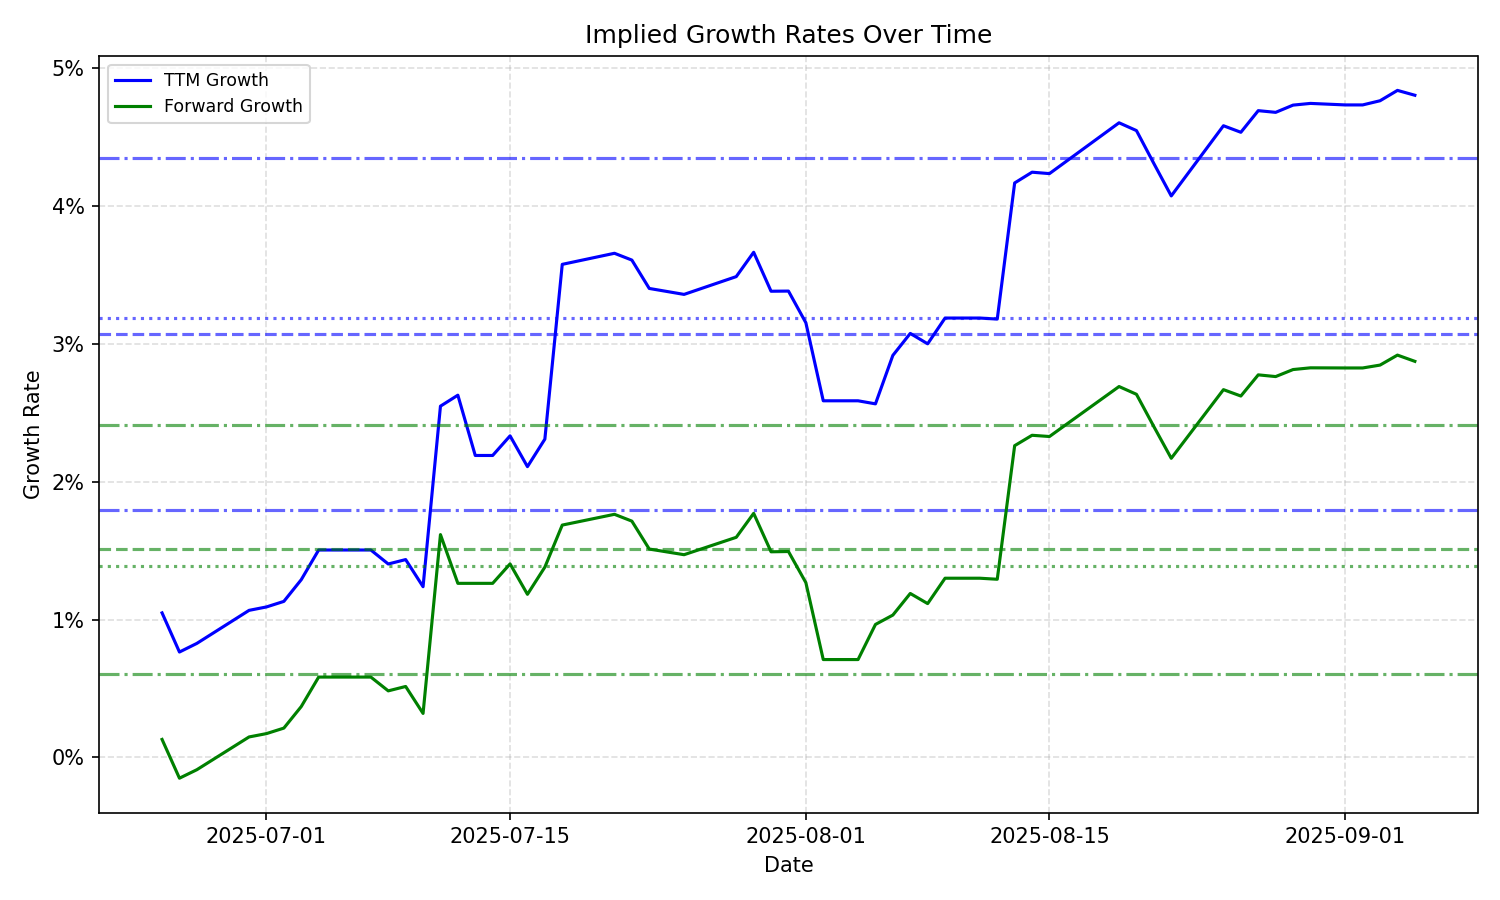
| Average | Median | Std Dev | Current | Percentile | ||||||
|---|---|---|---|---|---|---|---|---|---|---|
| TTM | Forward | TTM | Forward | TTM | Forward | TTM | Forward | TTM | Forward | |
| Timeframe | ||||||||||
| 1 Year | 3.84% | 1.45% | 3.84% | 1.49% | 1.10% | 1.11% | 4.74% | 2.36% | 76.4% | 73.1% |
| 3 Years | 3.84% | 1.45% | 3.84% | 1.49% | 1.10% | 1.11% | 4.74% | 2.36% | 76.4% | 73.1% |
| 5 Years | 3.84% | 1.45% | 3.84% | 1.49% | 1.10% | 1.11% | 4.74% | 2.36% | 76.4% | 73.1% |
| 10 Years | 3.84% | 1.45% | 3.84% | 1.49% | 1.10% | 1.11% | 4.74% | 2.36% | 76.4% | 73.1% |