Tyson Foods, Inc. — TSN
| Close Price | Market Cap | P/E Ratio | Forward P/E Ratio | Implied Growth* | Implied Forward Growth* | Dividend | P/B Ratio |
|---|---|---|---|---|---|---|---|
| $61.02 | $21.49B | 48.0 | 13.4 | 21.4% | 7.4% | $2.04 3.3% | 1.2 |
Latest Headlines
- · Hershey's Pricing Power Shines: Can It Offset Cocoa Cost Inflation?
- · MAMA Stock: What Is Driving Mama's Creations Growth in 2026?
- · Tyson Foods, Inc. (TSN) Is a Trending Stock: Facts to Know Before Betting on It
- · Can EL's Beauty Reimagined Strategy Revive Long-Term Growth?
- · We Wouldn't Be Too Quick To Buy Tyson Foods, Inc. (NYSE:TSN) Before It Goes Ex-Dividend
- · S&P 500 and Nasdaq 100 Post Record Highs on US-Iran Truce Reports
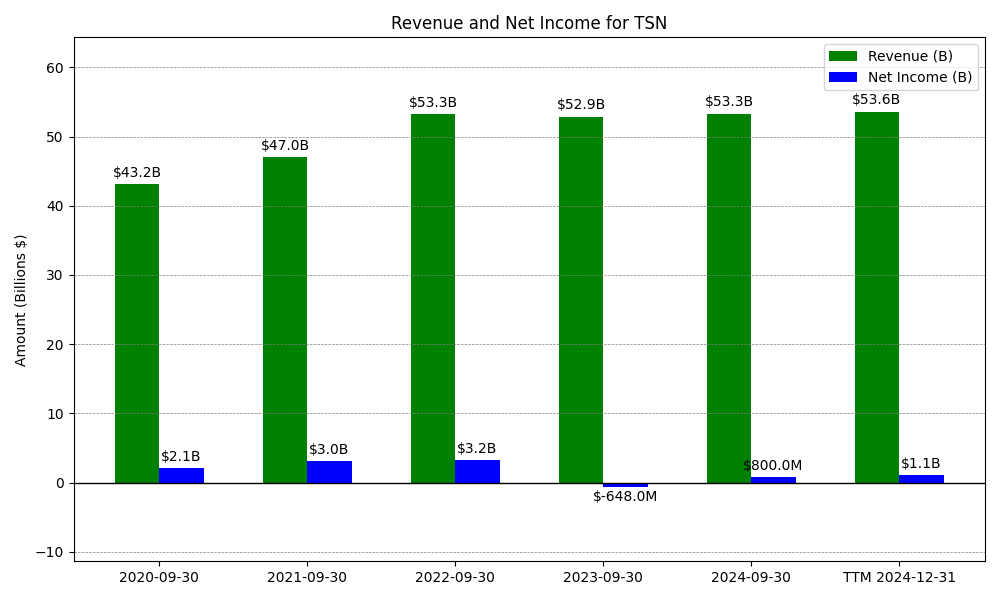
Revenue & Net Income
| Date | Revenue | Net_Income | EPS | Last_Updated | Revenue_Change | Net_Income_Change | EPS_Change | |
|---|---|---|---|---|---|---|---|---|
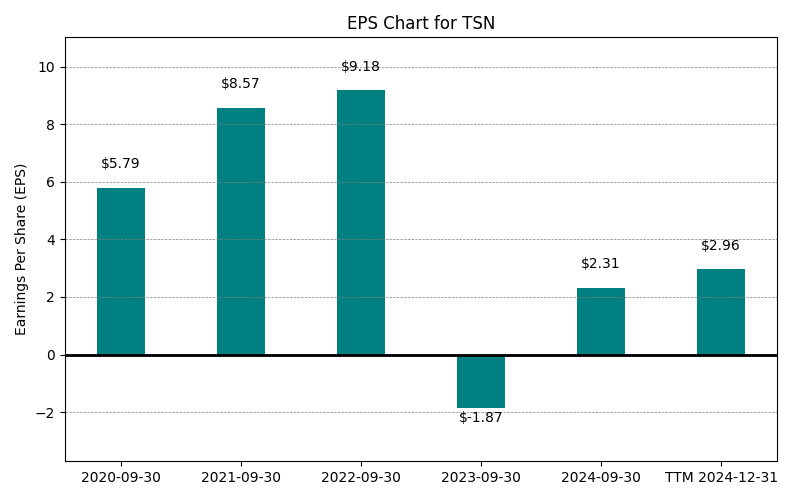
| 0 | 2020-09-30 | $43,185M | $2,061M | $5.79 | 2024-02-04 04:18:38 | N/A | N/A | N/A |
| 1 | 2021-09-30 | $47,049M | $3,047M | $8.57 | 2024-02-04 04:18:38 | 8.9% | 47.8% | 48.0% |
| 2 | 2022-09-30 | $53,282M | $3,238M | $9.18 | 2026-05-29 09:15:21 | 13.2% | 6.3% | 7.1% |
| 3 | 2023-09-30 | $52,881M | $-648M | $-1.87 | 2026-05-29 09:15:21 | -0.8% | -120.0% | -120.4% |
| 4 | 2024-09-30 | $53,309M | $800M | $2.31 | 2026-05-29 09:15:21 | 0.8% | -223.5% | -223.5% |
| 5 | 2025-09-30 | $54,441M | $474M | $1.37 | 2026-05-29 09:15:21 | 2.1% | -40.8% | -40.7% |
| 6 | TTM 2026-03-31 | $55,710M | $453M | $1.27 | 2026-05-08 08:40:25 | 2.3% | -4.4% | -7.3% |
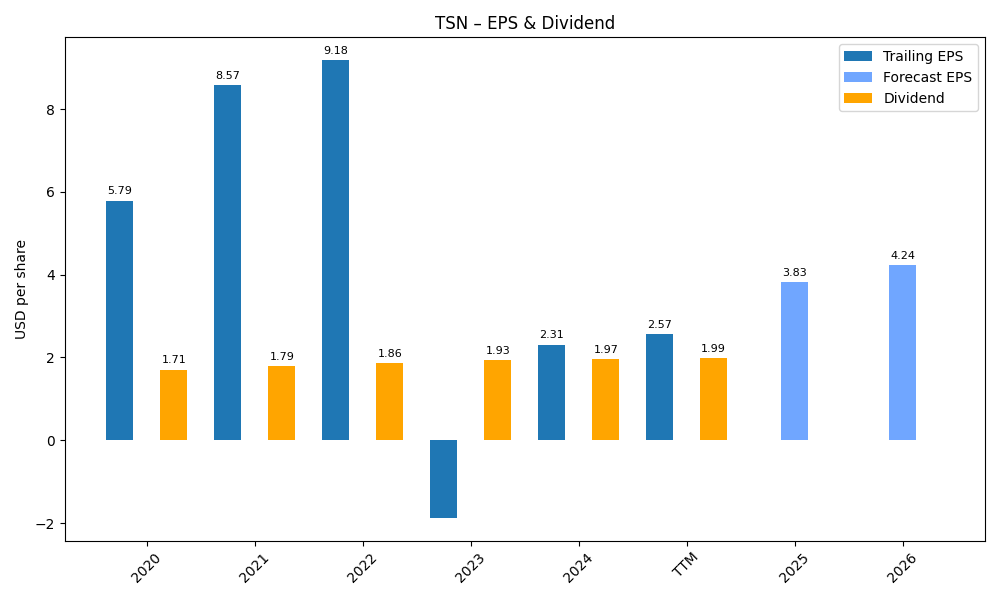
EPS
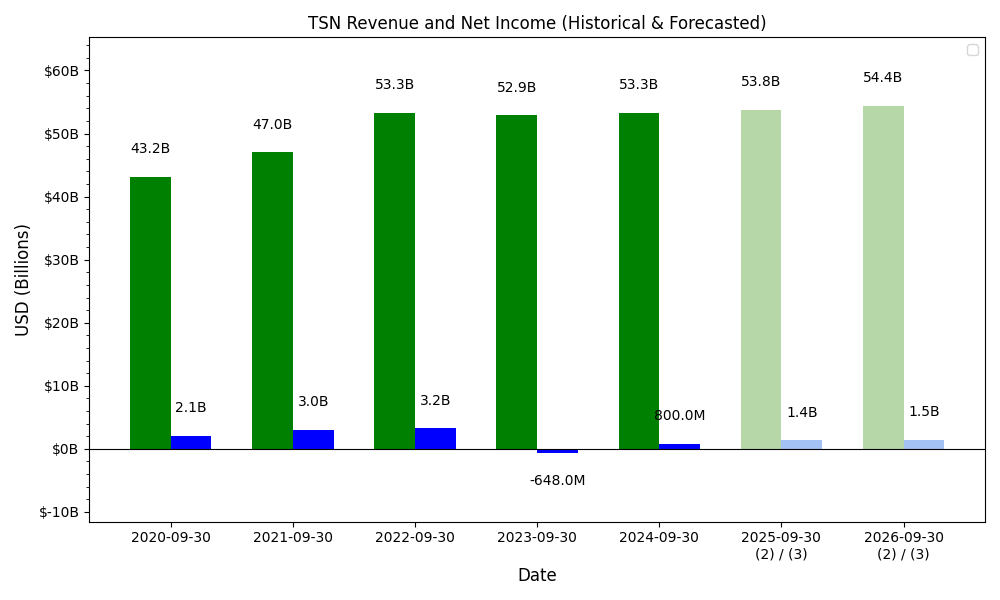
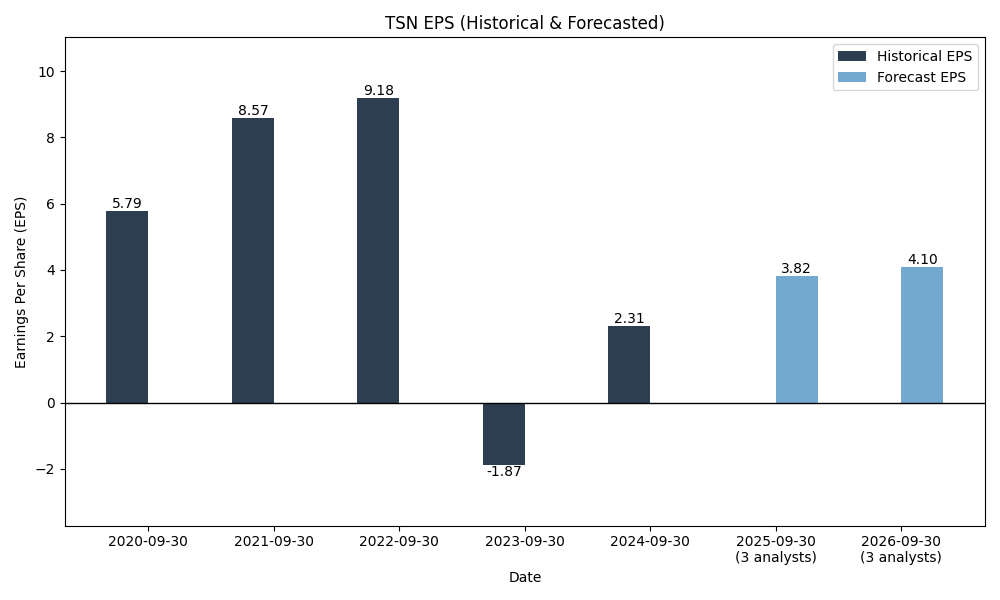
Forecasts
Y/Y % Change
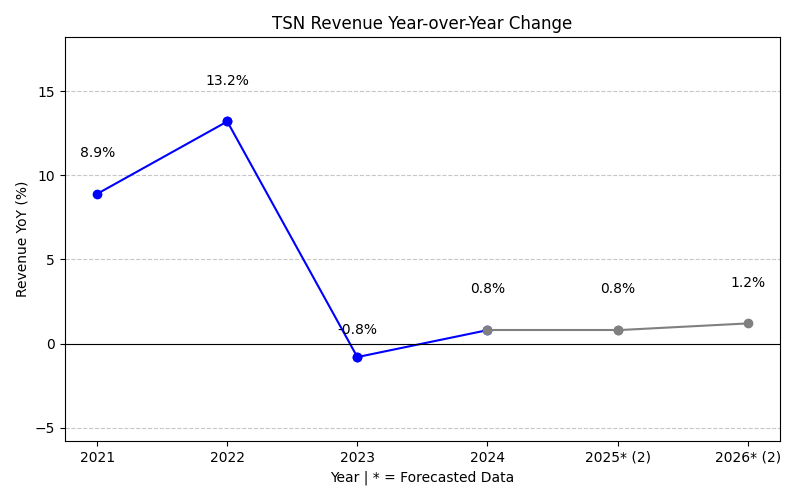
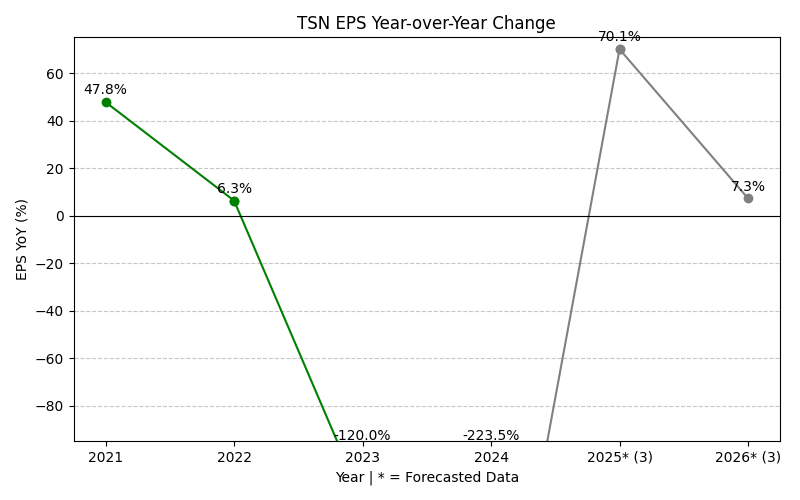
TSN Year-over-Year Growth
| 2020 | 2021 | 2022 | 2023 | 2024 | 2025 | 2026 | 2027 | Average | |
|---|---|---|---|---|---|---|---|---|---|
| Revenue Growth (%) | 8.9% | 13.2% | -0.8% | 0.8% | 2.1% | 4.3% | 1.0% | 4.2% | |
| Revenue Analysts (#) | 0 | 0 | 0 | 0 | 0 | 0 | 8 | 10 | |
| EPS Growth (%) | 47.8% | 6.3% | -120.0% | -223.5% | -40.8% | 203.2% | 11.7% | -16.5% | |
| EPS Analysts (#) | 0 | 0 | 0 | 0 | 0 | 0 | 11 | 11 |
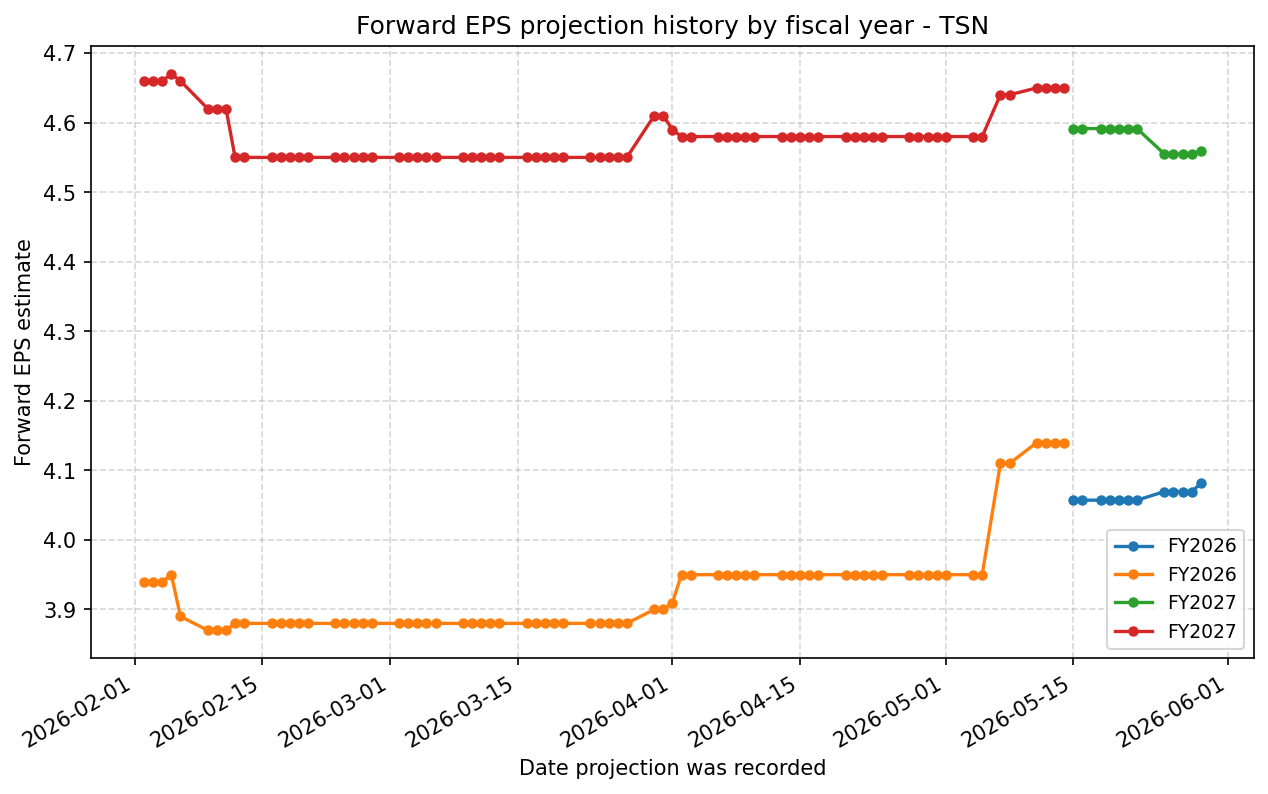
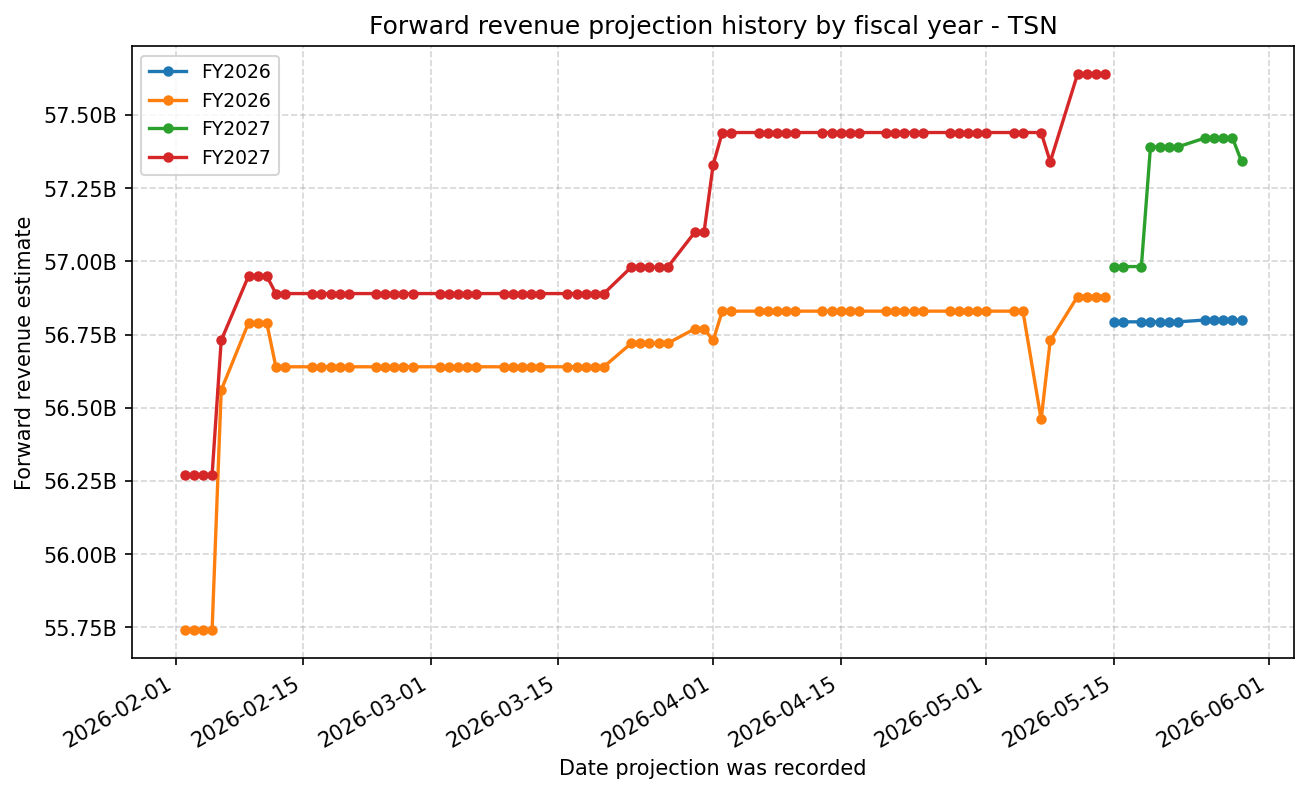
Forward Estimate History
How the next-FY EPS and revenue estimates have drifted over time. One line per fiscal year – past lines end when that FY became current.
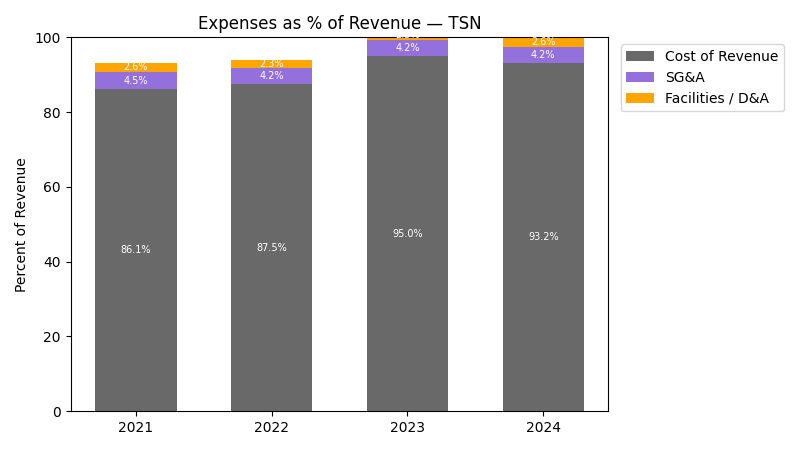
Expenses
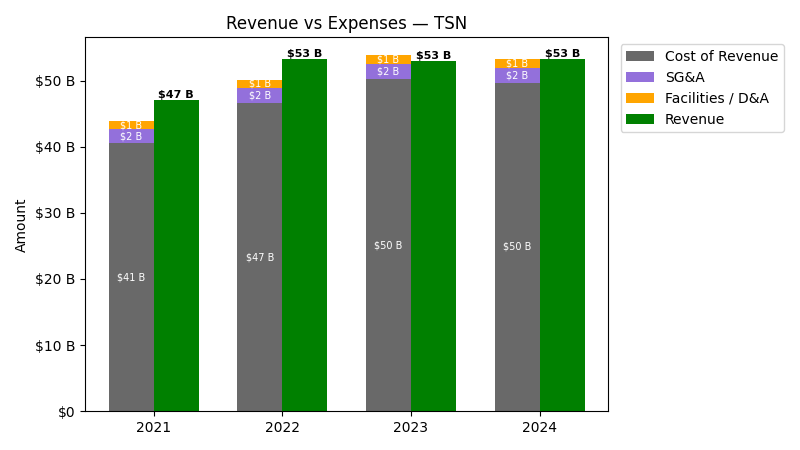
| Year | Revenue ($) | Cost of Revenue ($) | SG&A ($) | Facilities / D&A ($) |
|---|---|---|---|---|
| 2022 | $53.3B | $45.4B | $2.3B | $1.2B |
| 2023 | $52.9B | $48.9B | $2.2B | $1.3B |
| 2024 | $53.3B | $48.3B | $2.2B | $1.4B |
| 2025 | $54.4B | $49.5B | $2.1B | $1.4B |
| TTM | $55.7B | $50.7B | $2.1B | $1.4B |
| Year | Revenue Change (%) | Cost of Revenue Change (%) | SG&A Change (%) | Facilities / D&A Change (%) |
|---|---|---|---|---|
| 2023 | -0.75 | 7.71 | -0.58 | 11.40 |
| 2024 | 0.81 | -1.29 | -1.20 | 4.56 |
| 2025 | 2.12 | 2.56 | -4.37 | -2.79 |
| TTM | 2.33 | 2.36 | 0.85 | 1.91 |
No unmapped expenses.
Segment Performance
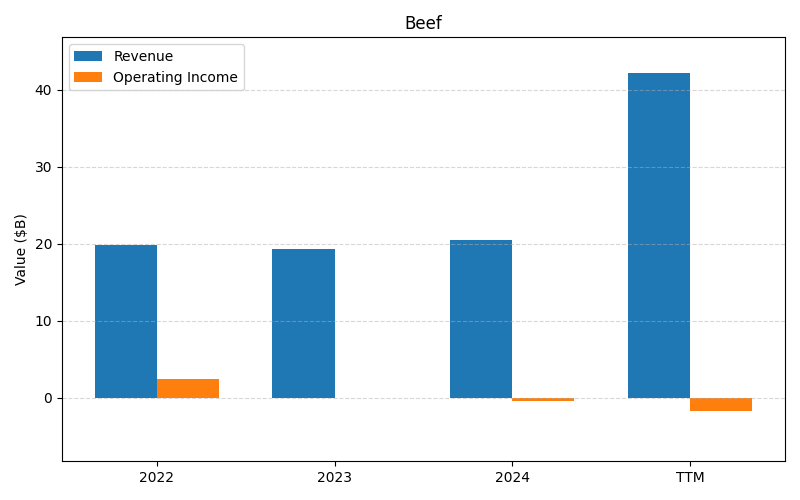
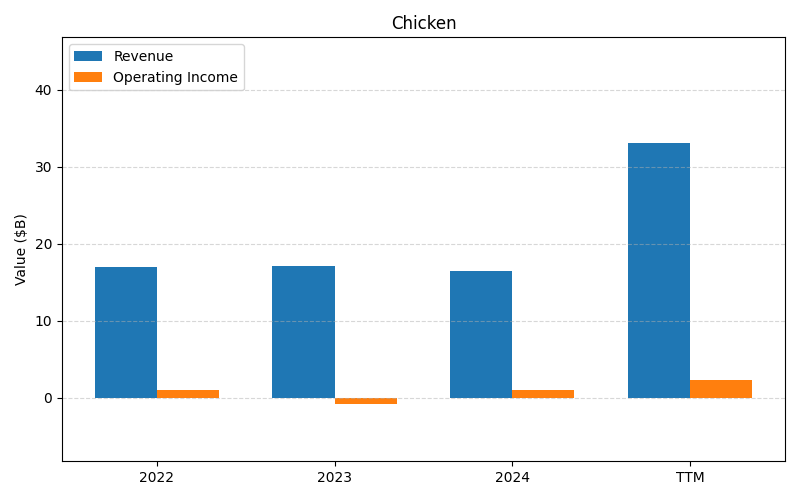
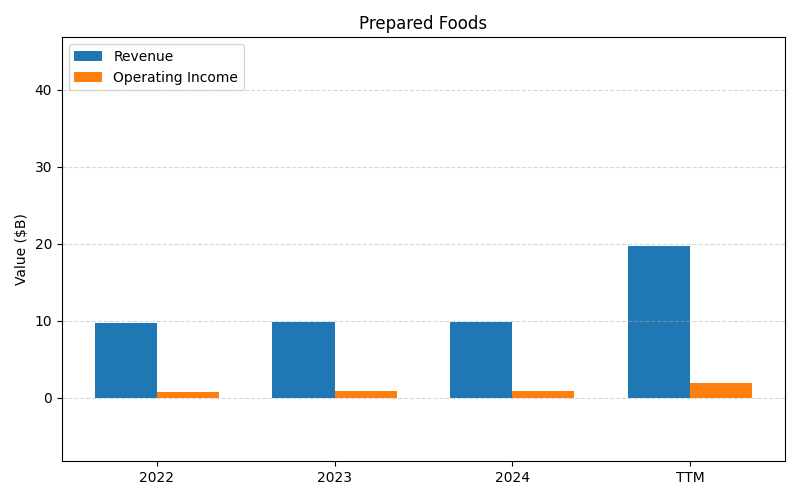
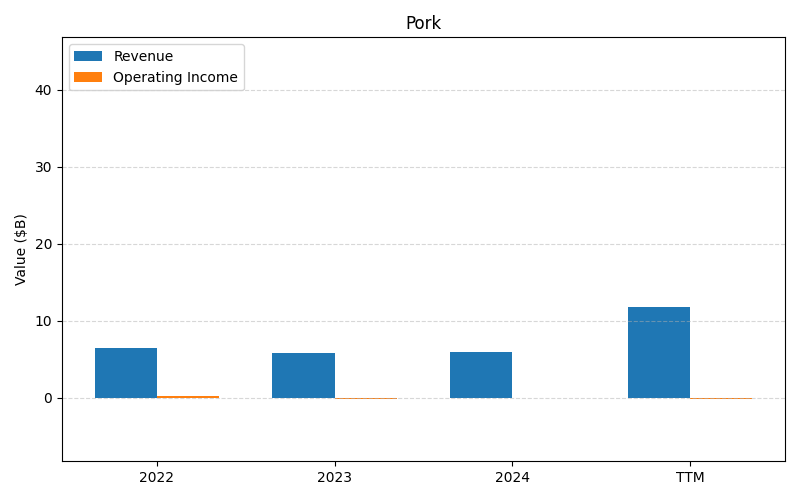
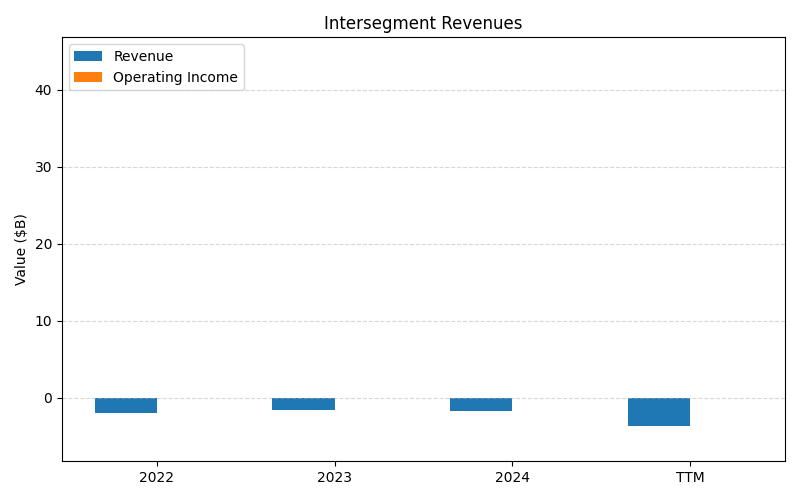
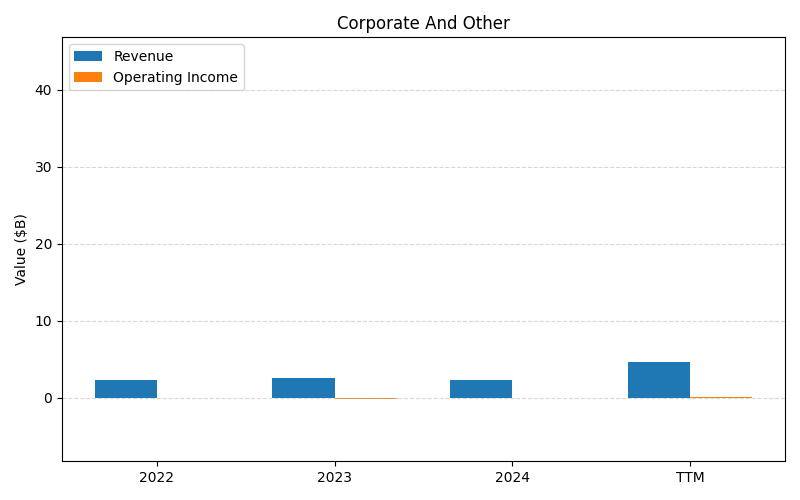
SEGMENTS v2025-09-09 · 2026-05-29 09:15 UTC — Units: $B. Rows list fiscal years (last 3 + TTM) with revenue and operating income for each segment; the final row shows the TTM revenue mix (operating income columns display “—” where mix is not applicable).
| Year | Beef Rev | Beef OI | Chicken Rev | Chicken OI | Prepared Foods Rev | Prepared Foods OI | Pork Rev | Pork OI | Intersegment Revenues Rev | Intersegment Revenues OI | Corporate And Other Rev | Corporate And Other OI | Total Rev | Total OI |
|---|---|---|---|---|---|---|---|---|---|---|---|---|---|---|
| 2023 | 19.3B | -0.09B | 17.1B | -0.77B | 9.85B | 0.82B | 5.77B | -0.14B | -1.63B | – | 2.52B | -0.22B | 52.9B | -0.40B |
| 2024 | 20.5B | -0.38B | 16.4B | 0.99B | 9.85B | 0.88B | 5.90B | -0.04B | -1.70B | – | 2.35B | -0.04B | 53.3B | 1.41B |
| 2025 | 21.6B | -1.14B | 16.8B | 1.43B | 9.93B | 0.90B | 5.78B | -0.20B | -2.02B | – | 2.29B | 0.11B | 54.4B | 1.10B |
| TTM | 74B | -1.52B | 58.4B | 2.42B | 34.7B | 1.78B | 20.6B | -0.24B | -6.66B | 0.00B | – | – | 181B | 2.44B |
| % of Total (TTM) | 40.9% | — | 32.3% | — | 19.2% | — | 11.4% | — | -3.7% | — | – | — | 100% | — |
Balance Sheet
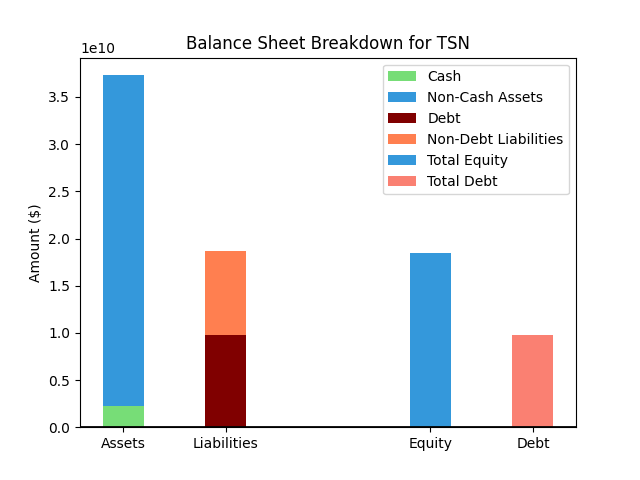
| Metric | Value | |
|---|---|---|
| 0 | Total Assets | $35,165M |
| 1 | Cash | $500M |
| 2 | Total Liabilities | $16,964M |
| 3 | Total Debt | $8,083M |
| 4 | Total Equity | $18,098M |
| 5 | Debt to Equity Ratio | 0.45 |
EPS & Dividend
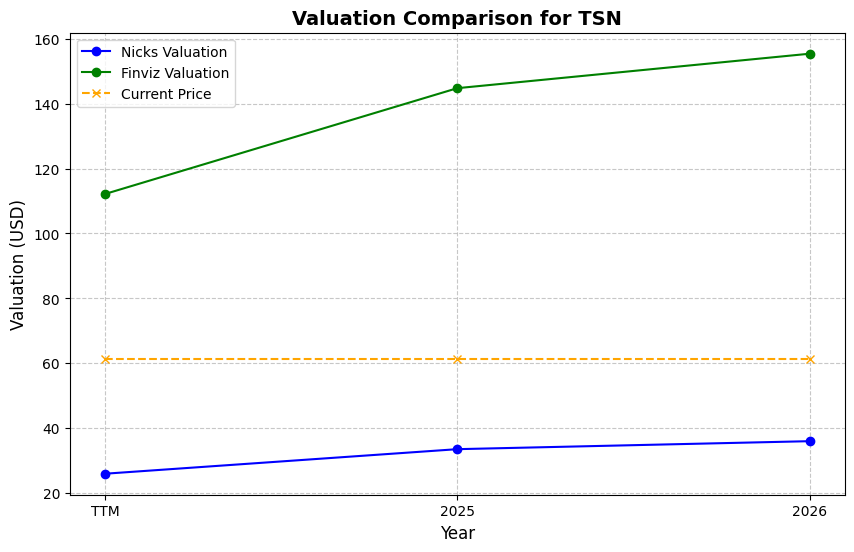
Valuation
| Share Price | Treasury Yield | Estimates | Fair Value (P/E) | Fair Value (P/S) | Current P/S | Current P/E |
|---|---|---|---|---|---|---|
| $61.02 | 4.5% | Nicks Growth: 3% Nick's Expected Margin: 5% FINVIZ Growth: 11% |
Nicks: 9 Finviz: 19 |
Nick's: 0.432 | 0.4 | 48.0 |
| Basis | Year | Nicks Valuation | Nicks vs Share Price | Finviz Valuation | Finviz vs Share Price |
|---|---|---|---|---|---|
| $1.27 EPS | TTM | $10.97 | -82.0% | $24.54 | -59.8% |
| $4.08 EPS | 2026 | $35.26 | -42.2% | $78.85 | 29.2% |
| $4.56 EPS | 2027 | $39.38 | -35.5% | $88.08 | 44.3% |
Implied Growth
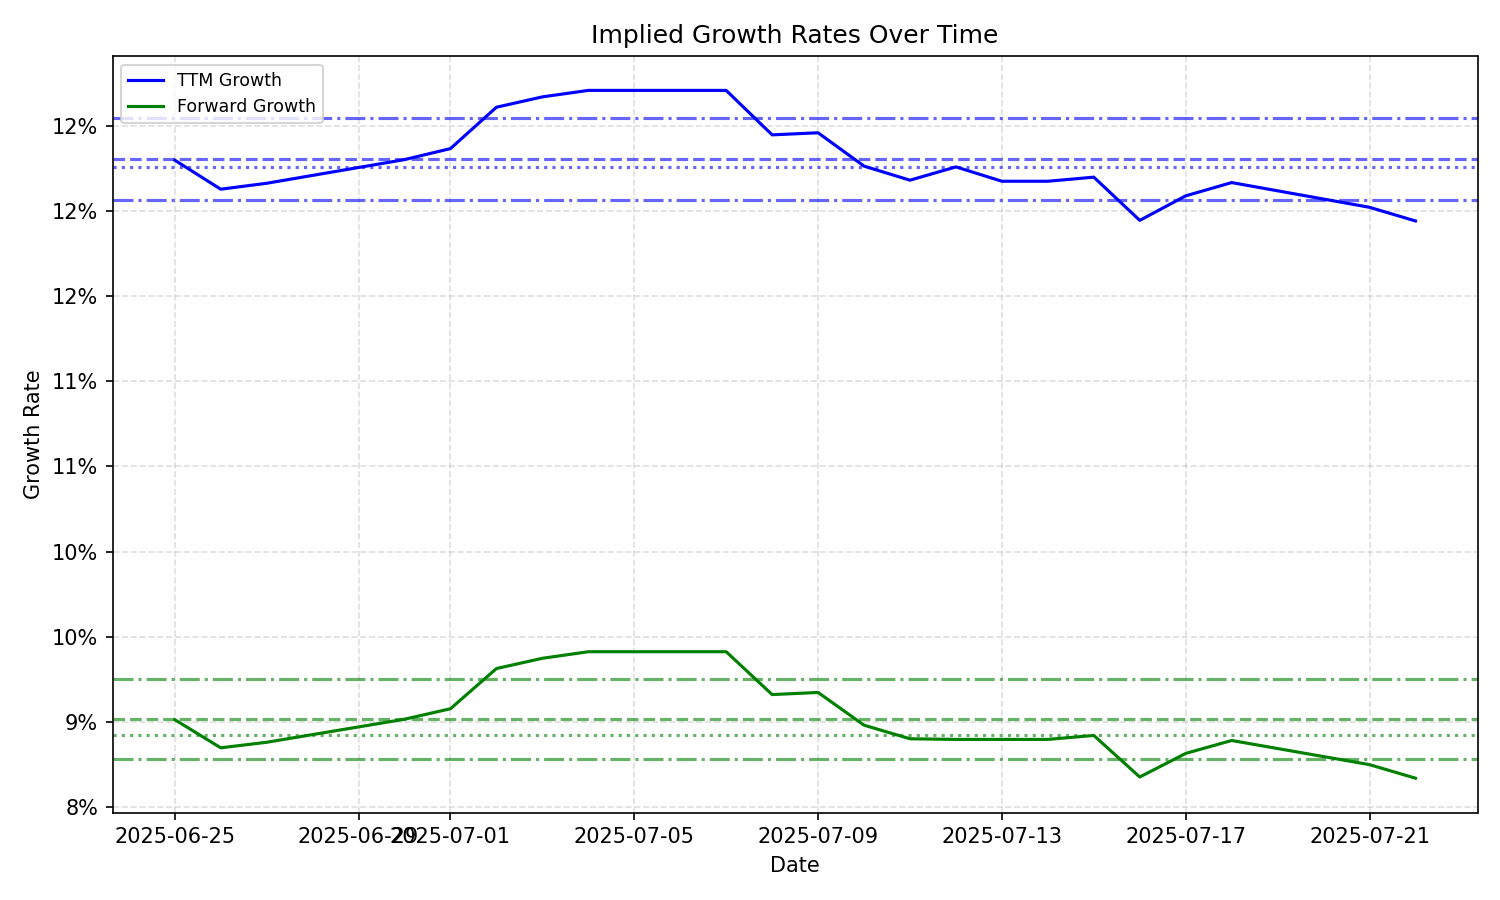
| Average | Median | Std Dev | Current | Percentile | ||||||
|---|---|---|---|---|---|---|---|---|---|---|
| TTM | Forward | TTM | Forward | TTM | Forward | TTM | Forward | TTM | Forward | |
| Timeframe | ||||||||||
| 1 Year | 20.12% | 8.40% | 19.01% | 8.37% | 7.88% | 0.59% | 21.64% | 7.58% | 64.3% | 9.4% |
| 3 Years | 20.12% | 8.40% | 19.01% | 8.37% | 7.88% | 0.59% | 21.64% | 7.58% | 64.3% | 9.4% |
| 5 Years | 20.12% | 8.40% | 19.01% | 8.37% | 7.88% | 0.59% | 21.64% | 7.58% | 64.3% | 9.4% |
| 10 Years | 20.12% | 8.40% | 19.01% | 8.37% | 7.88% | 0.59% | 21.64% | 7.58% | 64.3% | 9.4% |