Tesla, Inc. — TSLA
| Close Price | Market Cap | P/E Ratio | Forward P/E Ratio | Implied Growth* | Implied Forward Growth* | Dividend | P/B Ratio |
|---|---|---|---|---|---|---|---|
| $435.79 | $1.64T | 392.6 | 173.6 | 48.8% | 37.5% | - | 19.9 |
Latest Headlines
- · Stock Market Today, May 29: Rivian Automotive Jumps on R2 SUV Launch Confirmation
- · Why GM Stock Is Rising Even Though The Car Industry Is Shrinking
- · How Safe Is a Tesla Robo-Taxi?
- · Dow Jones Futures: Market Hits Highs On Iran Hopes; Nvidia, Tesla Lead 5 Trillion-Dollar Stocks Near Buy Points
- · 'Volatility equals opportunity' in options trades as tech soars
- · Waymo Unveils Ojai Robotaxi As Driverless Race Heats Up
Revenue & Net Income
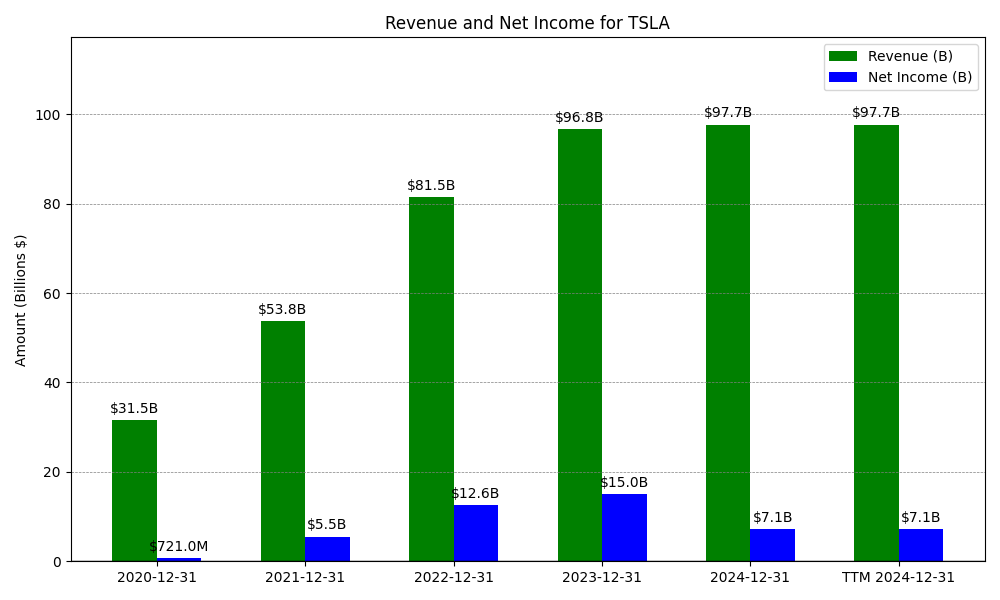
| Date | Revenue | Net_Income | EPS | Last_Updated | Revenue_Change | Net_Income_Change | EPS_Change | |
|---|---|---|---|---|---|---|---|---|
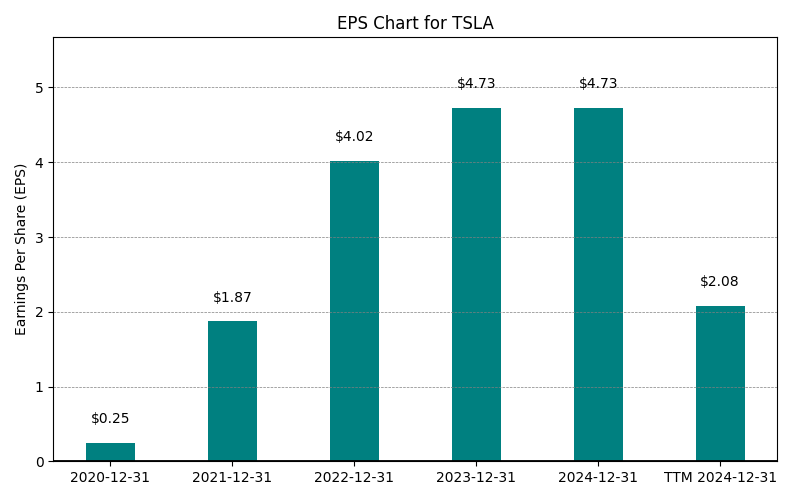
| 0 | 2020-12-31 | $31,536M | $721M | $0.25 | 2024-02-03 03:17:10 | N/A | N/A | N/A |
| 1 | 2021-12-31 | $53,823M | $5,524M | $1.87 | 2024-02-03 03:17:10 | 70.7% | 666.2% | 658.1% |
| 2 | 2022-12-31 | $81,462M | $12,583M | $4.02 | 2026-05-29 09:15:15 | 51.4% | 127.8% | 115.0% |
| 3 | 2023-12-31 | $96,773M | $14,999M | $4.73 | 2026-05-29 09:15:15 | 18.8% | 19.2% | 17.6% |
| 4 | 2024-12-31 | $97,690M | $7,130M | $2.23 | 2026-05-29 09:15:15 | 0.9% | -52.5% | -52.8% |
| 5 | 2025-12-31 | $94,827M | $3,794M | $1.18 | 2026-05-29 09:15:15 | -2.9% | -46.8% | -47.2% |
| 6 | TTM 2026-03-31 | $97,879M | $3,862M | $1.11 | 2026-04-27 08:59:47 | 3.2% | 1.8% | -5.7% |
EPS
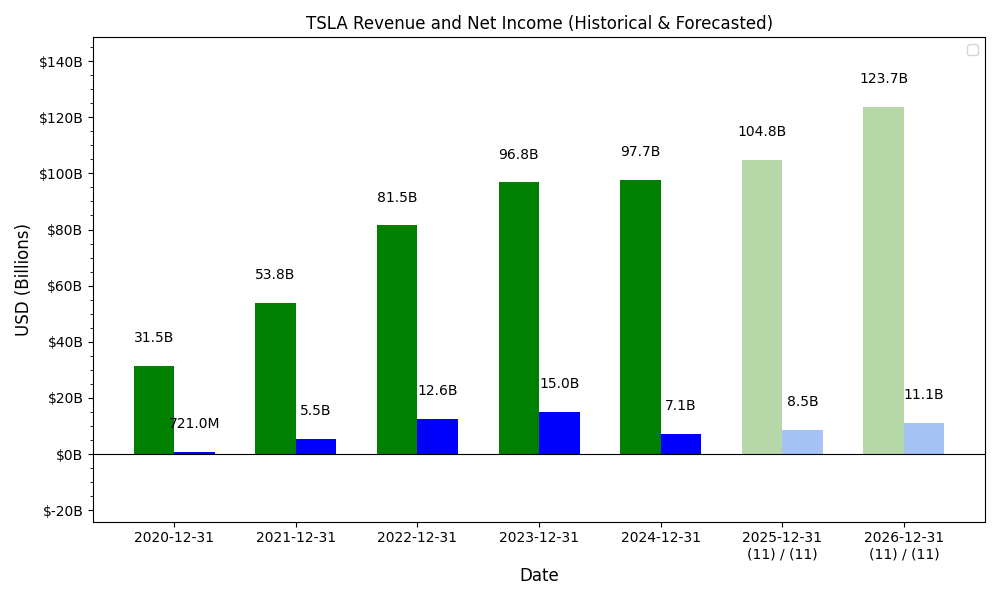
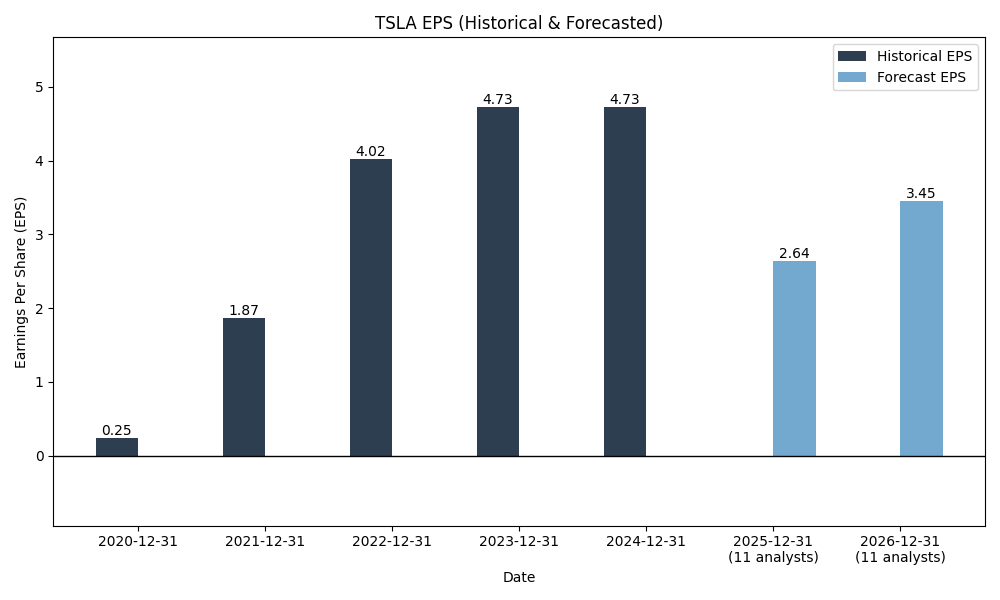
Forecasts
Y/Y % Change
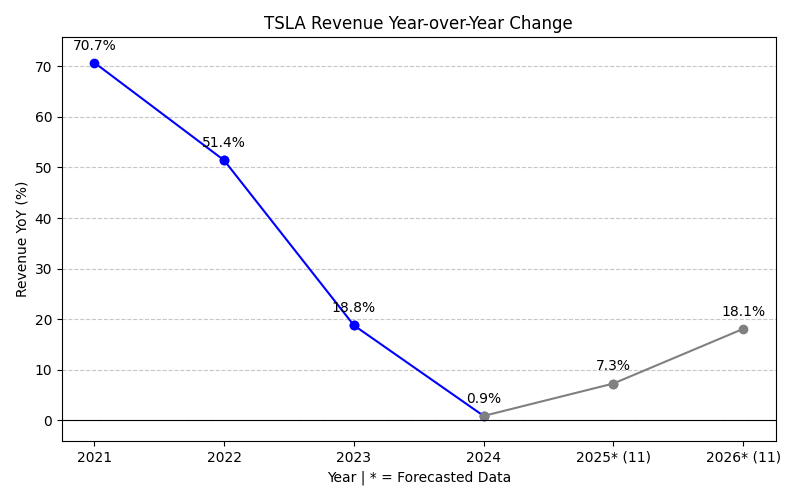
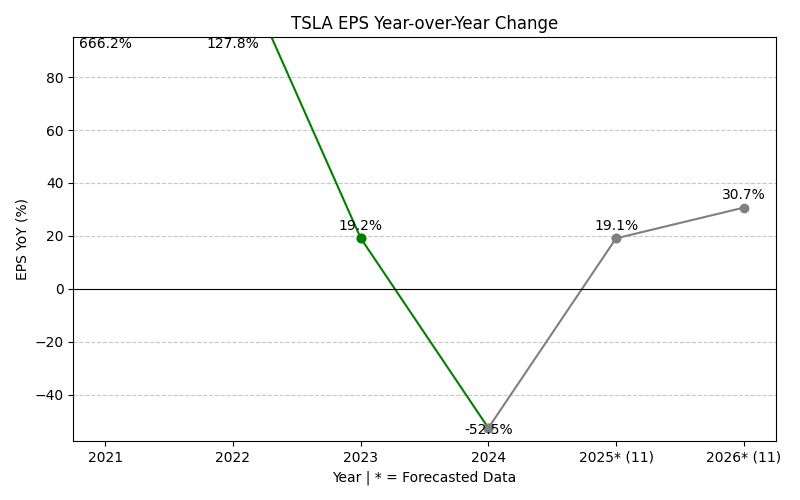
TSLA Year-over-Year Growth
| 2020 | 2021 | 2022 | 2023 | 2024 | 2025 | 2026 | 2027 | Average | |
|---|---|---|---|---|---|---|---|---|---|
| Revenue Growth (%) | 70.7% | 51.4% | 18.8% | 0.9% | -2.9% | 7.9% | 15.5% | 23.2% | |
| Revenue Analysts (#) | 0 | 0 | 0 | 0 | 0 | 0 | 45 | 45 | |
| EPS Growth (%) | 666.2% | 127.8% | 19.2% | -52.5% | -46.8% | 102.8% | 22.5% | 119.9% | |
| EPS Analysts (#) | 0 | 0 | 0 | 0 | 0 | 0 | 34 | 30 |
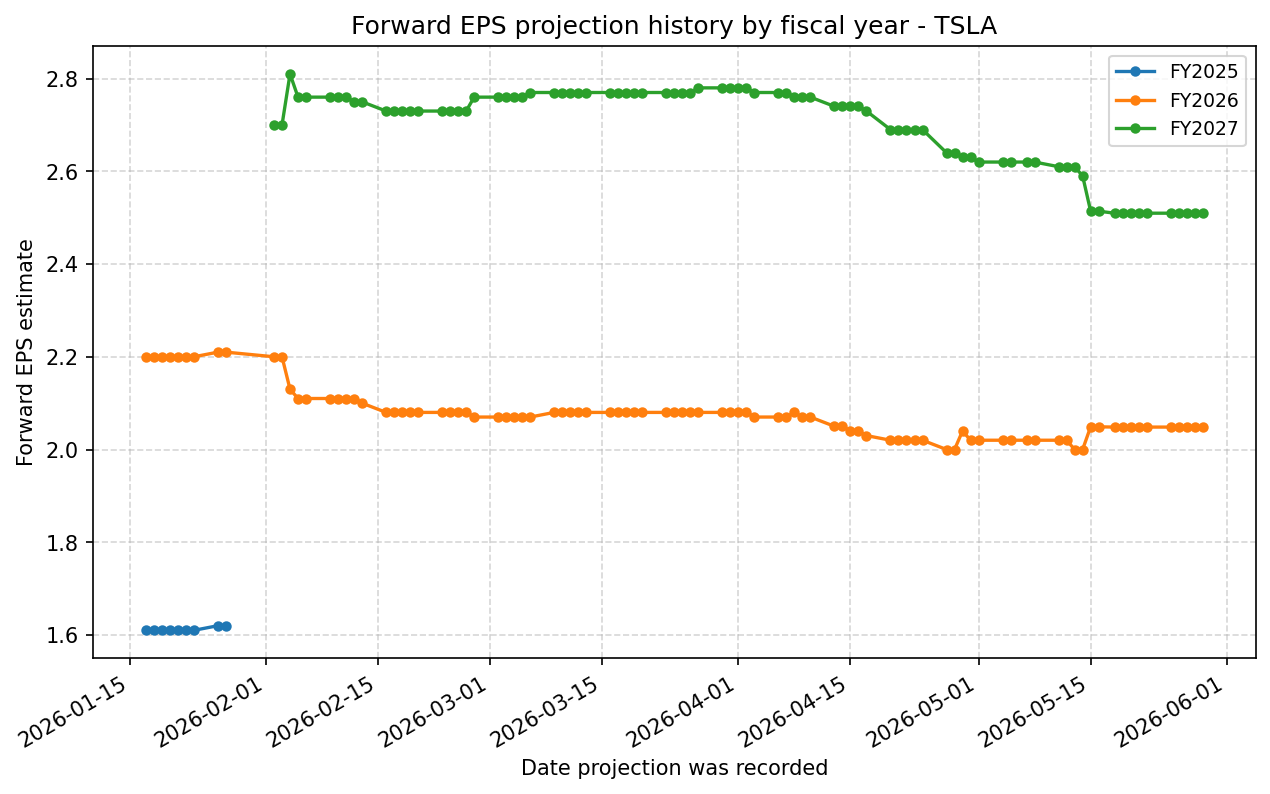
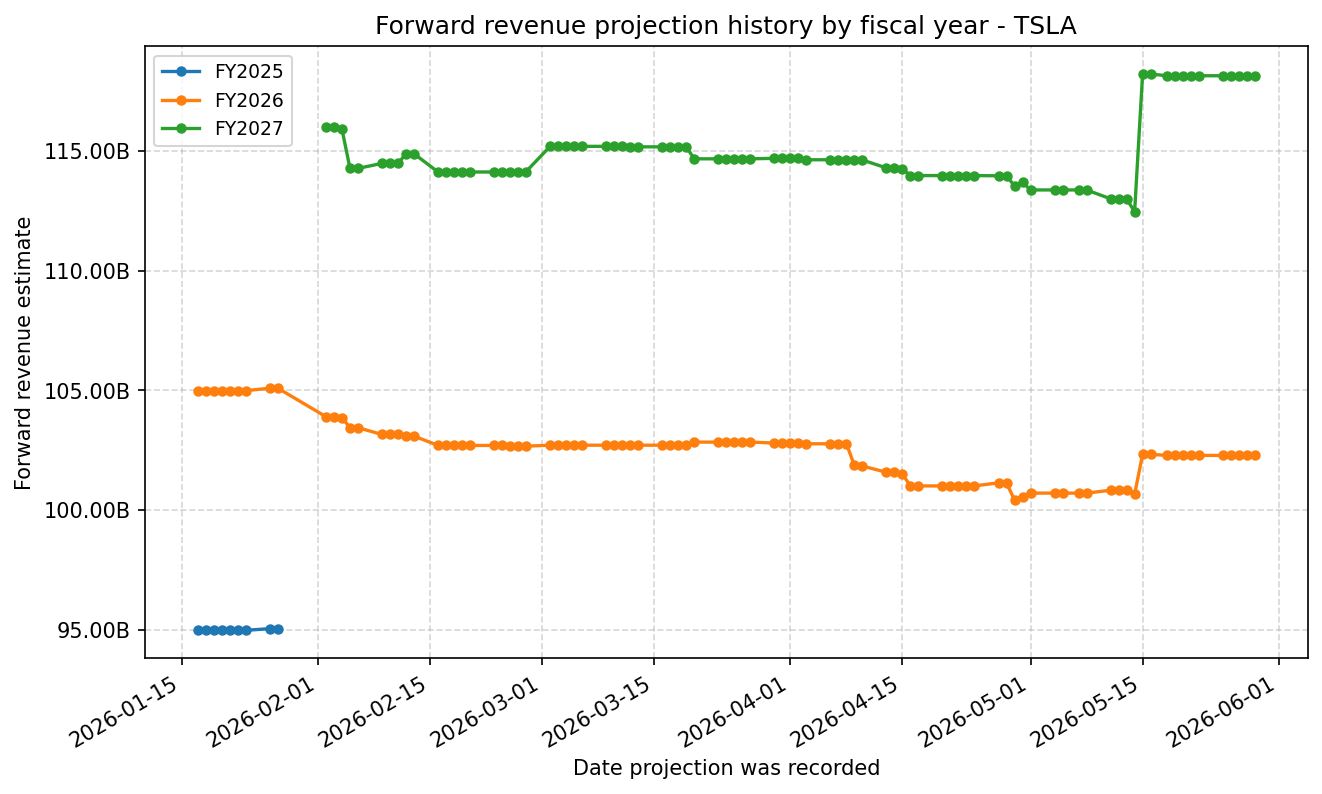
Forward Estimate History
How the next-FY EPS and revenue estimates have drifted over time. One line per fiscal year – past lines end when that FY became current.
Expenses
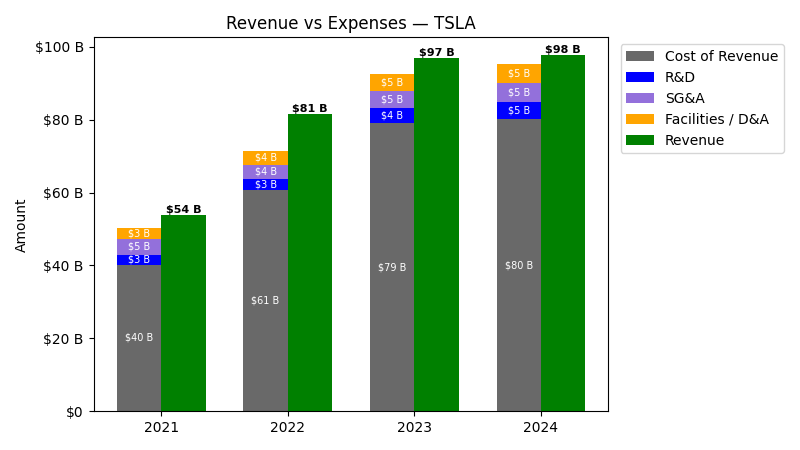
| Year | Revenue ($) | Cost of Revenue ($) | R&D ($) | SG&A ($) | Facilities / D&A ($) |
|---|---|---|---|---|---|
| 2022 | $81.5B | $56.9B | $3.1B | $3.9B | $3.7B |
| 2023 | $96.8B | $74.4B | $4.0B | $4.8B | $4.7B |
| 2024 | $97.7B | $74.9B | $4.5B | $5.2B | $5.4B |
| 2025 | $94.8B | $71.6B | $6.4B | $5.8B | $6.1B |
| TTM | $97.9B | $72.9B | $6.9B | $6.4B | $6.3B |
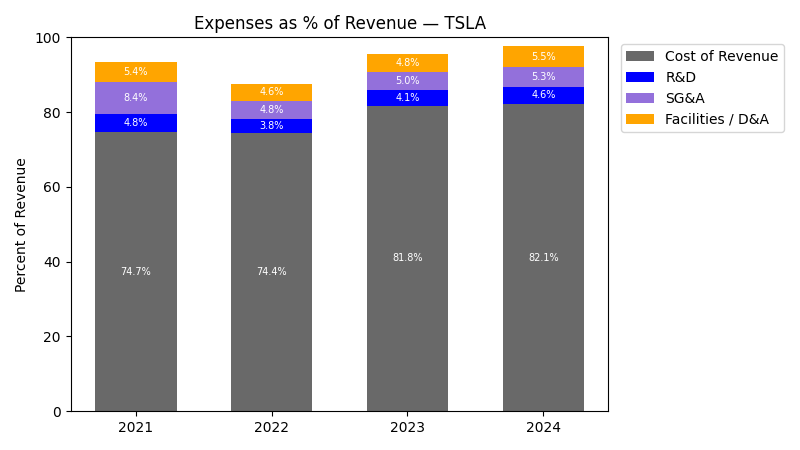
| Year | Revenue Change (%) | Cost of Revenue Change (%) | R&D Change (%) | SG&A Change (%) | Facilities / D&A Change (%) |
|---|---|---|---|---|---|
| 2023 | 18.80 | 30.92 | 29.07 | 21.64 | 24.55 |
| 2024 | 0.95 | 0.57 | 14.39 | 7.29 | 15.02 |
| 2025 | -2.93 | -4.39 | 41.21 | 13.28 | 14.53 |
| TTM | 3.22 | 1.87 | 8.38 | 9.98 | 2.33 |
No unmapped expenses.
Segment Performance
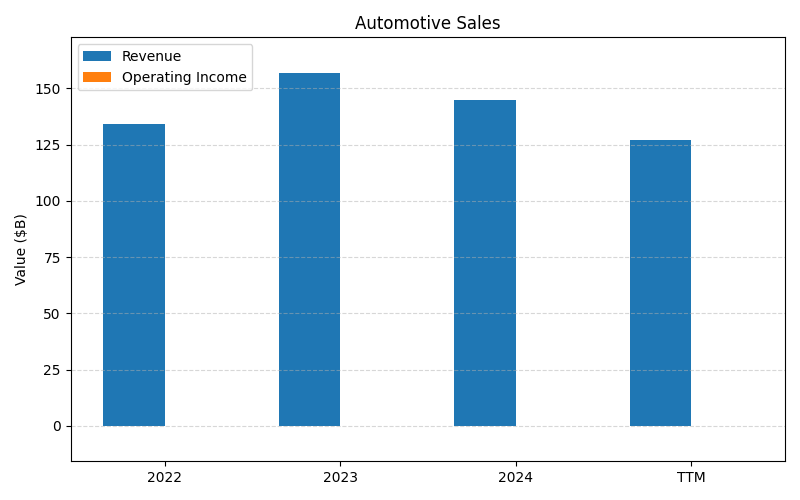
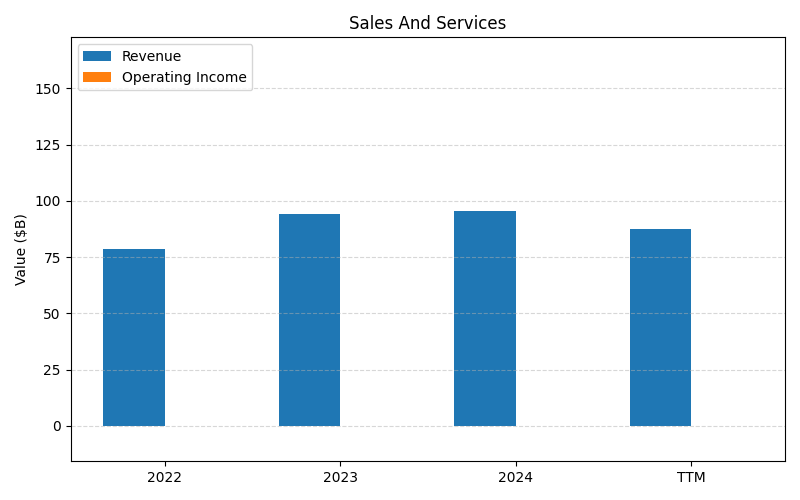
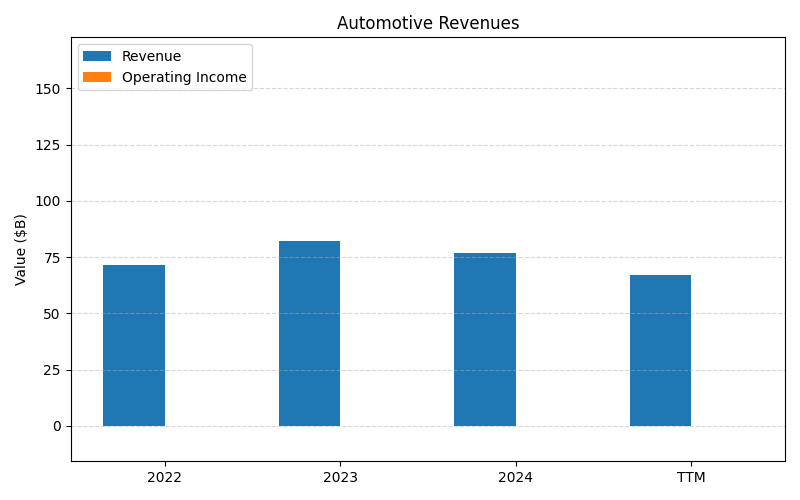
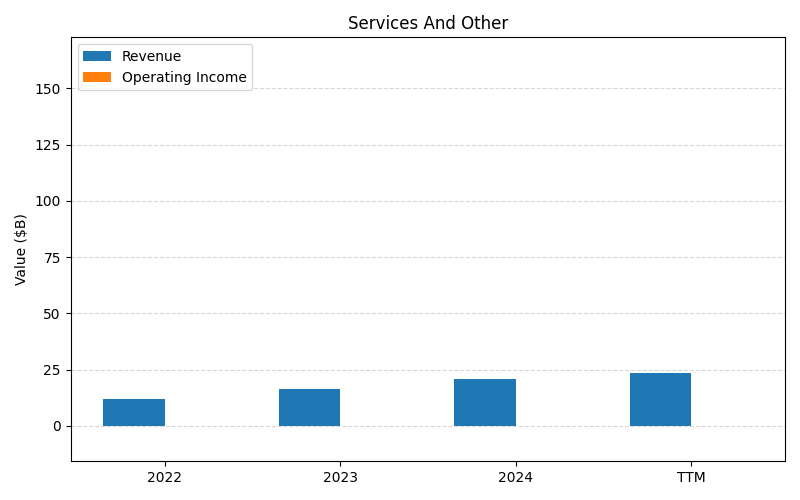
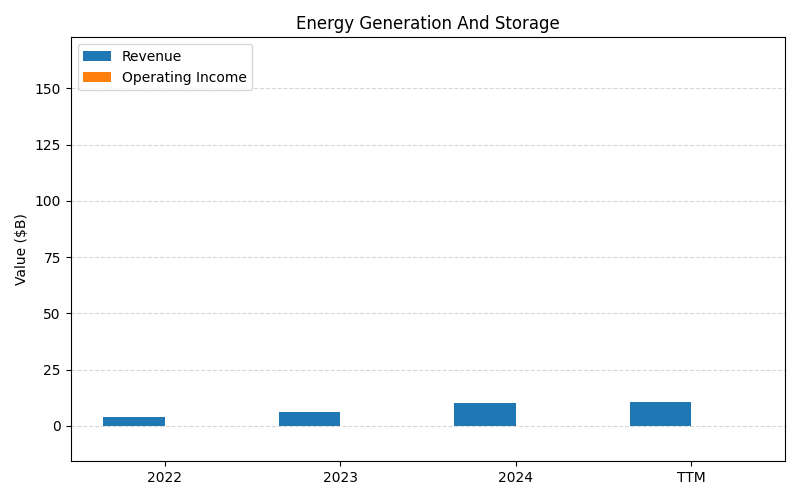
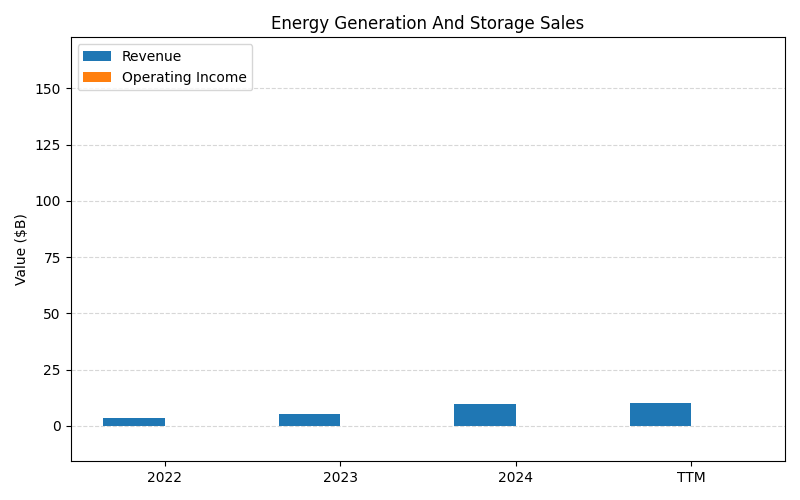
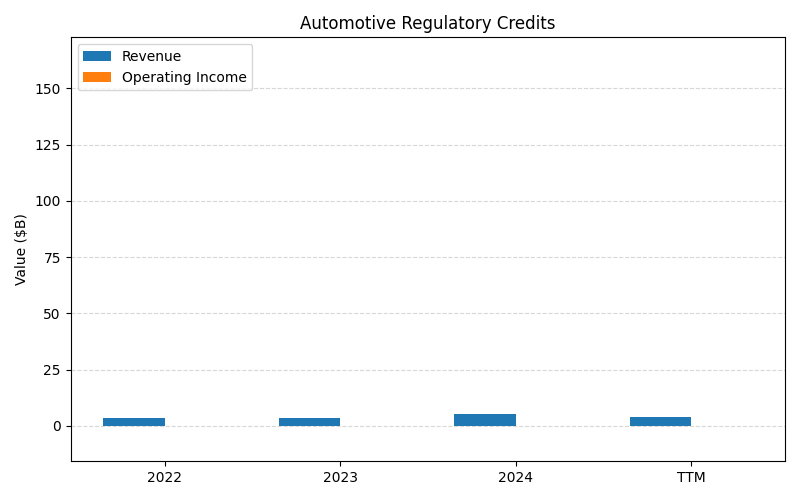
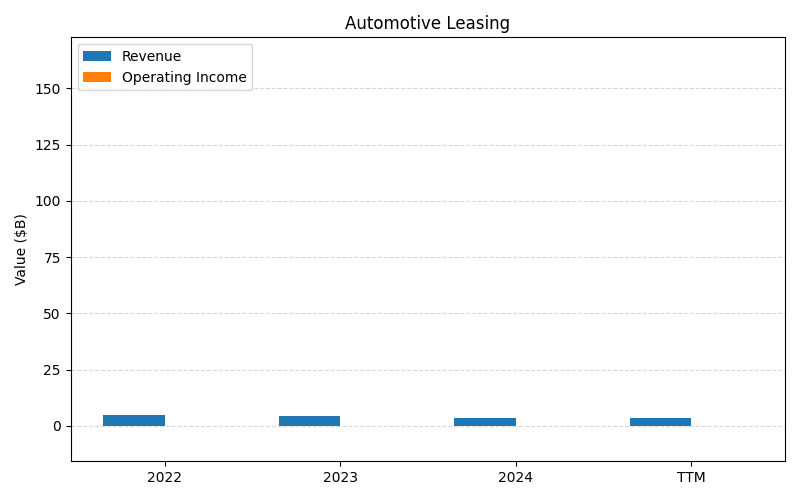
SEGMENTS v2025-09-09 · 2026-05-29 09:15 UTC — Units: $B. Rows list fiscal years (last 3 + TTM) with revenue for each segment; the final row shows the TTM revenue mix (operating income columns display “—” where mix is not applicable).
| Year | Automotive Sales Rev | Sales And Services Rev | Automotive Revenues Rev | Services And Other Rev | Energy Generation And Storage Rev | Energy Generation And Storage Sales Rev | Automotive Regulatory Credits Rev | Automotive Leasing Rev | Energy Generation And Storage Leasing Rev | Total Rev |
|---|---|---|---|---|---|---|---|---|---|---|
| 2023 | 157B | 94.1B | 82.4B | 16.6B | 6.04B | 5.51B | 3.58B | 4.24B | 0.52B | 370.1B |
| 2024 | 145B | 95.3B | 77.1B | 21.1B | 10.1B | 9.56B | 5.53B | 3.65B | 0.52B | 367.8B |
| 2025 | 131.6B | 92.6B | 69.5B | 25.1B | 12.8B | 12.3B | 3.99B | 3.42B | 0.50B | 351.8B |
| TTM | 333.4B | 228.6B | 176.8B | 58.9B | 28B | 26.8B | 11.5B | 8.73B | 1.24B | 873.9B |
| % of Total (TTM) | 38.2% | 26.2% | 20.2% | 6.7% | 3.2% | 3.1% | 1.3% | 1.0% | 0.1% | 100% |
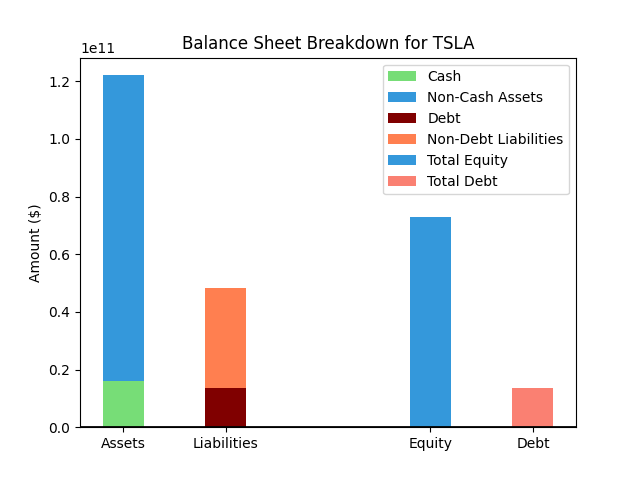
Balance Sheet
| Metric | Value | |
|---|---|---|
| 0 | Total Assets | $143,724M |
| 1 | Cash | $16,603M |
| 2 | Total Liabilities | $58,922M |
| 3 | Total Debt | $15,890M |
| 4 | Total Equity | $84,116M |
| 5 | Debt to Equity Ratio | 0.19 |
EPS & Dividend

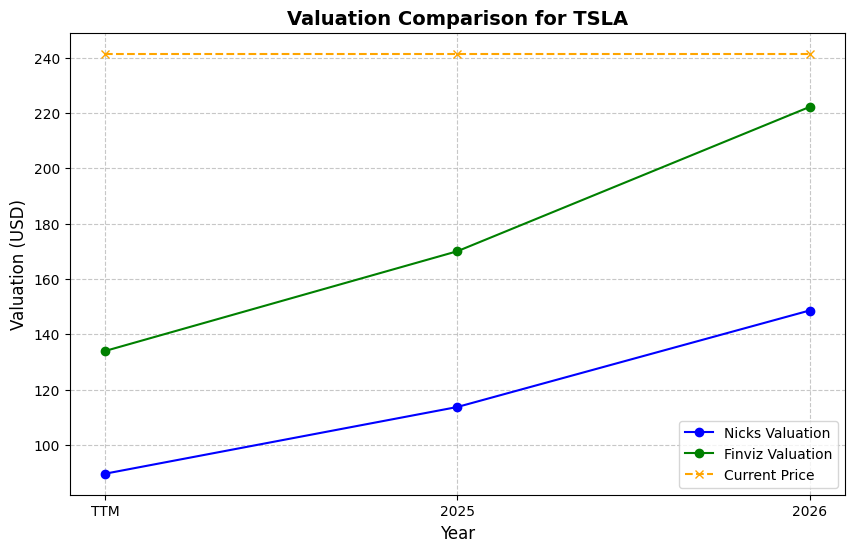
Valuation
| Share Price | Treasury Yield | Estimates | Fair Value (P/E) | Fair Value (P/S) | Current P/S | Current P/E |
|---|---|---|---|---|---|---|
| $435.79 | 4.5% | Nicks Growth: 15% Nick's Expected Margin: 8% FINVIZ Growth: 25% |
Nicks: 27 Finviz: 63 |
Nick's: 2.181 | 16.7 | 392.6 |
| Basis | Year | Nicks Valuation | Nicks vs Share Price | Finviz Valuation | Finviz vs Share Price |
|---|---|---|---|---|---|
| $1.11 EPS | TTM | $30.25 | -93.1% | $69.75 | -84.0% |
| $2.05 EPS | 2026 | $55.83 | -87.2% | $128.71 | -70.5% |
| $2.51 EPS | 2027 | $68.41 | -84.3% | $157.70 | -63.8% |
Implied Growth
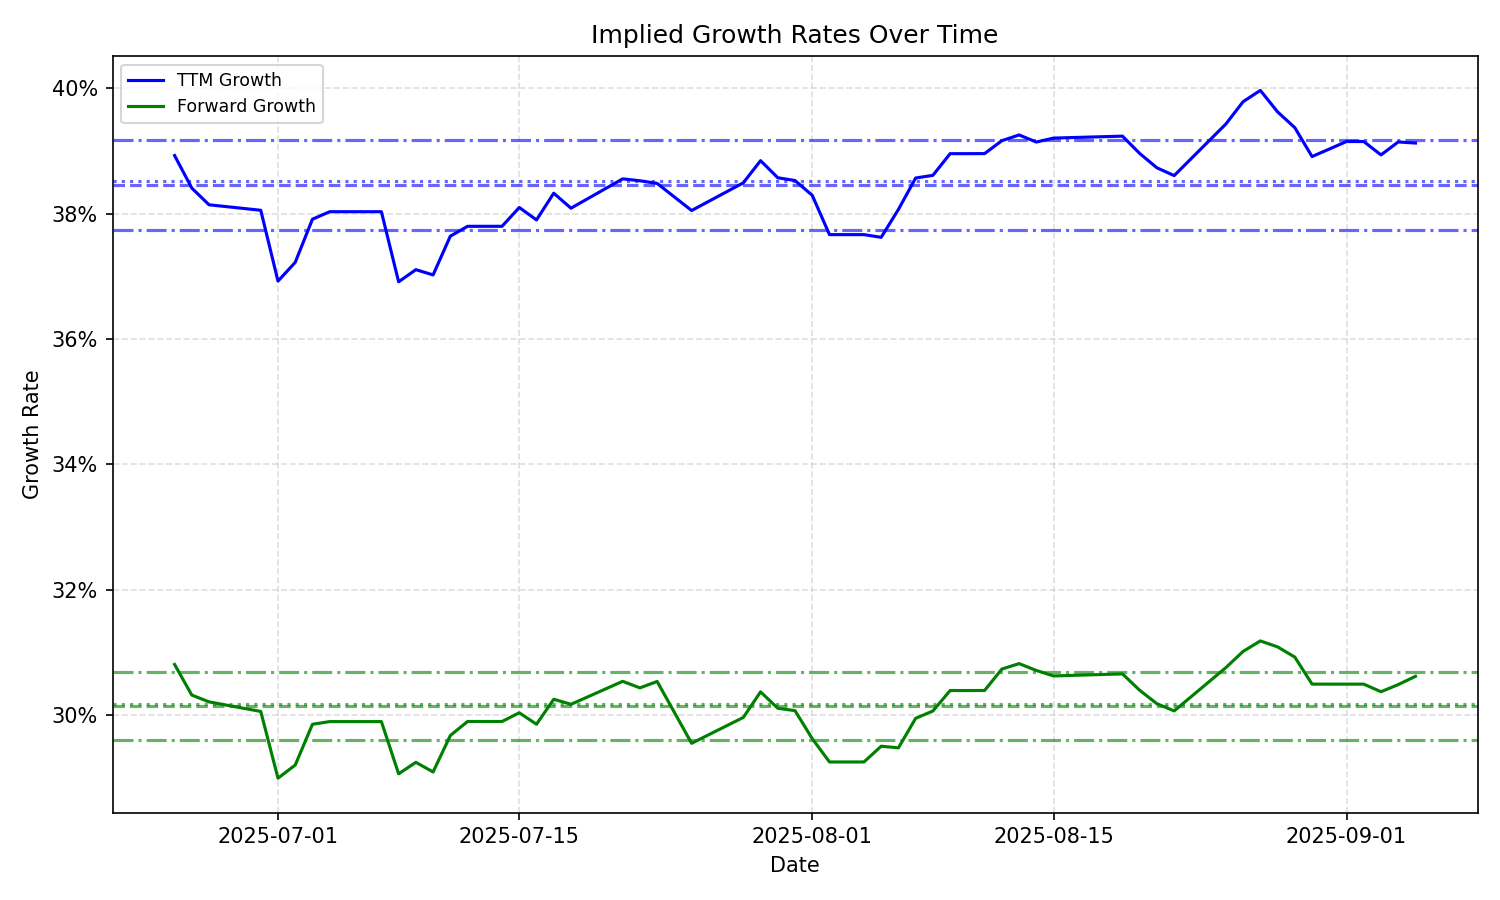
| Average | Median | Std Dev | Current | Percentile | ||||||
|---|---|---|---|---|---|---|---|---|---|---|
| TTM | Forward | TTM | Forward | TTM | Forward | TTM | Forward | TTM | Forward | |
| Timeframe | ||||||||||
| 1 Year | 43.76% | 33.90% | 44.79% | 33.90% | 3.66% | 2.92% | 49.01% | 37.68% | 97.5% | 86.4% |
| 3 Years | 43.76% | 33.90% | 44.79% | 33.90% | 3.66% | 2.92% | 49.01% | 37.68% | 97.5% | 86.4% |
| 5 Years | 43.76% | 33.90% | 44.79% | 33.90% | 3.66% | 2.92% | 49.01% | 37.68% | 97.5% | 86.4% |
| 10 Years | 43.76% | 33.90% | 44.79% | 33.90% | 3.66% | 2.92% | 49.01% | 37.68% | 97.5% | 86.4% |