Target Corporation — TGT
| Close Price | Market Cap | P/E Ratio | Forward P/E Ratio | Implied Growth* | Implied Forward Growth* | Dividend | P/B Ratio |
|---|---|---|---|---|---|---|---|
| $127.07 | $57.71B | 16.8 | 14.3 | 9.8% | 8.1% | $4.56 3.6% | 3.6 |
Latest Headlines
- · Your favorite cereal is about to leave Target's shelves
- · Costco’s Premium Valuation Makes More Sense Than You Think
- · Click Holdings Limited (CLIK) Acquires Hong Kong Construction HR Tech Company, Targeting Over HK$50 Million Annual Revenue in New Segment Within Two Years
- · 3 Value Stocks We Approach with Caution
- · Walmart and 5 More Consumer Stocks to Buy After a Solid Retail Earnings Season
- · Costco Tops Sales Views But Earnings, Membership Numbers Fall Short
Revenue & Net Income
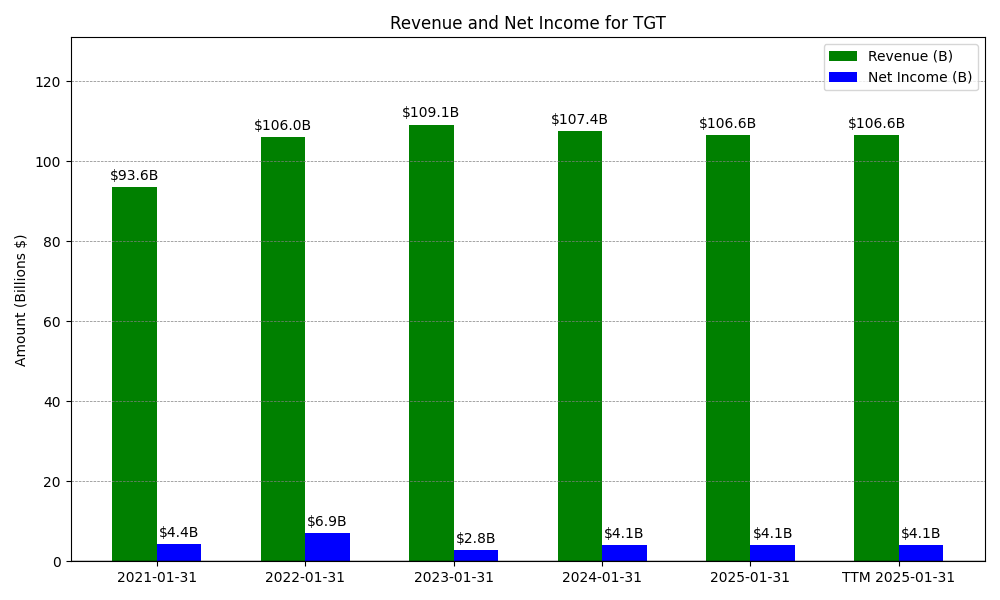
| Date | Revenue | Net_Income | EPS | Last_Updated | Revenue_Change | Net_Income_Change | EPS_Change | |
|---|---|---|---|---|---|---|---|---|
| 0 | 2020-01-31 | $nanM | $nanM | $nan | 2024-05-25 08:21:34 | N/A | N/A | N/A |
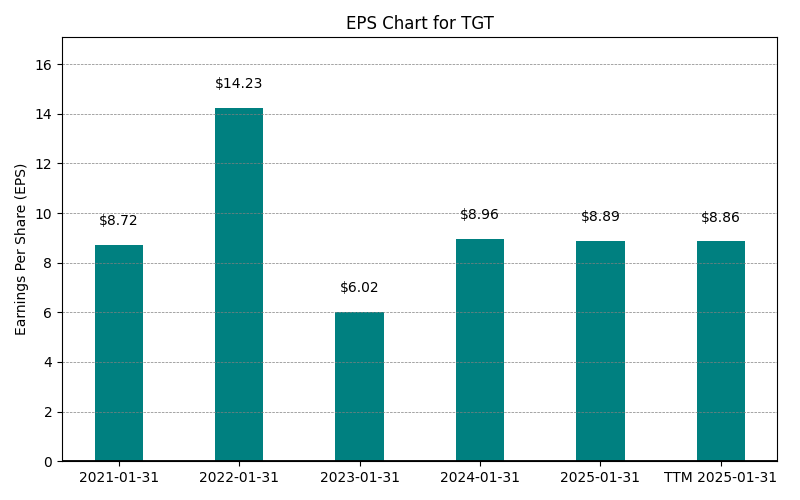
| 1 | 2021-01-31 | $93,561M | $4,368M | $8.72 | 2024-02-09 04:07:25 | N/A | N/A | N/A |
| 2 | 2022-01-31 | $106,005M | $6,946M | $6.02 | 2026-03-16 08:57:19 | 13.3% | 59.0% | -31.0% |
| 3 | 2023-01-31 | $109,120M | $2,780M | $6.02 | 2026-05-29 09:15:08 | 2.9% | -60.0% | 0.0% |
| 4 | 2024-01-31 | $107,412M | $4,138M | $8.96 | 2026-05-29 09:15:08 | -1.6% | 48.8% | 48.8% |
| 5 | 2025-01-31 | $106,566M | $4,091M | $8.89 | 2026-05-29 09:15:08 | -0.8% | -1.1% | -0.8% |
| 6 | 2026-01-31 | $104,780M | $3,705M | $8.16 | 2026-05-29 09:15:08 | -1.7% | -9.4% | -8.2% |
| 7 | TTM 2026-04-30 | $80,934M | $2,669M | $7.59 | 2026-05-22 09:12:41 | -22.8% | -28.0% | -7.0% |
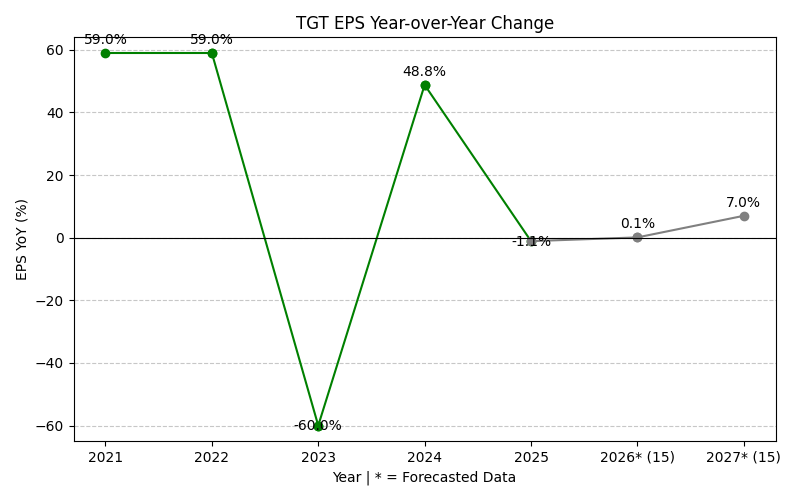
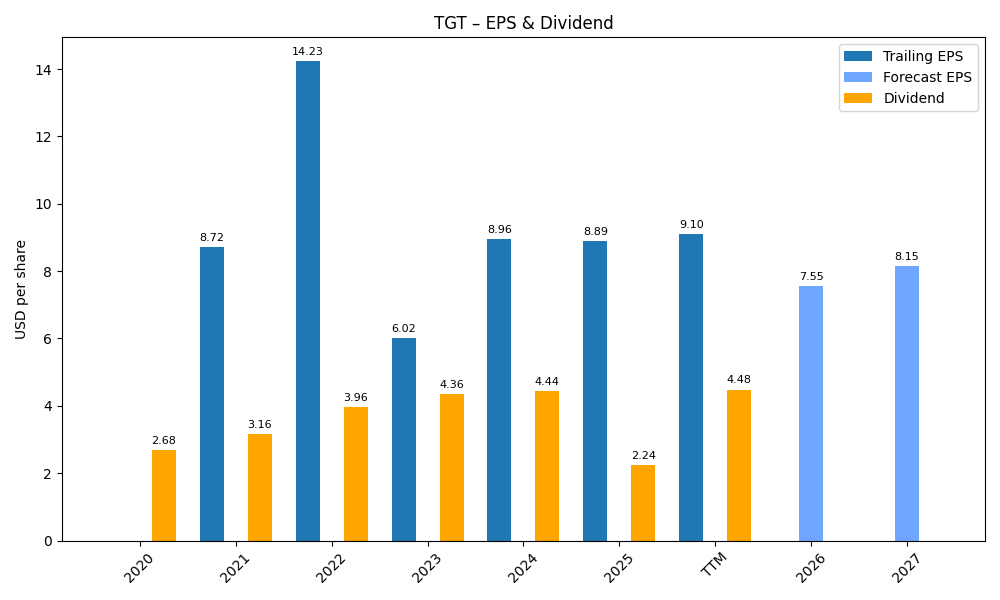
EPS
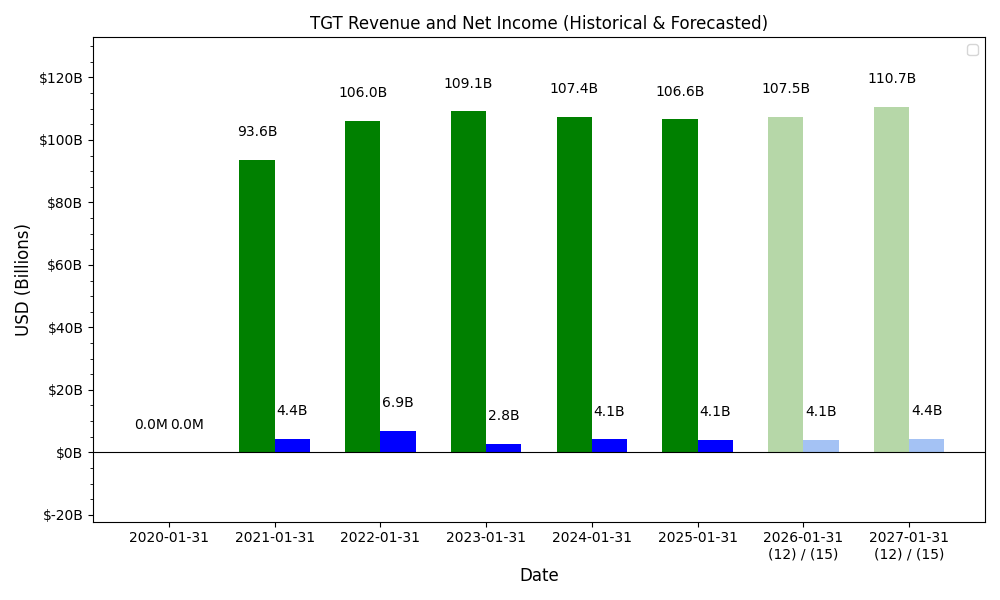
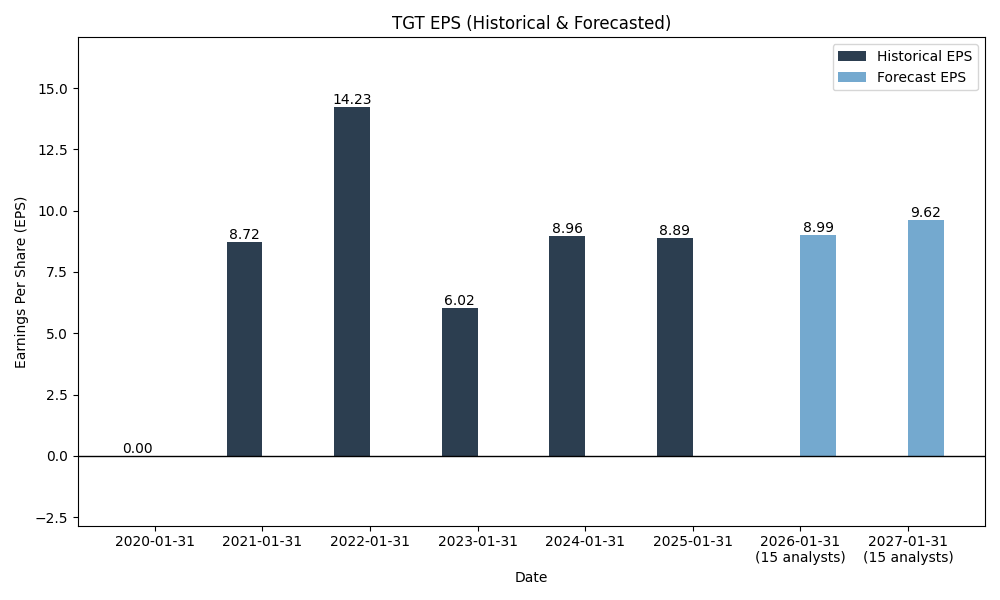
Forecasts
Y/Y % Change
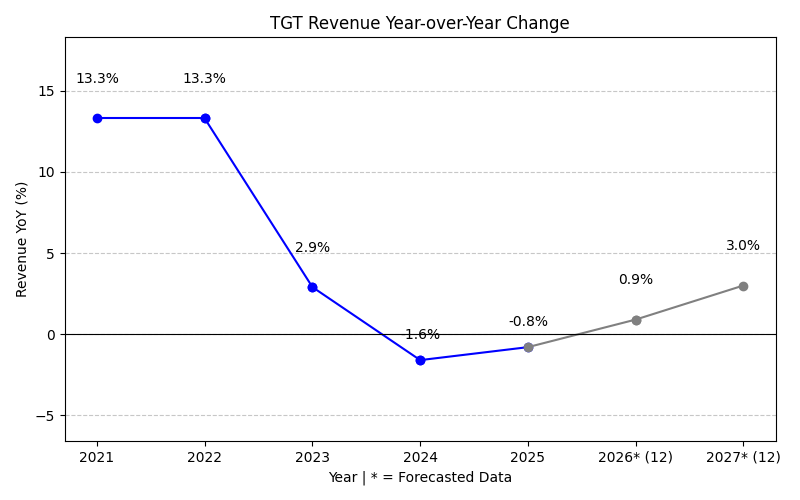
TGT Year-over-Year Growth
| 2020 | 2021 | 2022 | 2023 | 2024 | 2025 | 2026 | 2027 | 2028 | Average | |
|---|---|---|---|---|---|---|---|---|---|---|
| Revenue Growth (%) | inf% | 13.3% | 2.9% | -1.6% | -0.8% | -1.7% | 3.9% | 2.9% | inf% | |
| Revenue Analysts (#) | 0 | 0 | 0 | 0 | 0 | 0 | 0 | 34 | 36 | |
| EPS Growth (%) | inf% | 59.0% | -60.0% | 48.8% | -1.1% | -9.4% | 2.2% | 6.7% | inf% | |
| EPS Analysts (#) | 0 | 0 | 0 | 0 | 0 | 0 | 0 | 36 | 36 |
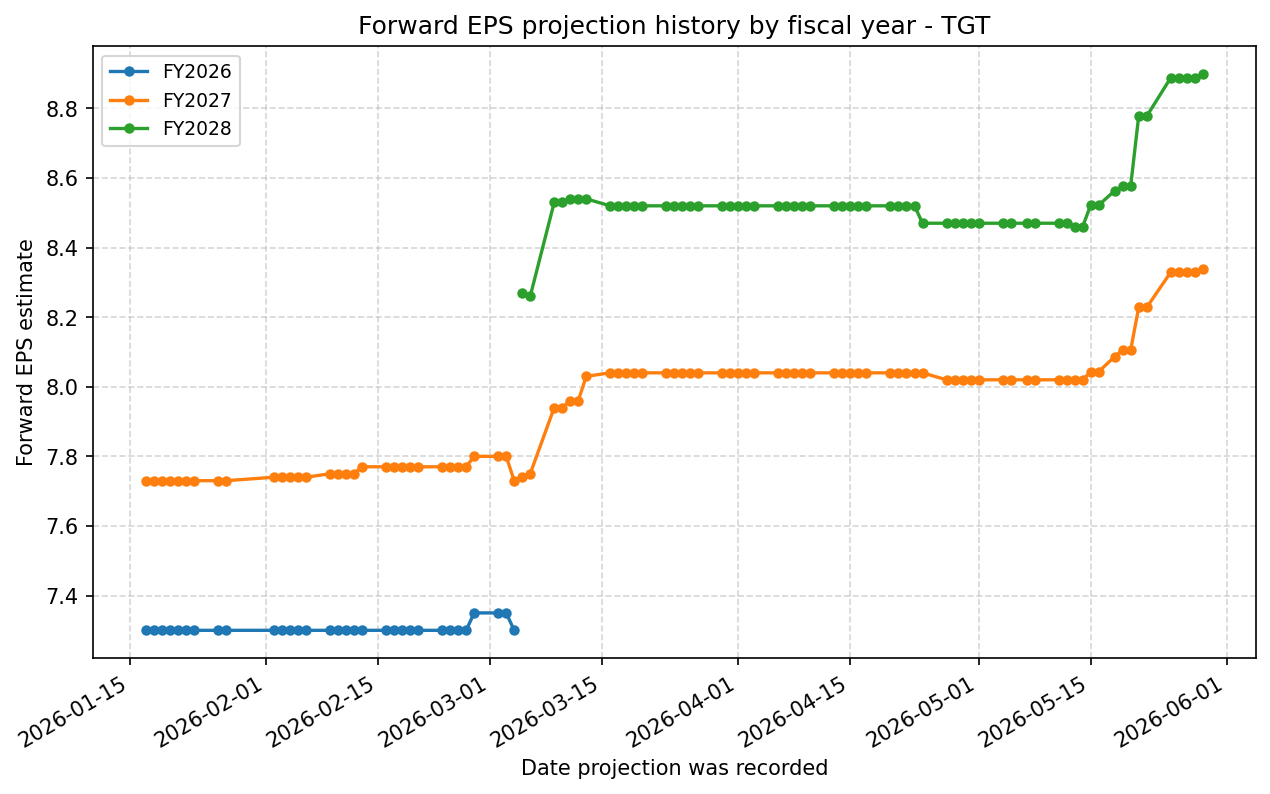
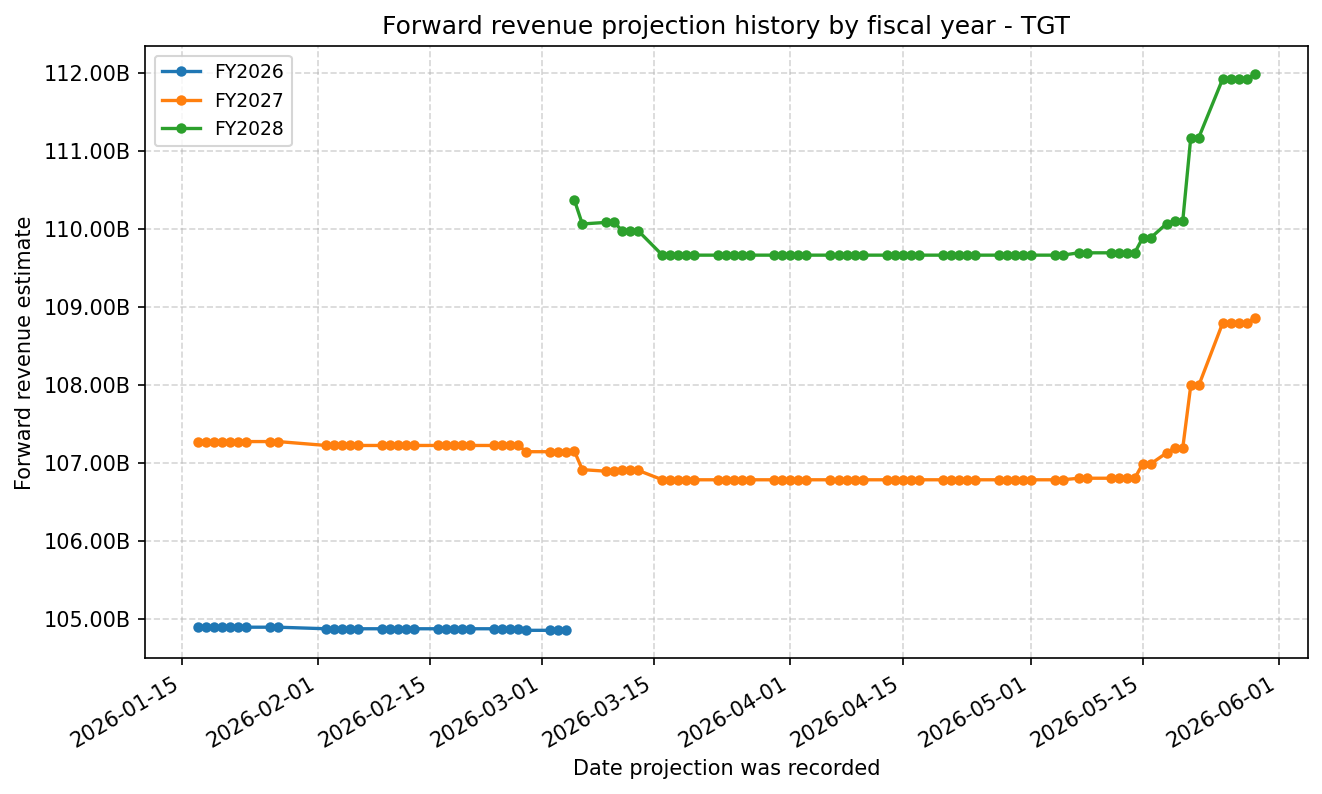
Forward Estimate History
How the next-FY EPS and revenue estimates have drifted over time. One line per fiscal year – past lines end when that FY became current.
Expenses
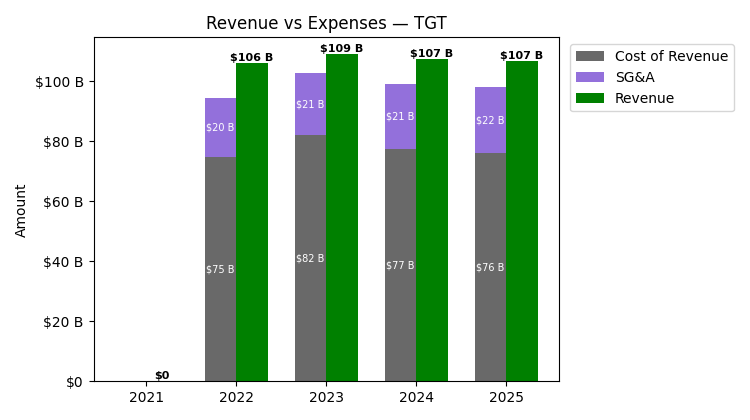
| Year | Revenue ($) | Cost of Revenue ($) | SG&A ($) | Facilities / D&A ($) |
|---|---|---|---|---|
| 2023 | $109.1B | $79.3B | $20.6B | $2.7B |
| 2024 | $107.4B | $74.6B | $21.5B | $2.8B |
| 2025 | $106.6B | $73.1B | $22.0B | $3.0B |
| 2026 | $104.8B | $71.9B | $21.5B | $3.1B |
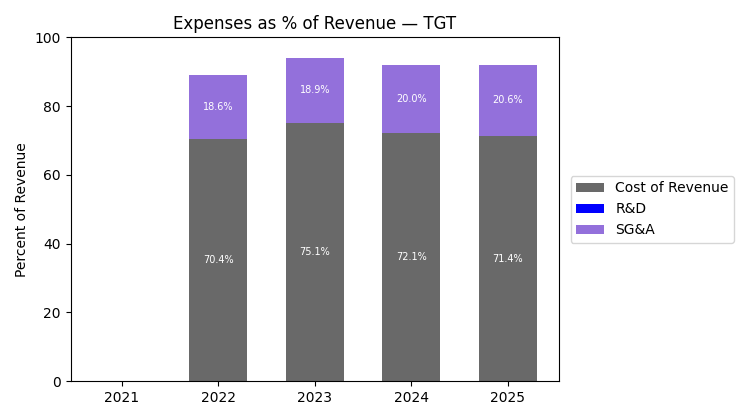
| Year | Revenue Change (%) | Cost of Revenue Change (%) | SG&A Change (%) | Facilities / D&A Change (%) |
|---|---|---|---|---|
| 2024 | -1.57 | -5.86 | 4.28 | 3.74 |
| 2025 | -0.79 | -2.11 | 2.36 | 6.43 |
| 2026 | -1.68 | -1.65 | -1.98 | 5.13 |
No unmapped expenses.
Segment Performance
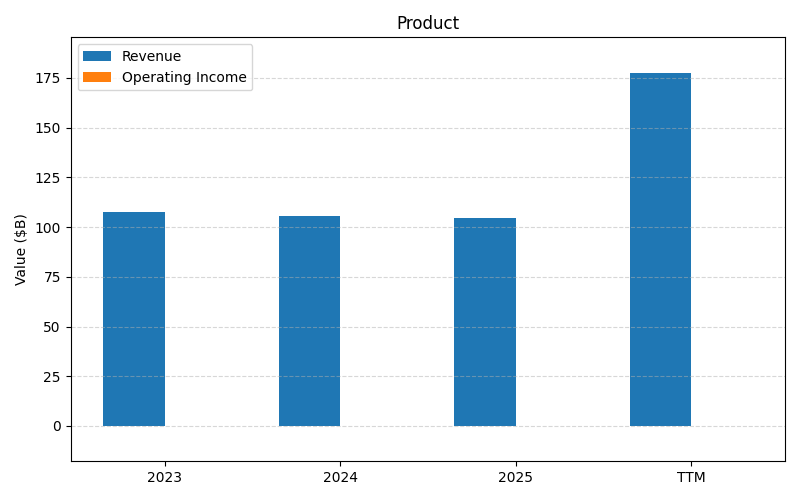
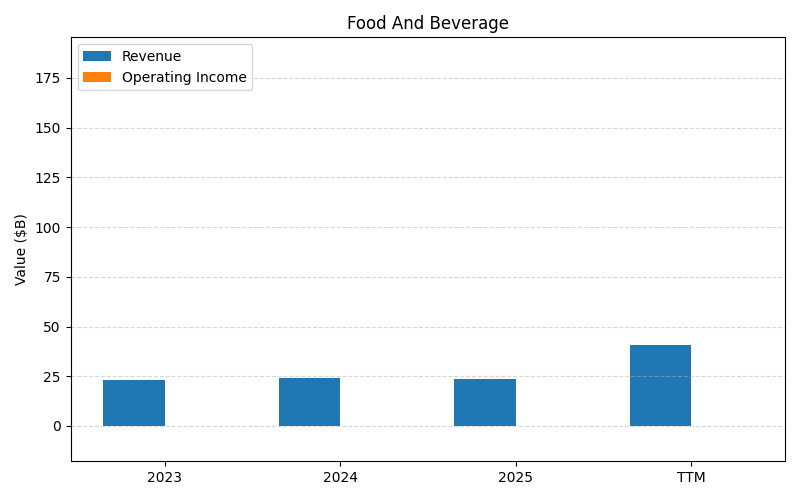
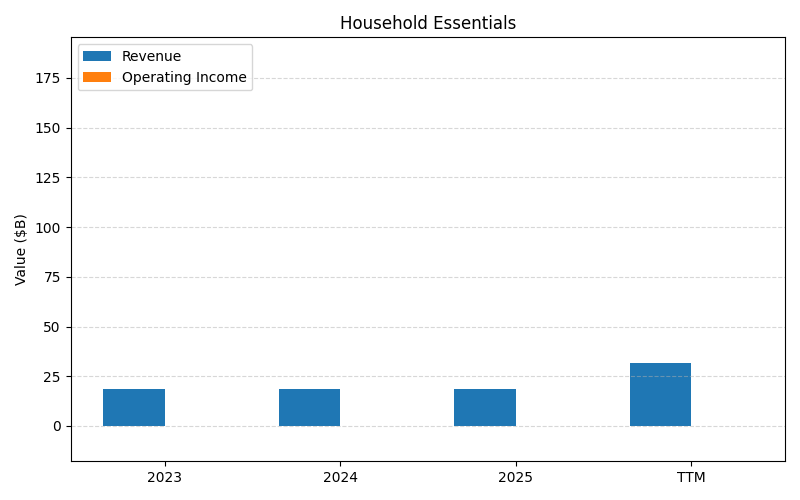
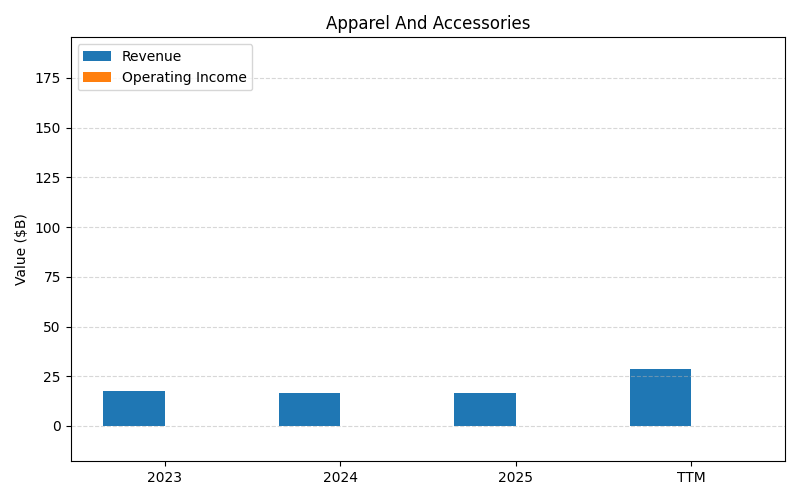
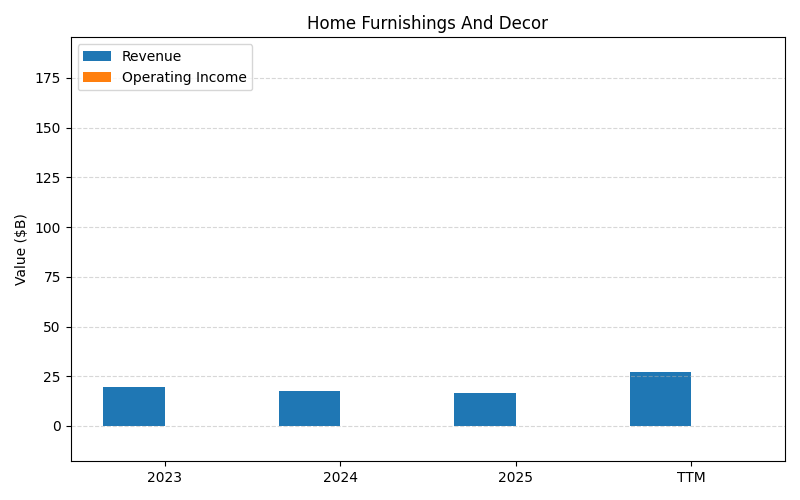
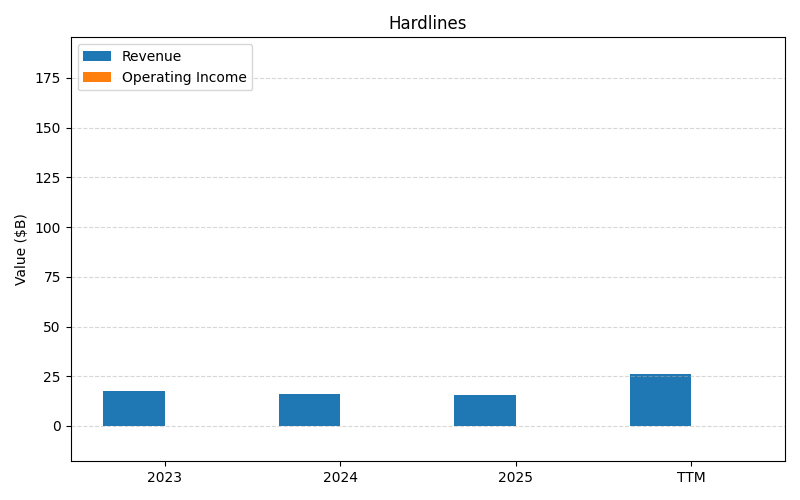
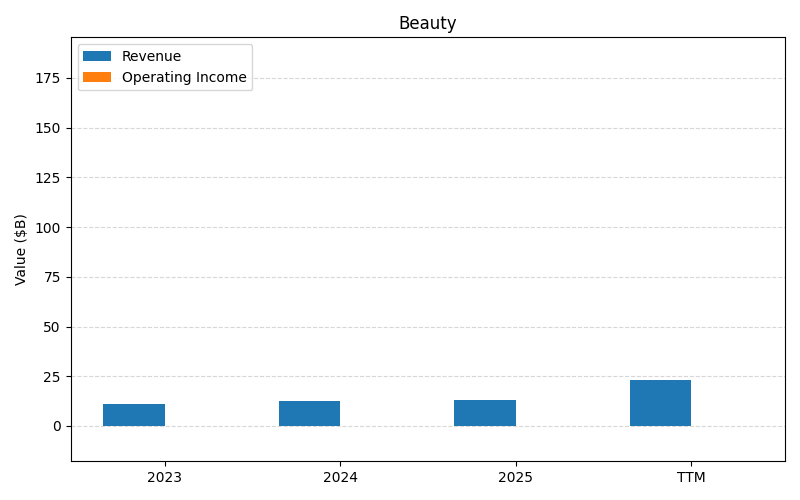
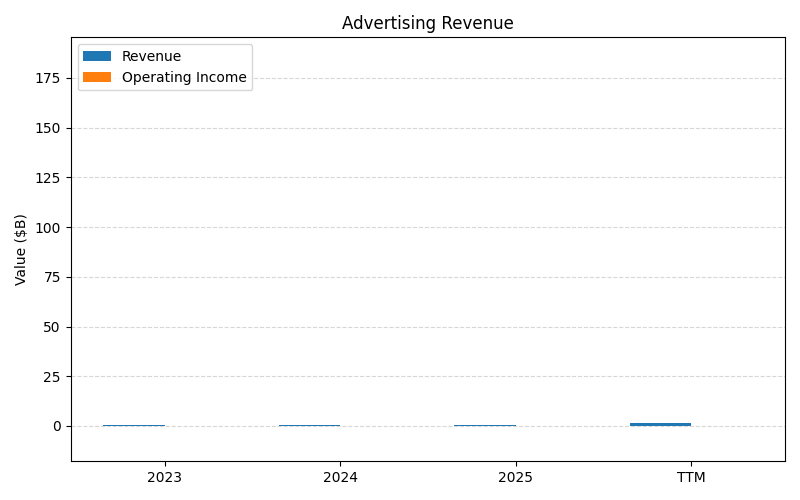
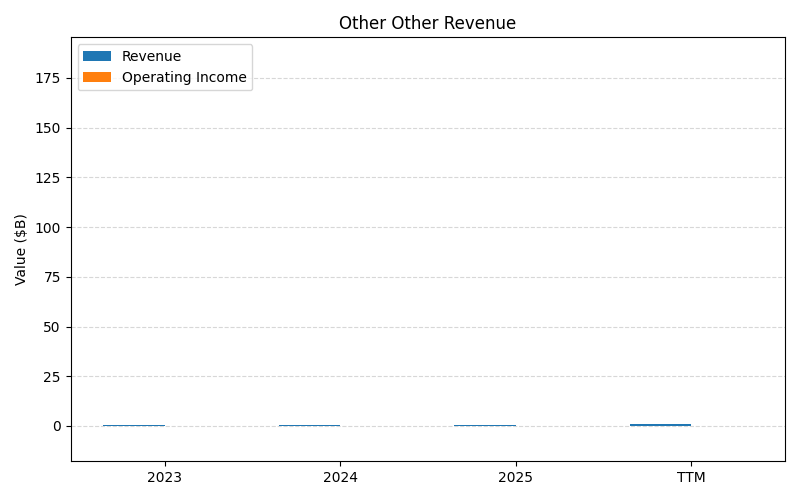
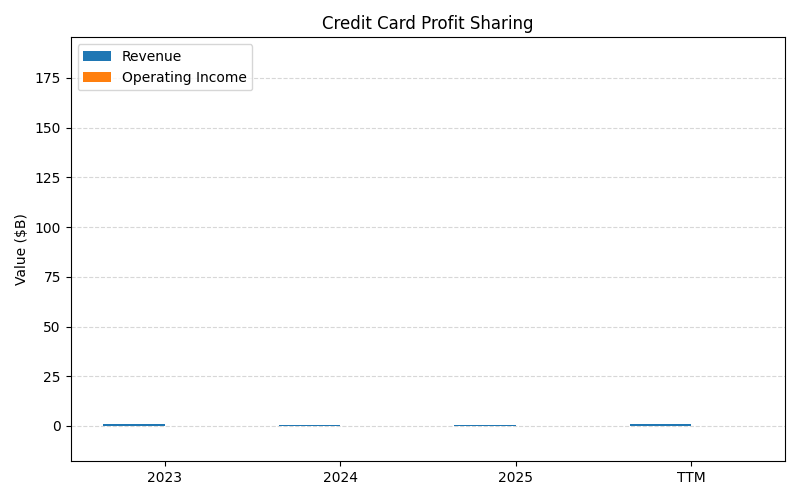
SEGMENTS v2025-09-09 · 2026-05-29 09:15 UTC — Units: $B. Rows list fiscal years (last 3 + TTM) with revenue for each segment; the final row shows the TTM revenue mix (operating income columns display “—” where mix is not applicable).
| Year | Prod Rev | Food And Beverage Rev | Household Essentials Rev | Apparel And Accessories Rev | Home Furnishings And Decor Rev | Hardlines Rev | Beauty Rev | Advertising Revenue Rev | Other Other Revenue Rev | Credit Card Profit Sharing Rev | Other Product Rev | Total Rev |
|---|---|---|---|---|---|---|---|---|---|---|---|---|
| 2024 | 105.8B | 23.9B | 18.7B | 16.5B | 17.8B | 16.2B | 12.5B | 0.52B | 0.42B | 0.67B | 0.21B | 213.2B |
| 2025 | 104.8B | 23.8B | 18.6B | 16.5B | 16.7B | 15.8B | 13.2B | 0.65B | 0.52B | 0.58B | 0.22B | 211.4B |
| 2026 | 102.7B | 24.1B | 18B | 15.7B | 15.6B | 15.8B | 13.2B | 0.92B | 0.63B | 0.52B | 0.20B | 207.5B |
| TTM | 404.8B | 94.7B | 73B | 63.9B | 62.8B | 57.3B | 52.3B | 3.05B | 2.23B | 2.19B | 0.72B | 817B |
| % of Total (TTM) | 49.5% | 11.6% | 8.9% | 7.8% | 7.7% | 7.0% | 6.4% | 0.4% | 0.3% | 0.3% | 0.1% | 100% |
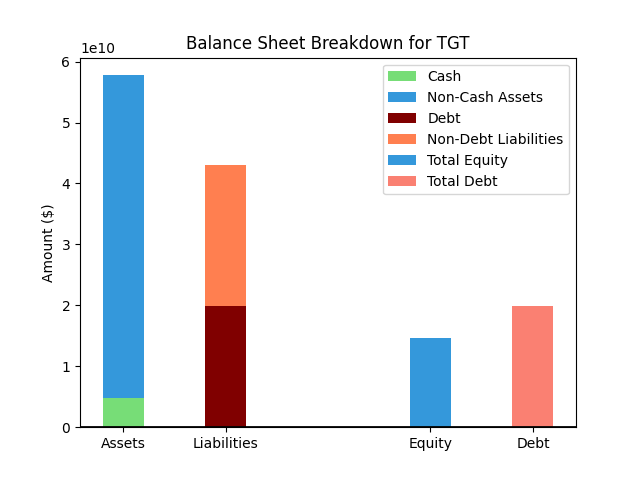
Balance Sheet
| Metric | Value | |
|---|---|---|
| 0 | Total Assets | $59,490M |
| 1 | Cash | $5,488M |
| 2 | Total Liabilities | $43,325M |
| 3 | Total Debt | $20,290M |
| 4 | Total Equity | $16,165M |
| 5 | Debt to Equity Ratio | 1.26 |
EPS & Dividend
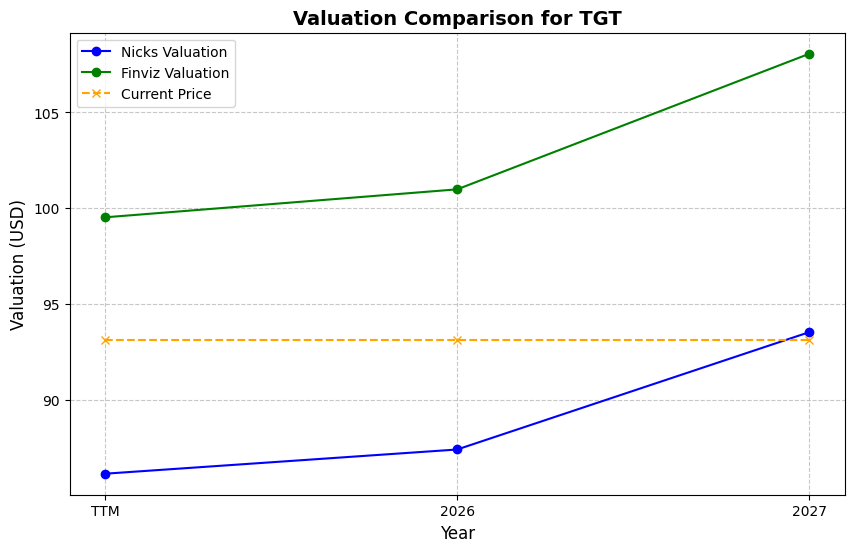
Valuation
| Share Price | Treasury Yield | Estimates | Fair Value (P/E) | Fair Value (P/S) | Current P/S | Current P/E |
|---|---|---|---|---|---|---|
| $127.07 | 4.5% | Nicks Growth: 4% Nick's Expected Margin: 4% FINVIZ Growth: 7% |
Nicks: 10 Finviz: 13 |
Nick's: 0.382 | 0.7 | 16.7 |
| Basis | Year | Nicks Valuation | Nicks vs Share Price | Finviz Valuation | Finviz vs Share Price |
|---|---|---|---|---|---|
| $7.59 EPS | TTM | $72.53 | -42.9% | $102.07 | -19.7% |
| $8.34 EPS | 2027 | $79.67 | -37.3% | $112.12 | -11.8% |
| $8.90 EPS | 2028 | $85.04 | -33.1% | $119.68 | -5.8% |
Implied Growth
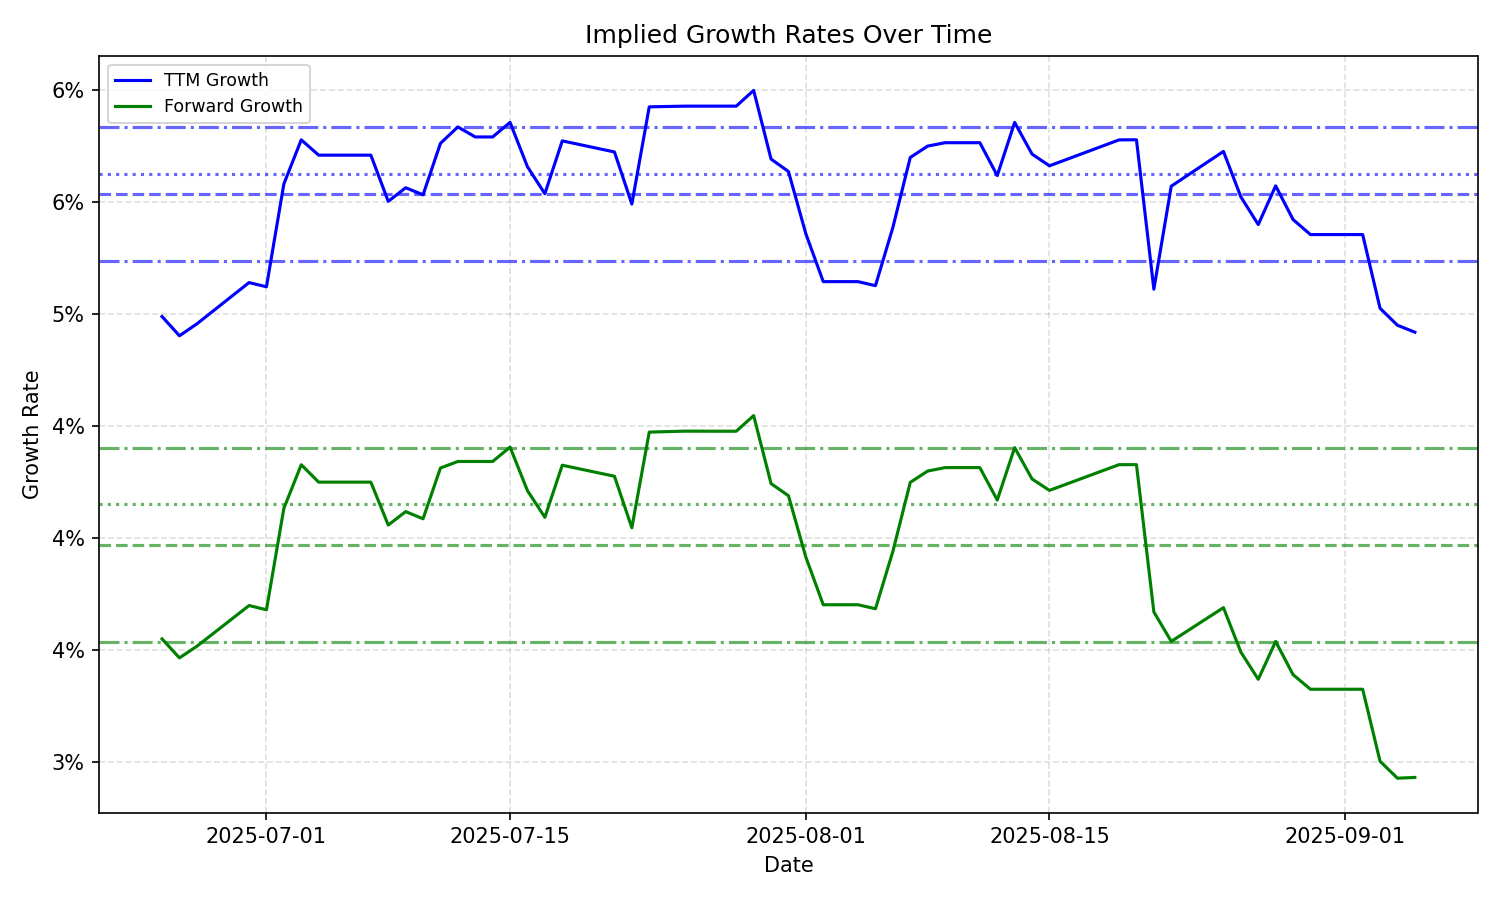
| Average | Median | Std Dev | Current | Percentile | ||||||
|---|---|---|---|---|---|---|---|---|---|---|
| TTM | Forward | TTM | Forward | TTM | Forward | TTM | Forward | TTM | Forward | |
| Timeframe | ||||||||||
| 1 Year | 5.61% | 4.24% | 5.36% | 3.55% | 1.29% | 2.01% | 9.87% | 8.21% | 99.4% | 98.3% |
| 3 Years | 5.61% | 4.24% | 5.36% | 3.55% | 1.29% | 2.01% | 9.87% | 8.21% | 99.4% | 98.3% |
| 5 Years | 5.61% | 4.24% | 5.36% | 3.55% | 1.29% | 2.01% | 9.87% | 8.21% | 99.4% | 98.3% |
| 10 Years | 5.61% | 4.24% | 5.36% | 3.55% | 1.29% | 2.01% | 9.87% | 8.21% | 99.4% | 98.3% |