Teva Pharmaceutical Industries — TEVA
| Close Price | Market Cap | P/E Ratio | Forward P/E Ratio | Implied Growth* | Implied Forward Growth* | Dividend | P/B Ratio |
|---|---|---|---|---|---|---|---|
| $35.32 | $41.13B | 26.4 | 11.4 | 14.6% | 5.8% | - | 5.0 |
Latest Headlines
- · J&J Stock Gains Nearly 12% Year to Date: Buy, Sell or Hold Now?
- · /C O R R E C T I O N -- Veeva Systems/
- · Interact Enters a New Era of Growth with Brand Evolution, AI Innovation, and Industry Recognition
- · TEVA's MAA for Olanzapine LAI in Schizophrenia Accepted in the EU
- · The European Medicines Agency Accepts Teva’s Marketing Authorization Application for Olanzapine Long-Acting Injectable (TEV-‘749) for the Treatment of Schizophrenia in Adults
- · Teva TD Findings Highlight Underdiagnosis And Shape Neuroscience Growth Story
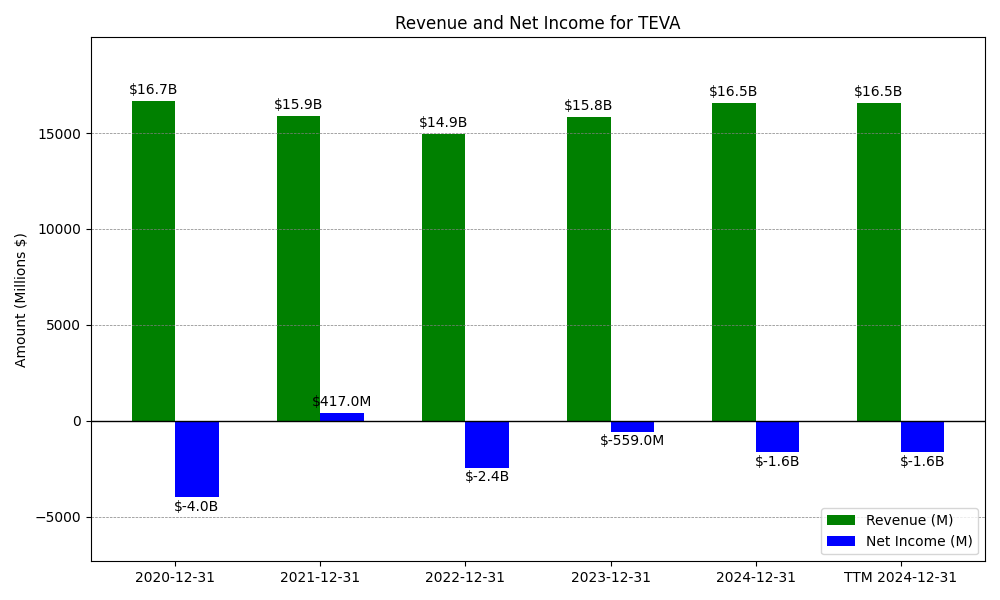
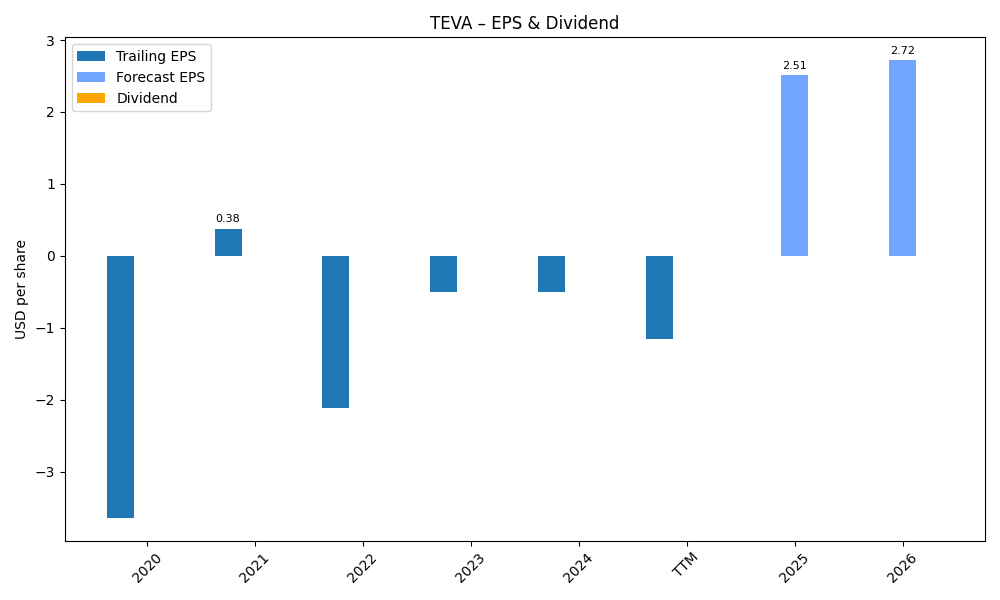
Revenue & Net Income
| Date | Revenue | Net_Income | EPS | Last_Updated | Revenue_Change | Net_Income_Change | EPS_Change | |
|---|---|---|---|---|---|---|---|---|
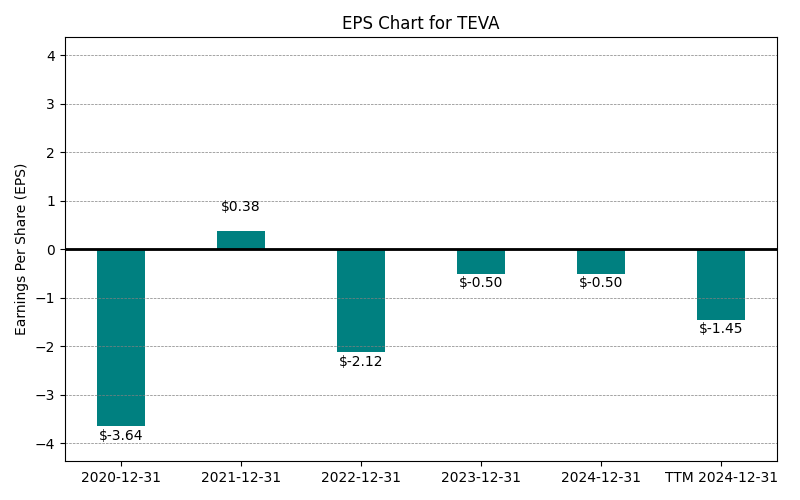
| 0 | 2020-12-31 | $16,658M | $-3,990M | $-3.64 | 2025-01-30 13:21:22 | N/A | N/A | N/A |
| 1 | 2021-12-31 | $15,879M | $417M | $0.38 | 2025-01-30 13:21:22 | -4.7% | -110.5% | -110.4% |
| 2 | 2022-12-31 | $14,925M | $-2,446M | $-2.12 | 2026-05-29 09:14:57 | -6.0% | -686.6% | -657.9% |
| 3 | 2023-12-31 | $15,845M | $-559M | $-0.50 | 2026-05-29 09:14:57 | 6.2% | -77.1% | -76.4% |
| 4 | 2024-12-31 | $16,544M | $-1,639M | $-1.45 | 2026-05-29 09:14:57 | 4.4% | 193.2% | 190.0% |
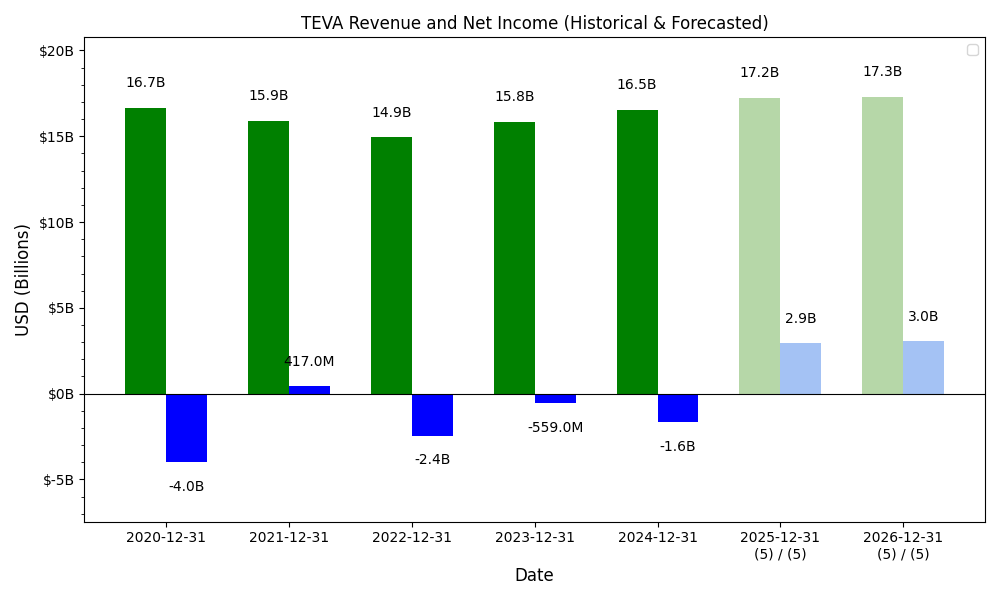
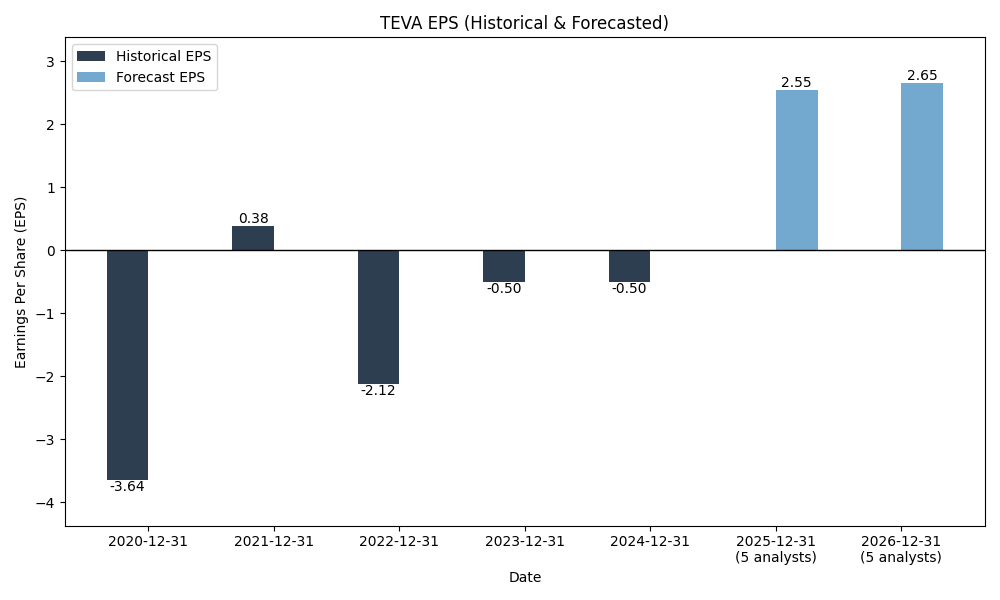
| 5 | 2025-12-31 | $17,257M | $1,410M | $1.23 | 2026-05-29 09:14:57 | 4.3% | -186.0% | -184.8% |
| 6 | TTM 2026-03-31 | $17,348M | $1,564M | $1.34 | 2026-05-01 08:48:39 | 0.5% | 10.9% | 8.9% |
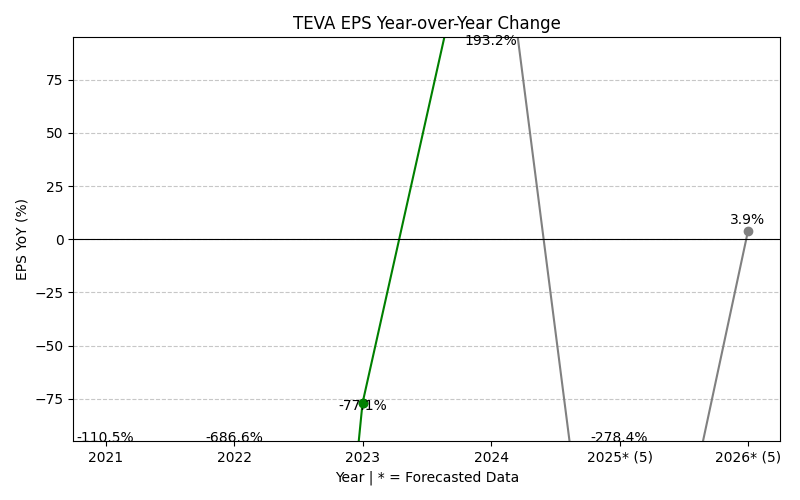
EPS
Forecasts
Y/Y % Change
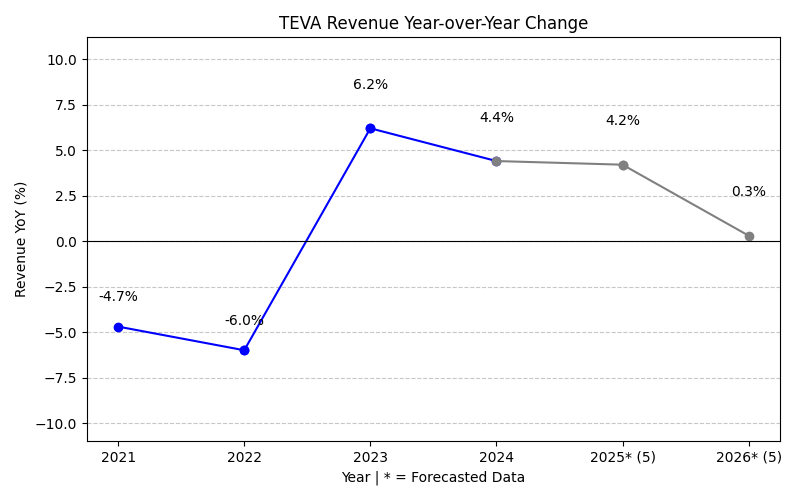
TEVA Year-over-Year Growth
| 2020 | 2021 | 2022 | 2023 | 2024 | 2025 | 2026 | 2027 | Average | |
|---|---|---|---|---|---|---|---|---|---|
| Revenue Growth (%) | -4.7% | -6.0% | 6.2% | 4.4% | 4.3% | -3.5% | 3.7% | 0.6% | |
| Revenue Analysts (#) | 0 | 0 | 0 | 0 | 0 | 0 | 11 | 11 | |
| EPS Growth (%) | -110.5% | -686.6% | -77.1% | 193.2% | -186.0% | 95.4% | 31.1% | -105.8% | |
| EPS Analysts (#) | 0 | 0 | 0 | 0 | 0 | 0 | 13 | 13 |
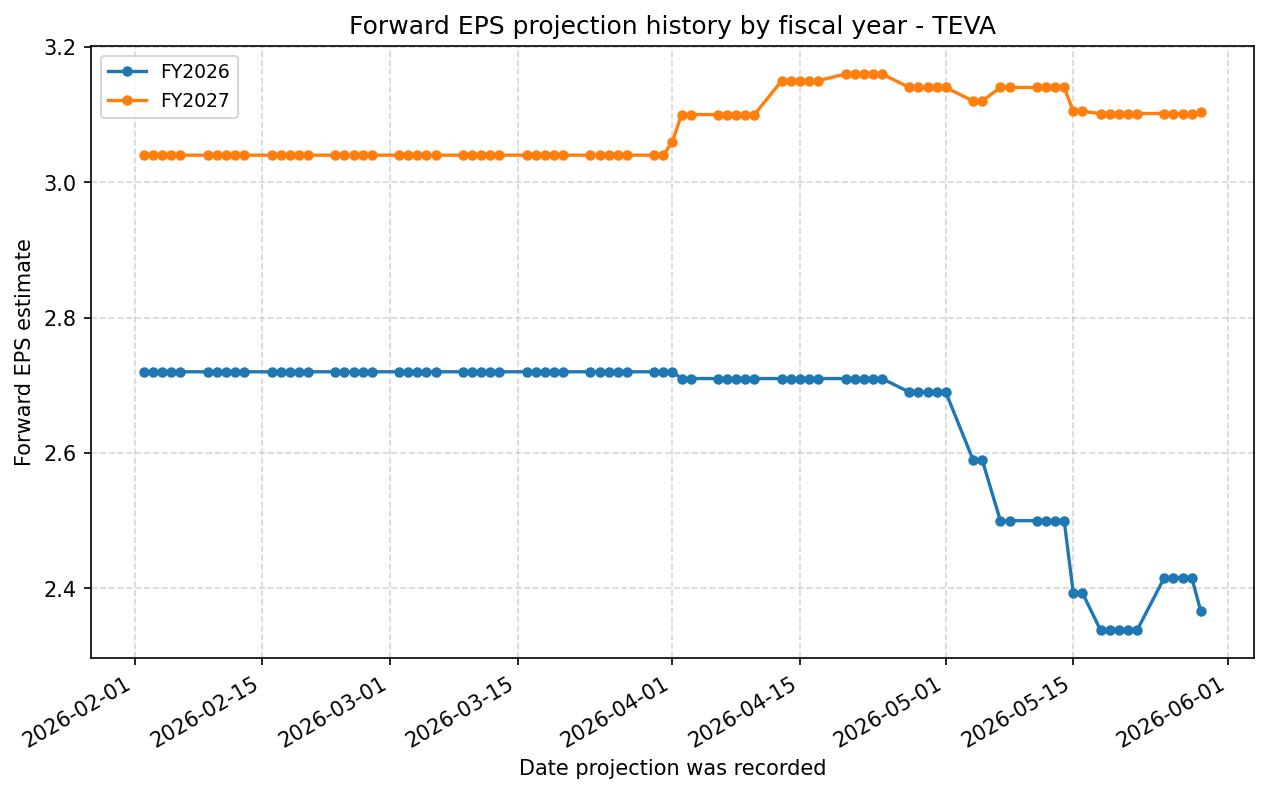
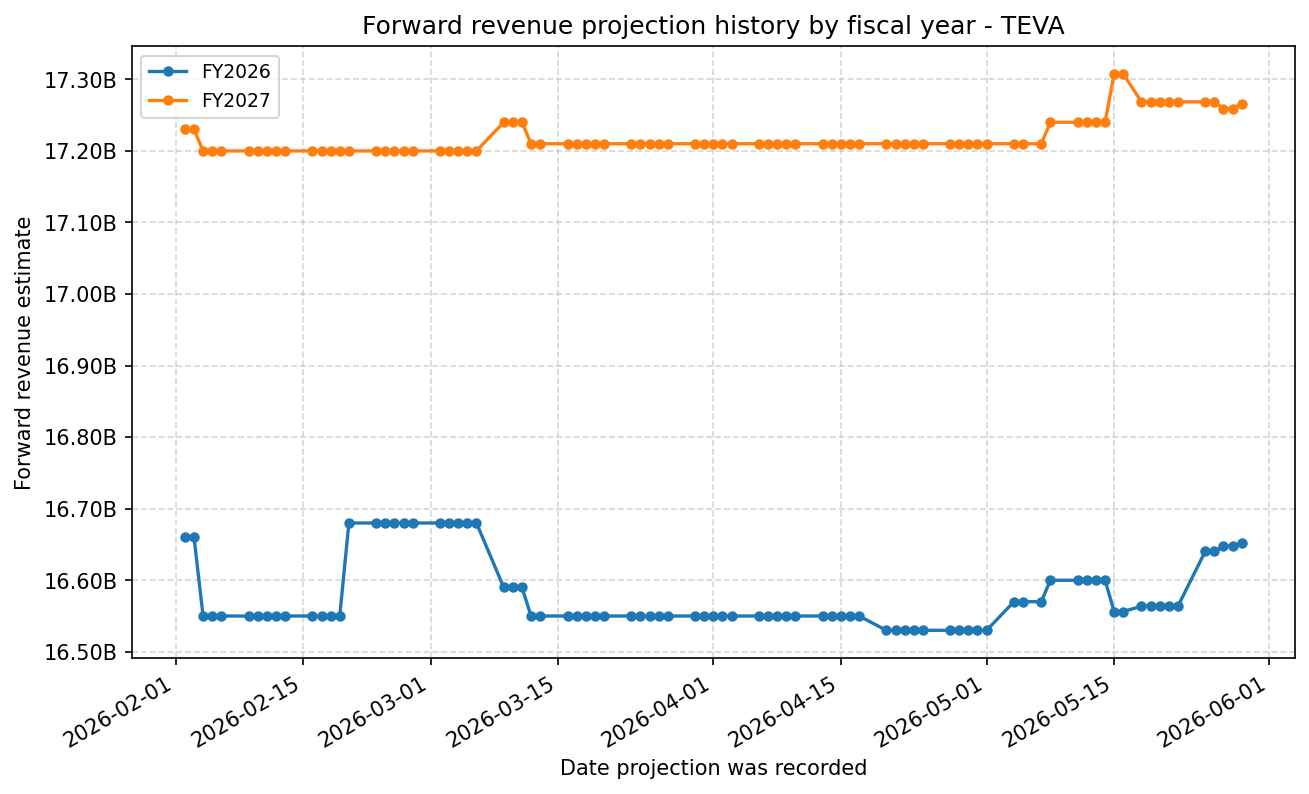
Forward Estimate History
How the next-FY EPS and revenue estimates have drifted over time. One line per fiscal year – past lines end when that FY became current.
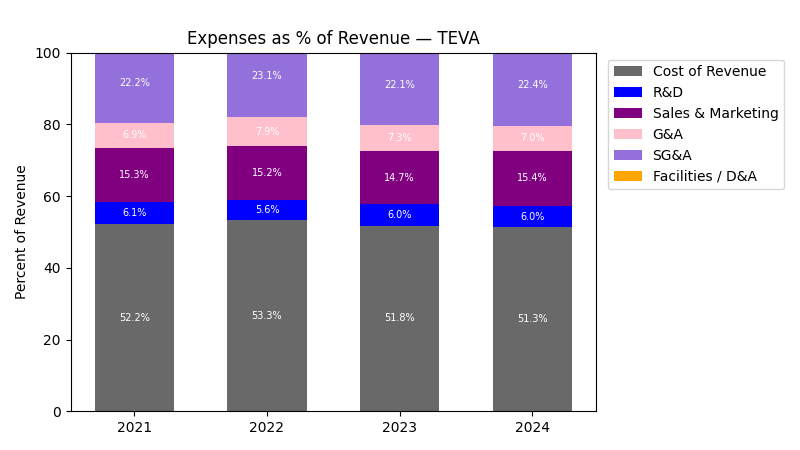
Expenses
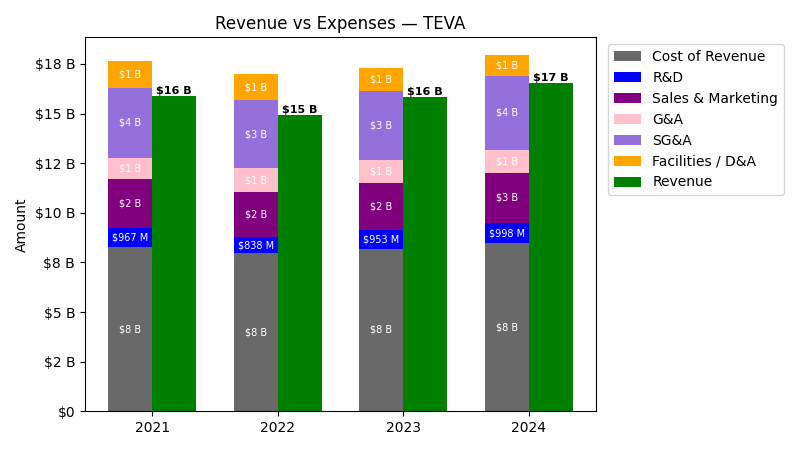
| Year | Revenue ($) | Cost of Revenue ($) | R&D ($) | Sales & Marketing ($) | G&A ($) | SG&A ($) | Facilities / D&A ($) |
|---|---|---|---|---|---|---|---|
| 2021 | $15.9B | $7.0B | $967.0M | $2.4B | $1.1B | $3.5B | $1.3B |
| 2022 | $14.9B | $6.6B | $838.0M | $2.3B | $1.2B | $3.4B | $1.3B |
| 2023 | $15.8B | $7.0B | $953.0M | $2.3B | $1.2B | $3.5B | $1.2B |
| 2024 | $16.5B | $7.4B | $998.0M | $2.5B | $1.2B | $3.7B | $1.1B |
| 2025 | $17.3B | $7.3B | $1.0B | $2.7B | $1.3B | $4.0B | $1.0B |
| TTM | $17.3B | $7.3B | $989.0M | $2.8B | $1.3B | $4.1B | $999.0M |
| Year | Revenue Change (%) | Cost of Revenue Change (%) | R&D Change (%) | Sales & Marketing Change (%) | G&A Change (%) | SG&A Change (%) | Facilities / D&A Change (%) |
|---|---|---|---|---|---|---|---|
| 2022 | -6.01 | -4.46 | -13.34 | -6.75 | 7.37 | -2.35 | -1.65 |
| 2023 | 6.16 | 6.07 | 13.72 | 3.13 | -1.53 | 1.54 | -11.85 |
| 2024 | 4.41 | 5.32 | 4.72 | 8.78 | -0.09 | 5.83 | -8.15 |
| 2025 | 4.31 | -1.40 | 1.50 | 5.71 | 10.85 | 7.32 | -5.38 |
| TTM | 0.53 | 0.00 | -2.37 | 2.72 | 0.47 | 1.99 | -0.30 |
No unmapped expenses.
Segment Performance
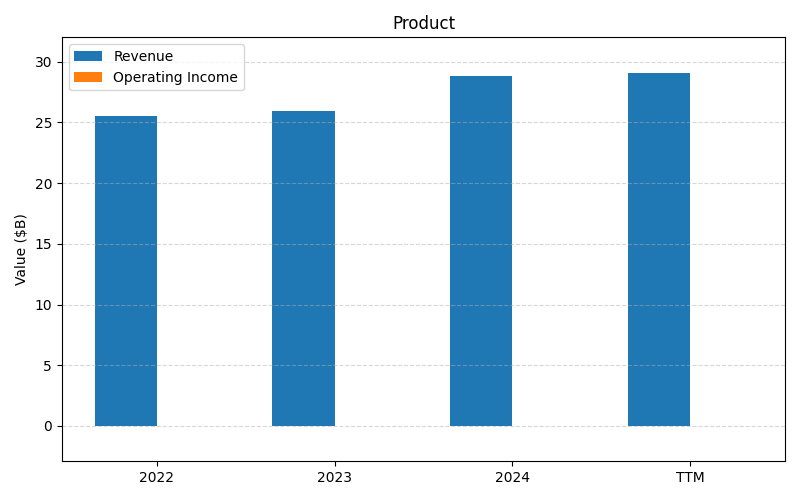
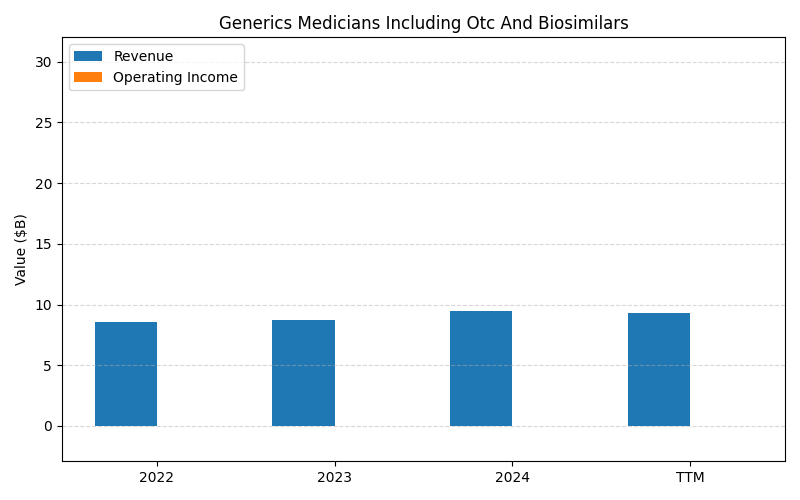
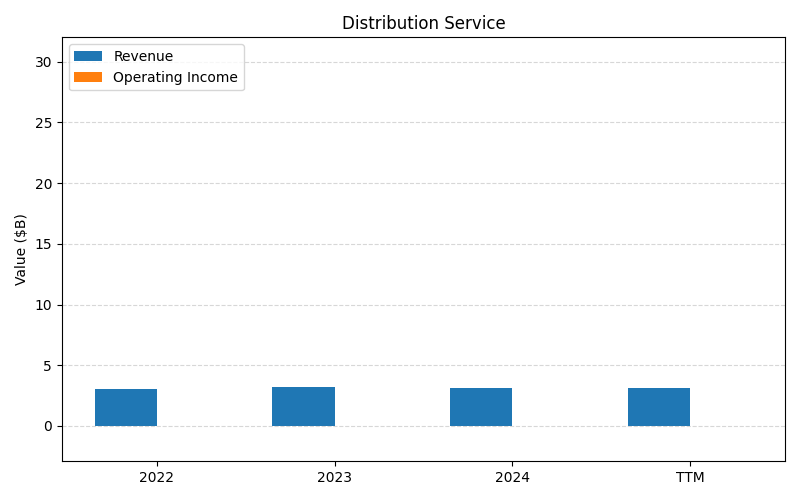
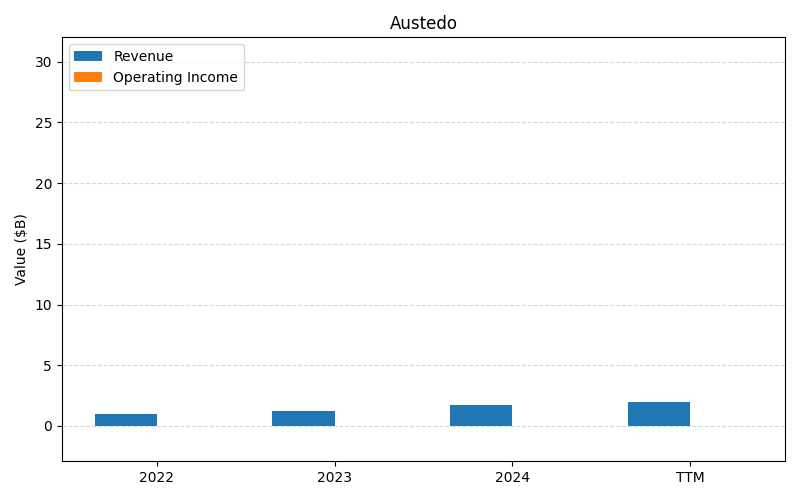
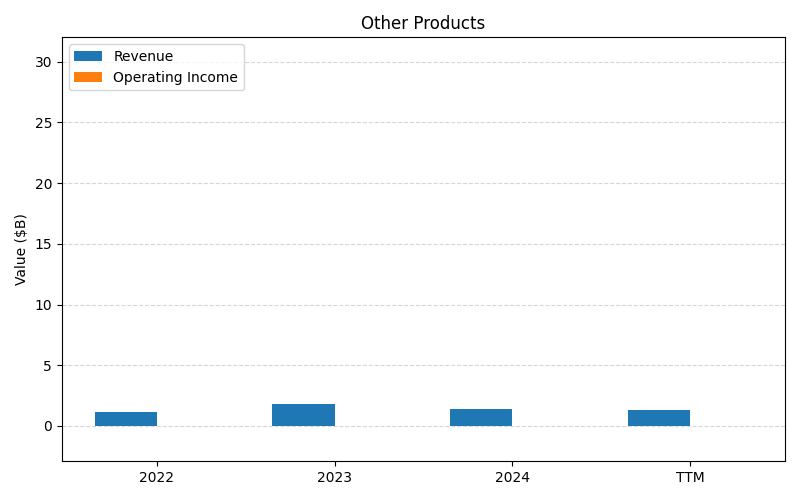
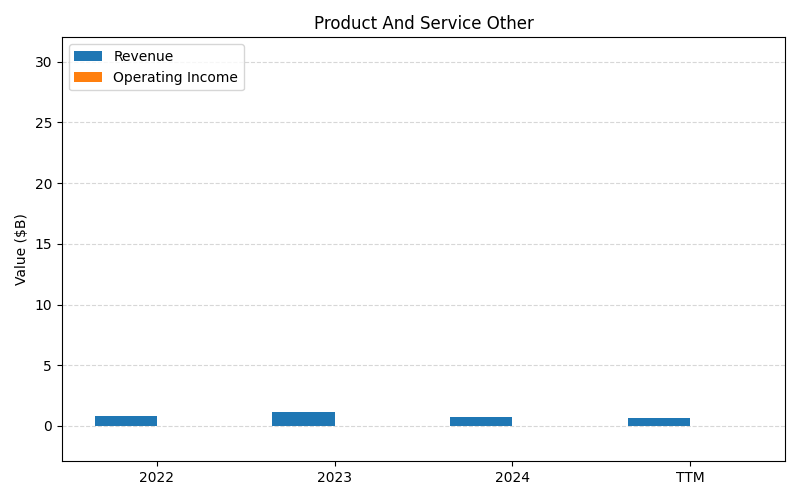
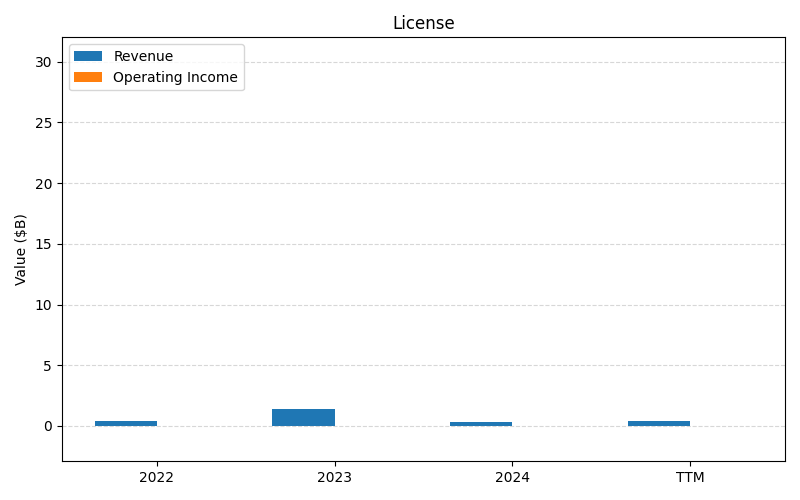
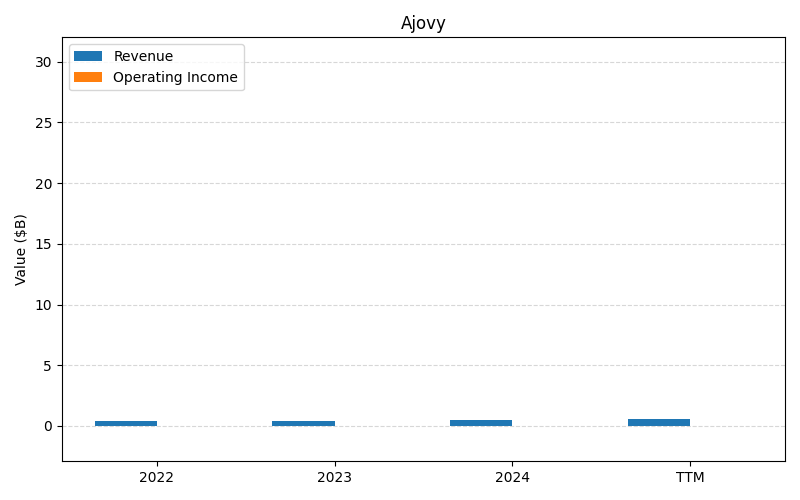
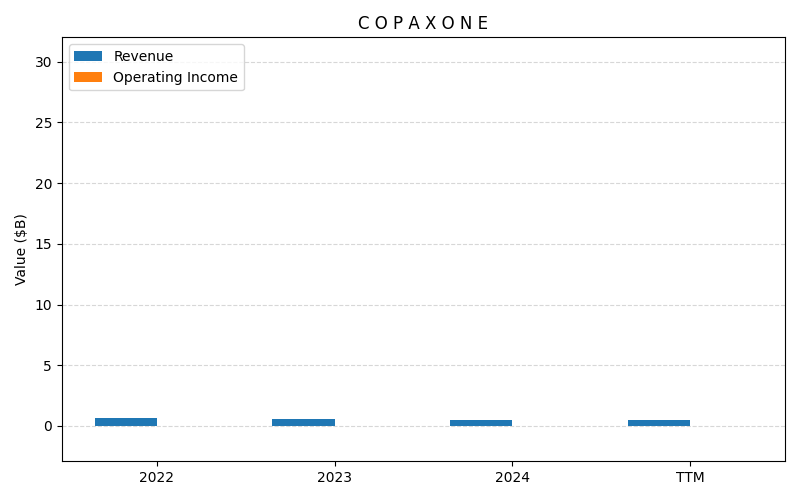
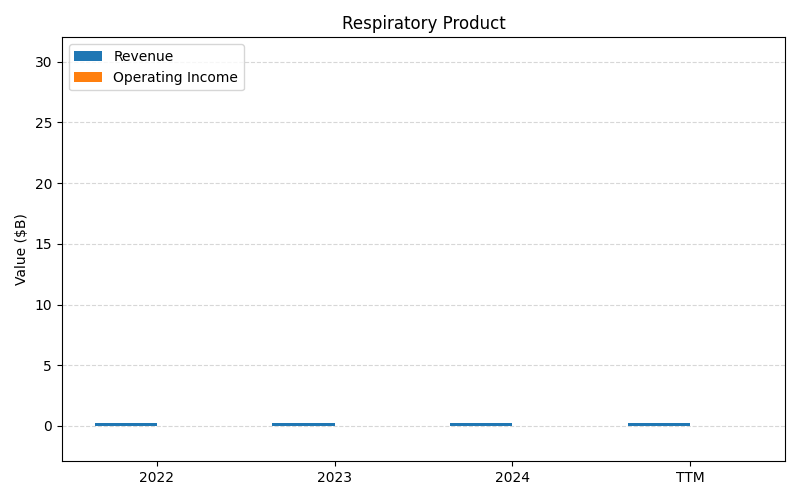
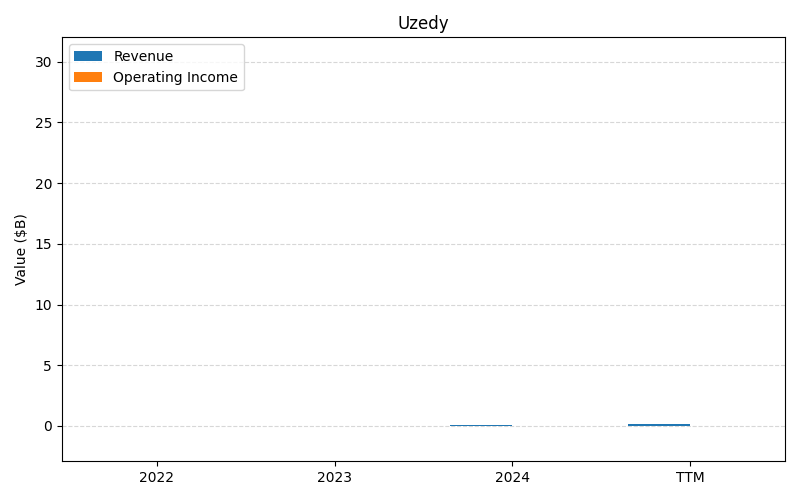
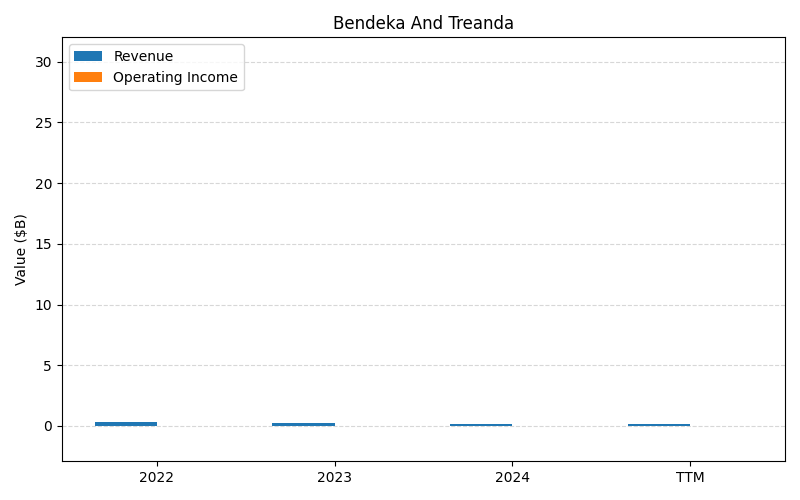
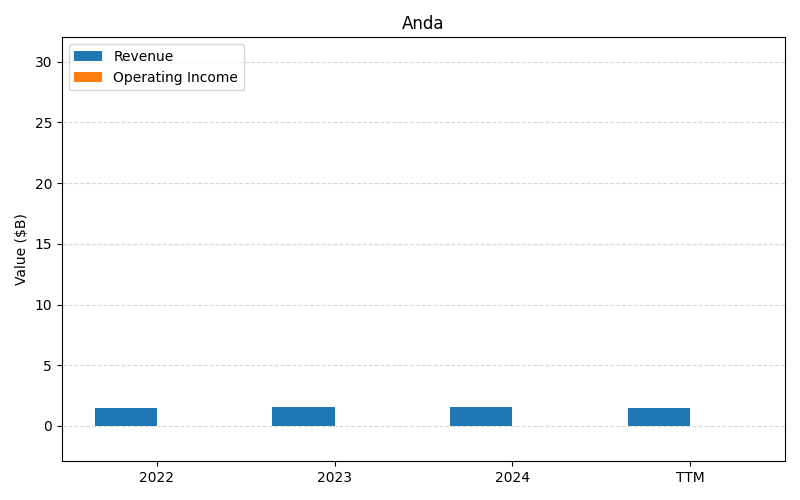
SEGMENTS v2025-09-09 · 2026-05-29 09:15 UTC — Units: $B. Rows list fiscal years (last 3 + TTM) with revenue for each segment; the final row shows the TTM revenue mix (operating income columns display “—” where mix is not applicable).
| Year | Prod Rev | Generics Medicians Including Otc And Biosimilars Rev | Distribution Service Rev | Austedo Rev | Other Products Rev | Product And Service Other Rev | License Rev | Ajovy Rev | C O P A X O N E Rev | Respiratory Product Rev | Uzedy Rev | Bendeka And Treanda Rev | Anda Rev | Total Rev |
|---|---|---|---|---|---|---|---|---|---|---|---|---|---|---|
| 2023 | 26B | 8.73B | 3.23B | 1.24B | 1.82B | 1.14B | 1.36B | 0.43B | 0.59B | 0.27B | 0.02B | 0.24B | 1.58B | 46.6B |
| 2024 | 28.1B | 9.46B | 3.15B | 1.69B | 1.38B | 1.49B | 0.35B | 0.51B | 0.50B | 0.24B | 0.12B | 0.17B | 1.54B | 48.7B |
| 2025 | 29.2B | 9.42B | 3.10B | 2.26B | 1.51B | 0.85B | 1.36B | 0.67B | 0.47B | 0.23B | 0.19B | 0.15B | 1.50B | 50.9B |
| TTM | 70.9B | 23.3B | 7.81B | 4.94B | 3.38B | 2.80B | 1.85B | 1.51B | 1.19B | 0.58B | 0.41B | 0.38B | – | 119B |
| % of Total (TTM) | 59.6% | 19.6% | 6.6% | 4.1% | 2.8% | 2.4% | 1.6% | 1.3% | 1.0% | 0.5% | 0.3% | 0.3% | – | 100% |
Segment Performance (Axis 2)
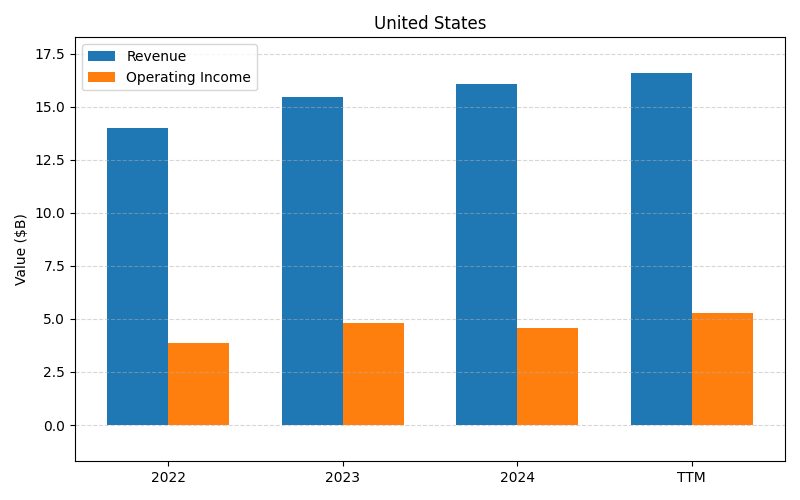
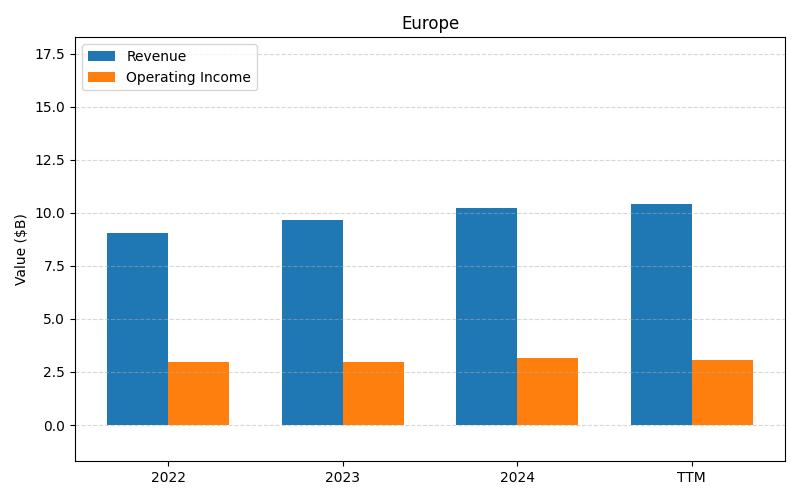
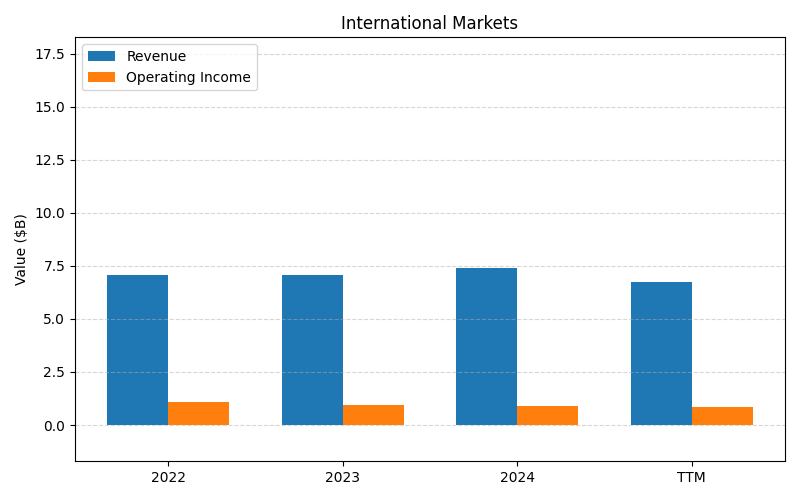
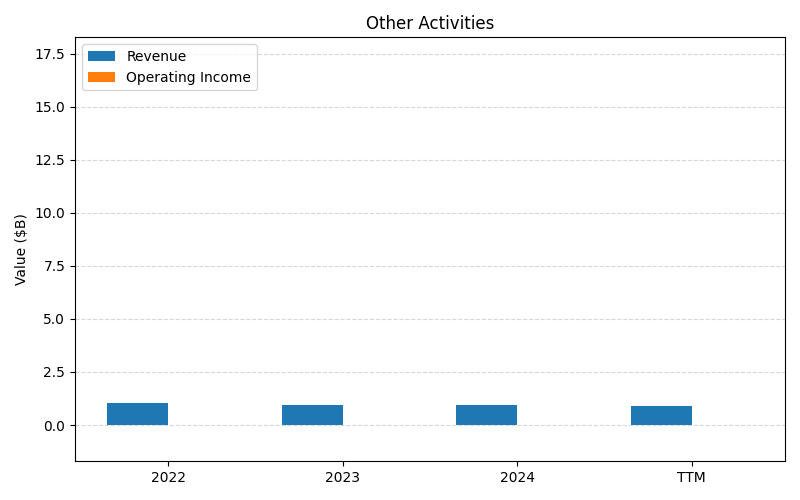
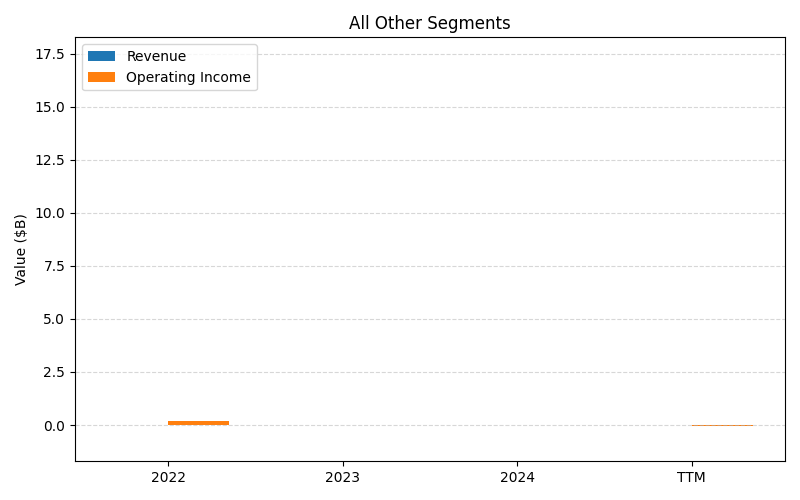
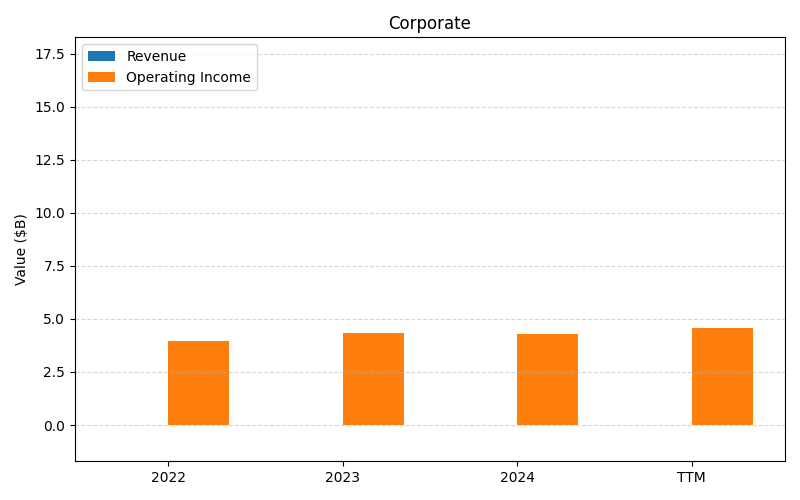
SEGMENTS v2025-09-09 · 2026-05-29 09:15 UTC — Units: $B. Rows list fiscal years (last 3 + TTM) with revenue and operating income for each segment; the final row shows the TTM revenue mix (operating income columns display “—” where mix is not applicable).
| Year | United States Rev | United States OI | Europe Rev | Europe OI | International Markets Rev | International Markets OI | Other Activities Rev | Other Activities OI | All Other Segments Rev | All Other Segments OI | Corporate Rev | Corporate OI | Total Rev | Total OI |
|---|---|---|---|---|---|---|---|---|---|---|---|---|---|---|
| 2023 | 15.5B | 4.79B | 9.67B | 2.96B | 7.05B | 0.93B | 0.93B | – | – | 0.02B | – | 4.34B | 33.1B | 13B |
| 2024 | 16.1B | 4.59B | 10.2B | 3.15B | 7.39B | 0.88B | 0.94B | – | – | 0.02B | – | 4.31B | 34.6B | 13B |
| 2025 | 18.4B | 6.71B | 10.1B | 2.61B | 6.49B | 0.67B | 0.87B | – | – | -0.09B | – | 5.00B | 35.8B | 14.9B |
| TTM | 40.6B | 13.4B | 25.4B | 7.22B | 17.2B | 1.88B | 2.98B | 0.00B | 0.00B | -0.09B | 0.00B | 11.2B | 86.1B | 33.6B |
| % of Total (TTM) | 47.1% | — | 29.4% | — | 20.0% | — | 3.5% | — | 0.0% | — | 0.0% | — | 100% | — |
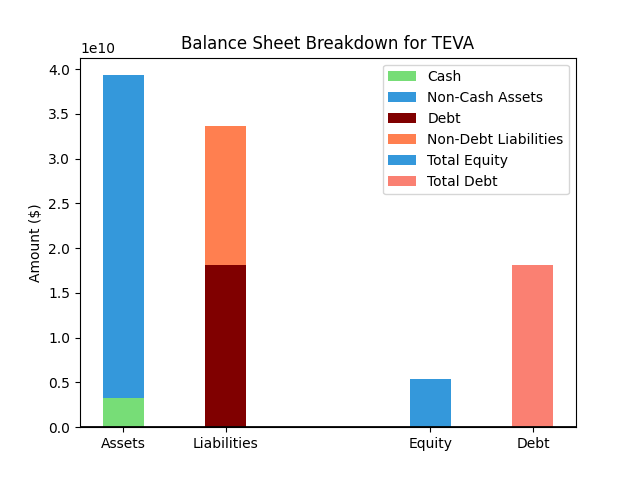
Balance Sheet
| Metric | Value | |
|---|---|---|
| 0 | Total Assets | $40,040M |
| 1 | Cash | $3,741M |
| 2 | Total Liabilities | $31,808M |
| 3 | Total Debt | $16,907M |
| 4 | Total Equity | $8,228M |
| 5 | Debt to Equity Ratio | 2.05 |
EPS & Dividend
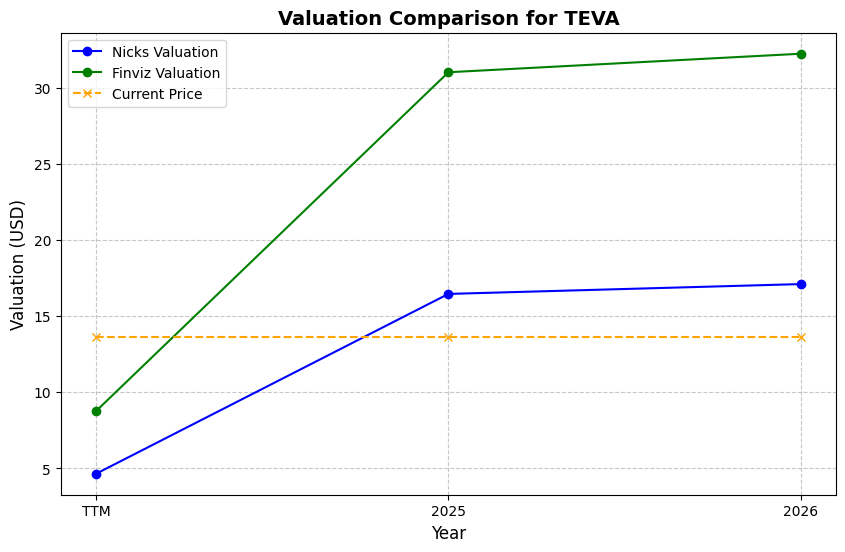
Valuation
| Share Price | Treasury Yield | Estimates | Fair Value (P/E) | Fair Value (P/S) | Current P/S | Current P/E |
|---|---|---|---|---|---|---|
| $35.32 | 4.5% | Nicks Growth: 0% Nick's Expected Margin: 5% FINVIZ Growth: 5% |
Nicks: 6 Finviz: 11 |
Nick's: 0.317 | 2.4 | 26.4 |
| Basis | Year | Nicks Valuation | Nicks vs Share Price | Finviz Valuation | Finviz vs Share Price |
|---|---|---|---|---|---|
| $1.34 EPS | TTM | $8.50 | -75.9% | $14.81 | -58.1% |
| $2.37 EPS | 2026 | $15.00 | -57.5% | $26.15 | -26.0% |
| $3.10 EPS | 2027 | $19.68 | -44.3% | $34.30 | -2.9% |
Implied Growth
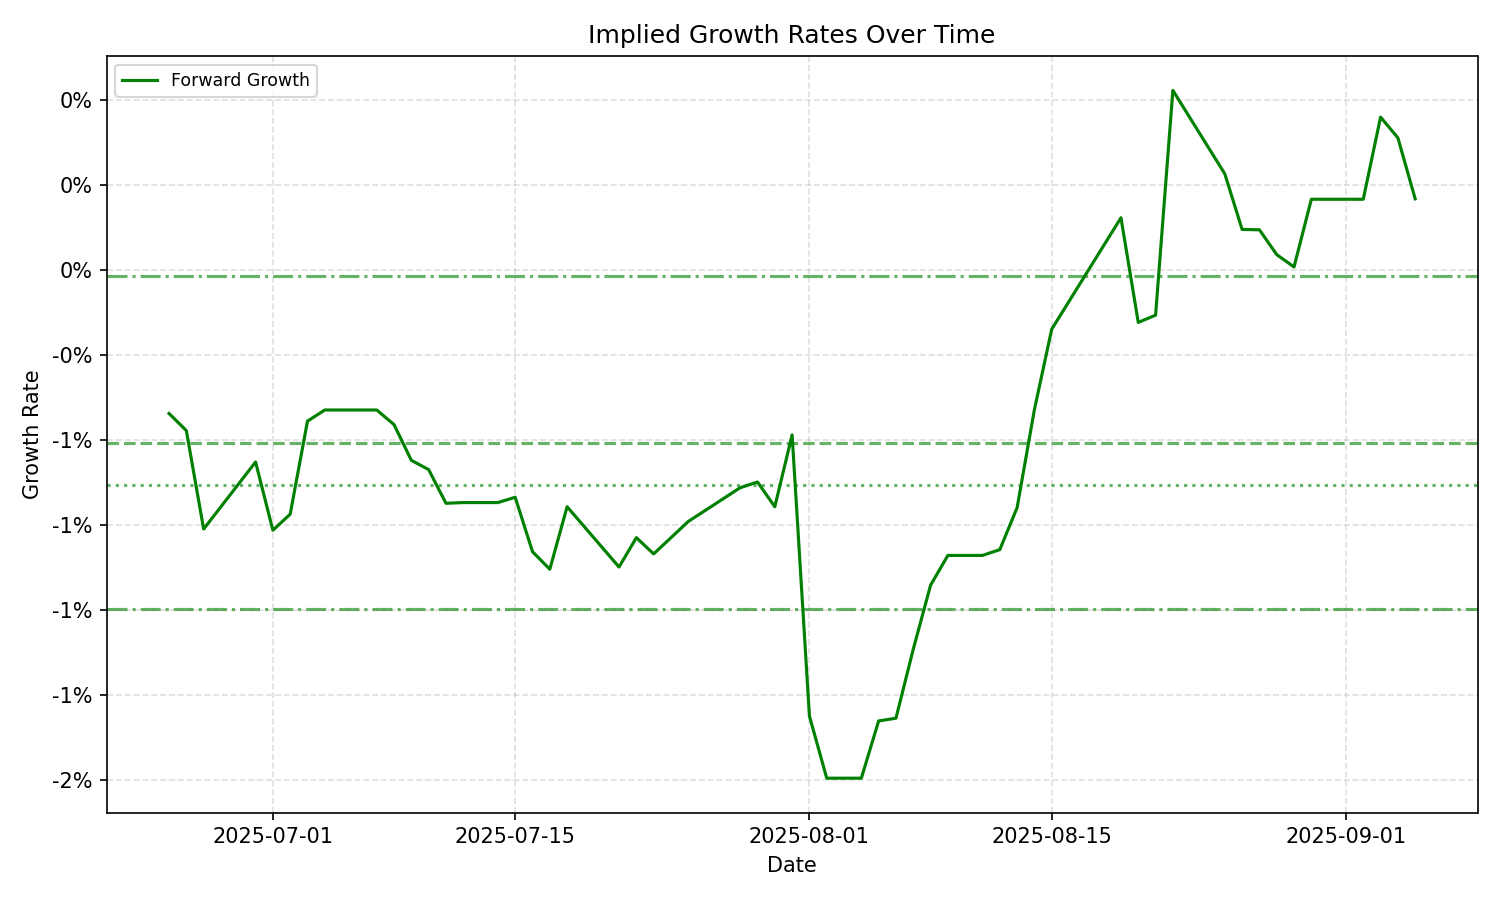
| Average | Median | Std Dev | Current | Percentile | ||||||
|---|---|---|---|---|---|---|---|---|---|---|
| TTM | Forward | TTM | Forward | TTM | Forward | TTM | Forward | TTM | Forward | |
| Timeframe | ||||||||||
| 1 Year | 18.80% | 1.43% | 19.33% | 0.59% | 2.76% | 2.22% | 14.38% | 5.53% | 5.9% | 94.2% |
| 3 Years | 18.80% | 1.43% | 19.33% | 0.59% | 2.76% | 2.22% | 14.38% | 5.53% | 5.9% | 94.2% |
| 5 Years | 18.80% | 1.43% | 19.33% | 0.59% | 2.76% | 2.22% | 14.38% | 5.53% | 5.9% | 94.2% |
| 10 Years | 18.80% | 1.43% | 19.33% | 0.59% | 2.76% | 2.22% | 14.38% | 5.53% | 5.9% | 94.2% |