Spotify Technology S.A. — SPOT
| Close Price | Market Cap | P/E Ratio | Forward P/E Ratio | Implied Growth* | Implied Forward Growth* | Dividend | P/B Ratio |
|---|---|---|---|---|---|---|---|
| $497.68 | $102.33B | 33.2 | 27.0 | 17.2% | 14.9% | - | 10.4 |
Latest Headlines
- · Universal Music Group Rejects Bill Ackman’s Offer as Too Low
- · Meta Platforms (META) Up 3.8% Since Last Earnings Report: Can It Continue?
- · Why Spotify Technology (SPOT) Is Up 5.5% After Launching Paid AI Remixes And Superfan Tools
- · Spotify Tests Superfan Tickets And Narrated Articles To Deepen Engagement
- · Why Is Spotify (SPOT) Up 15.6% Since Last Earnings Report?
- · Is Spotify (SPOT) the Best Steve Cohen Stock To Buy?
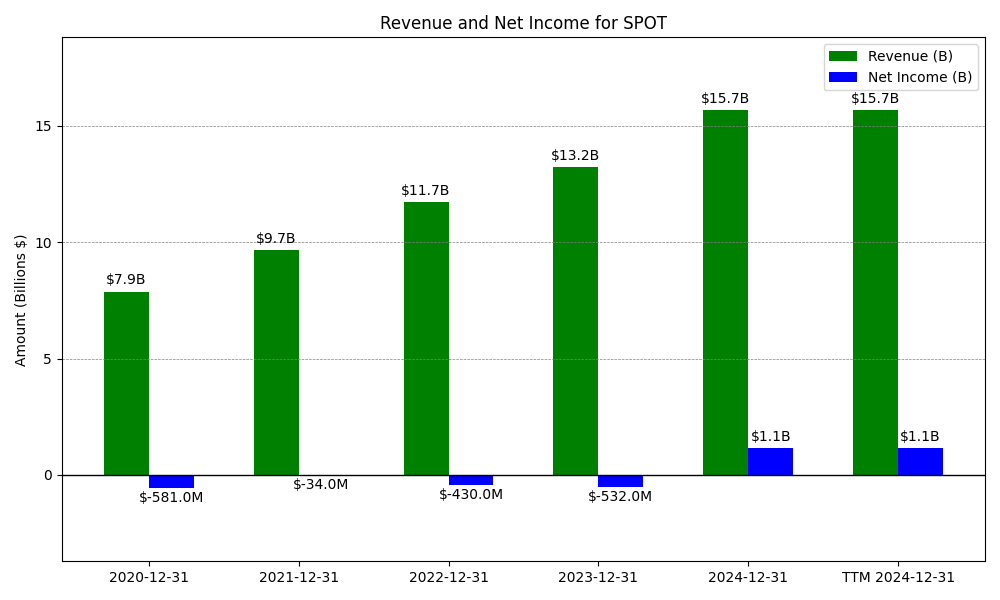
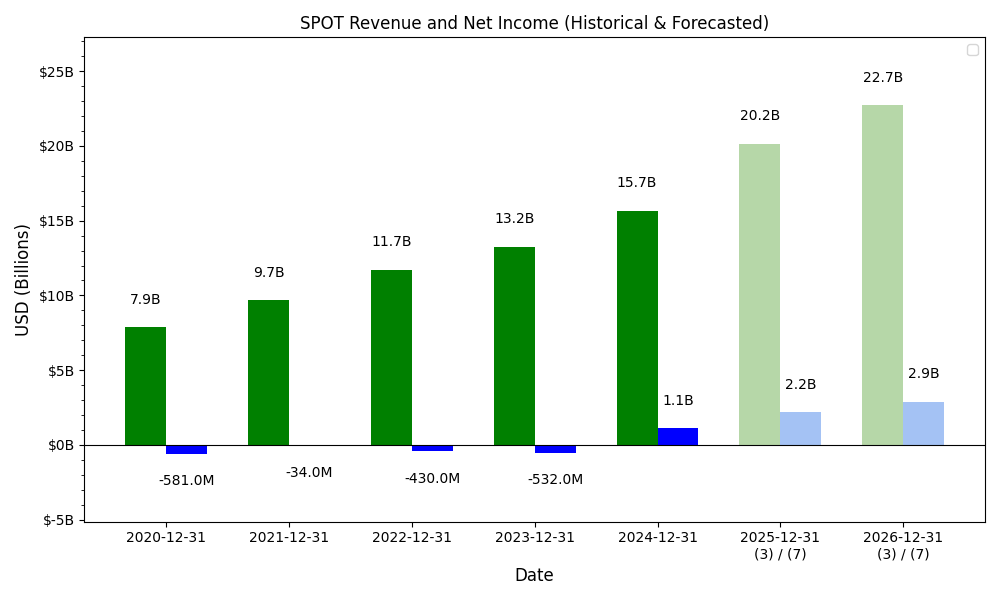
Revenue & Net Income
| Date | Revenue | Net_Income | EPS | Last_Updated | Revenue_Change | Net_Income_Change | EPS_Change | |
|---|---|---|---|---|---|---|---|---|
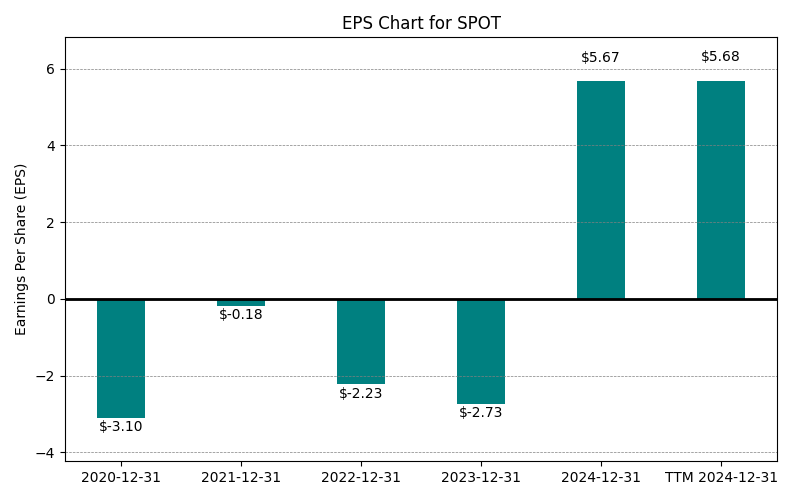
| 0 | 2020-12-31 | $7,880M | $-581M | $-3.10 | 2024-02-03 03:17:10 | N/A | N/A | N/A |
| 1 | 2021-12-31 | $9,668M | $-34M | $-0.18 | 2026-02-11 08:49:01 | 22.7% | -94.1% | -94.2% |
| 2 | 2022-12-31 | $11,727M | $-430M | $-2.23 | 2026-05-29 09:14:54 | 21.3% | 1164.7% | 1138.9% |
| 3 | 2023-12-31 | $13,247M | $-532M | $-2.73 | 2026-05-29 09:14:54 | 13.0% | 23.7% | 22.4% |
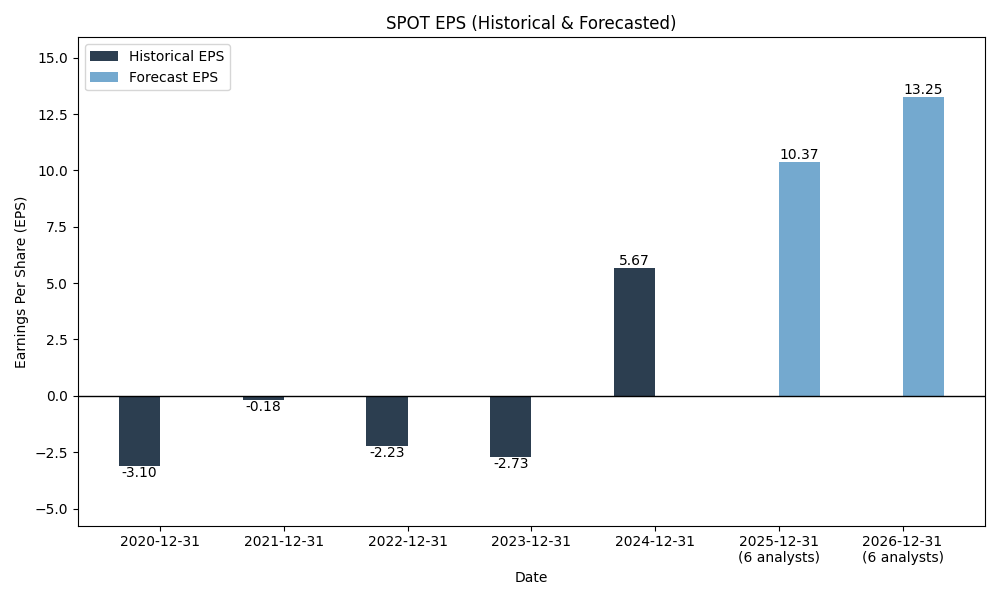
| 4 | 2024-12-31 | $15,673M | $1,138M | $5.67 | 2026-05-29 09:14:54 | 18.3% | -313.9% | -307.7% |
| 5 | 2025-12-31 | $17,186M | $2,212M | $10.77 | 2026-05-29 09:14:54 | 9.7% | 94.4% | 89.9% |
| 6 | TTM 2026-03-31 | $17,529M | $2,708M | $14.98 | 2026-04-30 08:55:46 | 2.0% | 22.4% | 39.1% |
EPS
Forecasts
Y/Y % Change
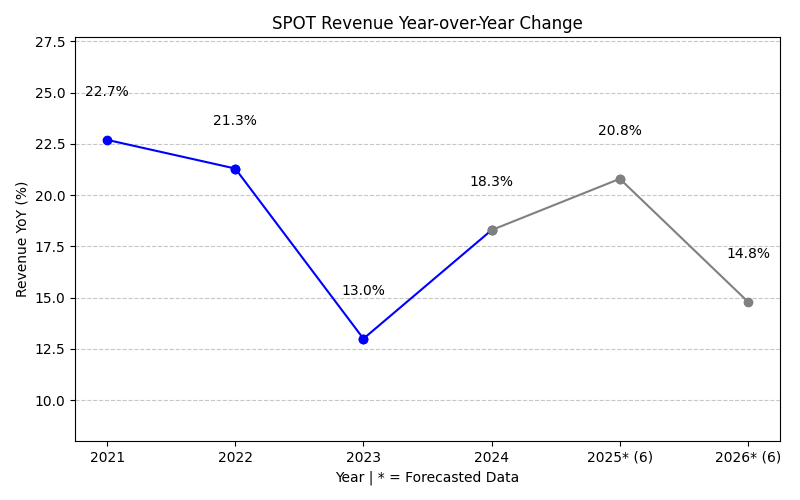

SPOT Year-over-Year Growth
| 2020 | 2021 | 2022 | 2023 | 2024 | 2025 | 2026 | 2027 | Average | |
|---|---|---|---|---|---|---|---|---|---|
| Revenue Growth (%) | 22.7% | 21.3% | 13.0% | 18.3% | 9.7% | 13.4% | 14.3% | 16.1% | |
| Revenue Analysts (#) | 0 | 0 | 0 | 0 | 0 | 0 | 34 | 36 | |
| EPS Growth (%) | -94.1% | 1164.7% | 23.7% | -313.9% | 94.4% | 19.6% | 23.5% | 131.1% | |
| EPS Analysts (#) | 0 | 0 | 0 | 0 | 0 | 0 | 27 | 27 |
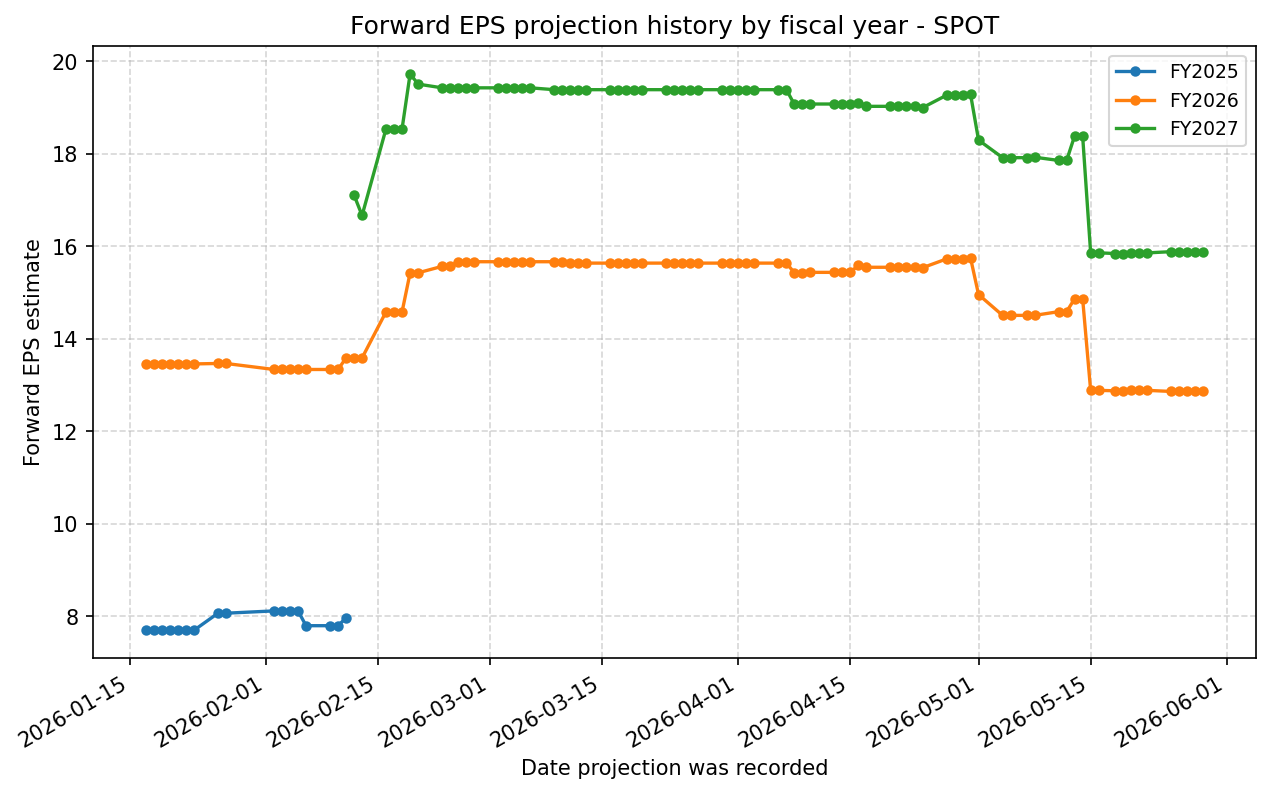
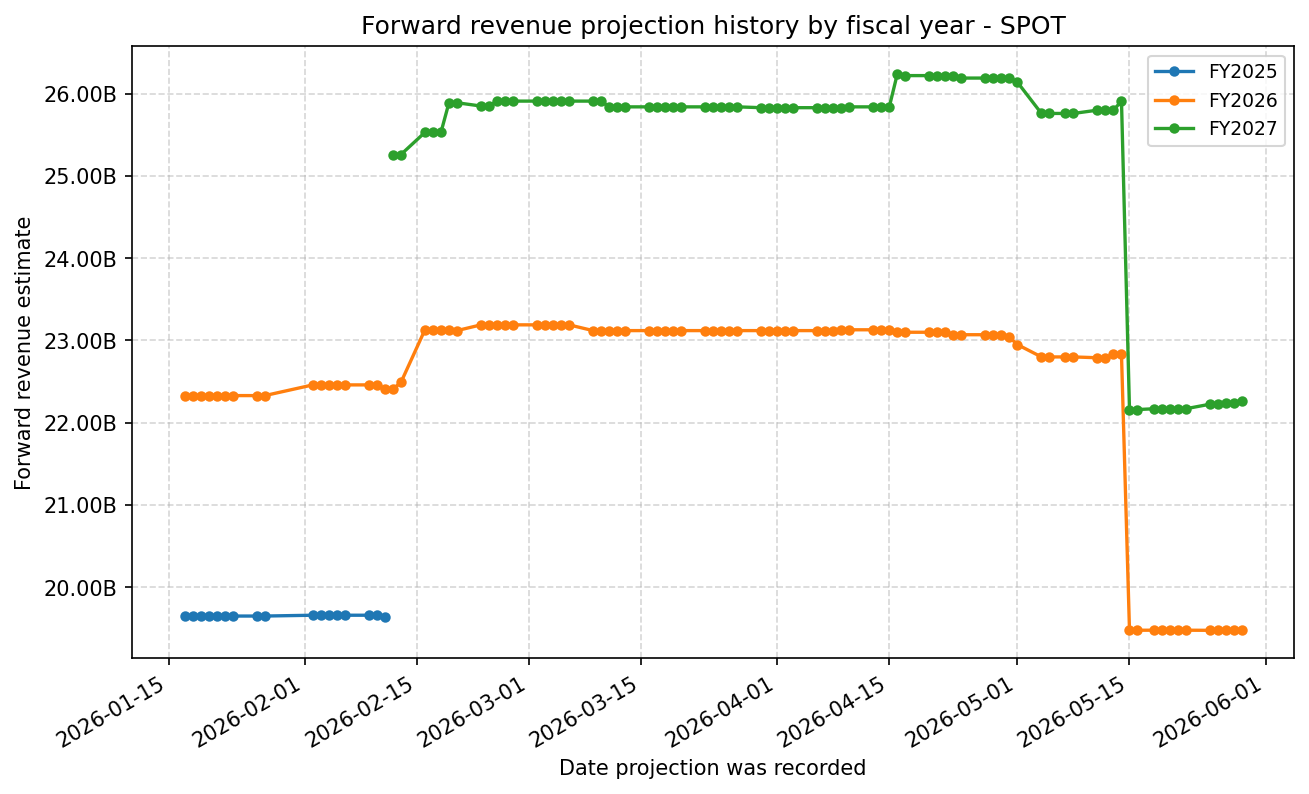
Forward Estimate History
How the next-FY EPS and revenue estimates have drifted over time. One line per fiscal year – past lines end when that FY became current.
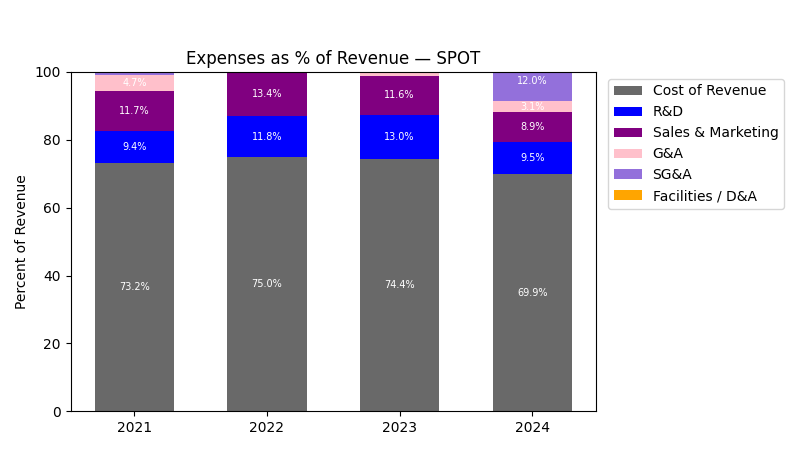
Expenses
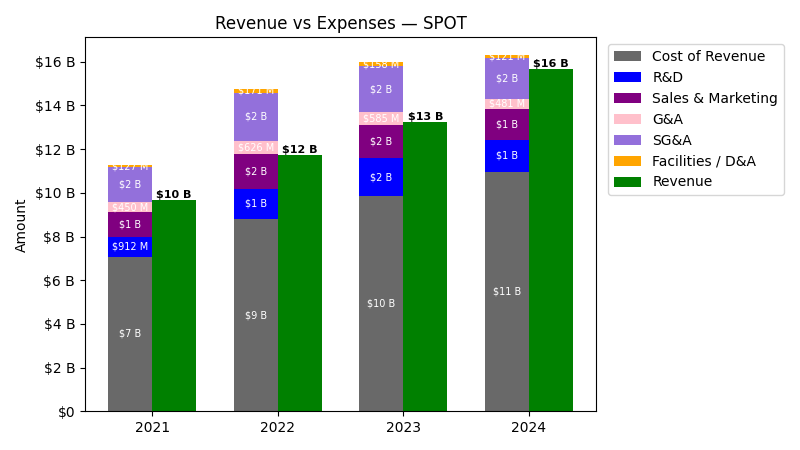
| Year | Revenue ($) | Cost of Revenue ($) | R&D ($) | Sales & Marketing ($) | G&A ($) | SG&A ($) | Facilities / D&A ($) |
|---|---|---|---|---|---|---|---|
| 2022 | $11.7B | $8.6B | $1.4B | $1.6B | $626.0M | $2.2B | $171.0M |
| 2023 | $13.2B | $9.7B | $1.7B | $1.5B | $585.0M | $2.1B | $158.0M |
| 2024 | $15.7B | $10.8B | $1.5B | $1.4B | $481.0M | $1.9B | $121.0M |
| 2025 | $17.2B | $11.6B | $1.4B | $1.4B | $479.0M | $1.9B | $102.0M |
| TTM | $17.5B | $11.8B | $1.3B | $1.5B | $462.0M | $1.9B | $101.0M |
| Year | Revenue Change (%) | Cost of Revenue Change (%) | R&D Change (%) | Sales & Marketing Change (%) | G&A Change (%) | SG&A Change (%) | Facilities / D&A Change (%) |
|---|---|---|---|---|---|---|---|
| 2023 | 12.96 | 12.31 | 24.37 | -2.48 | -6.55 | -3.64 | -7.60 |
| 2024 | 18.31 | 11.72 | -13.86 | -9.20 | -17.78 | -11.57 | -23.42 |
| 2025 | 9.65 | 7.02 | -6.26 | 2.44 | -0.42 | 1.71 | -15.70 |
| TTM | 2.00 | 1.51 | -3.45 | 1.96 | -3.55 | 0.58 | -0.98 |
No unmapped expenses.
Balance Sheet

| Metric | Value | |
|---|---|---|
| 0 | Total Assets | $13,128M |
| 1 | Cash | $5,255M |
| 2 | Total Liabilities | $5,118M |
| 3 | Total Debt | $476M |
| 4 | Total Equity | $8,010M |
| 5 | Debt to Equity Ratio | 0.06 |
EPS & Dividend

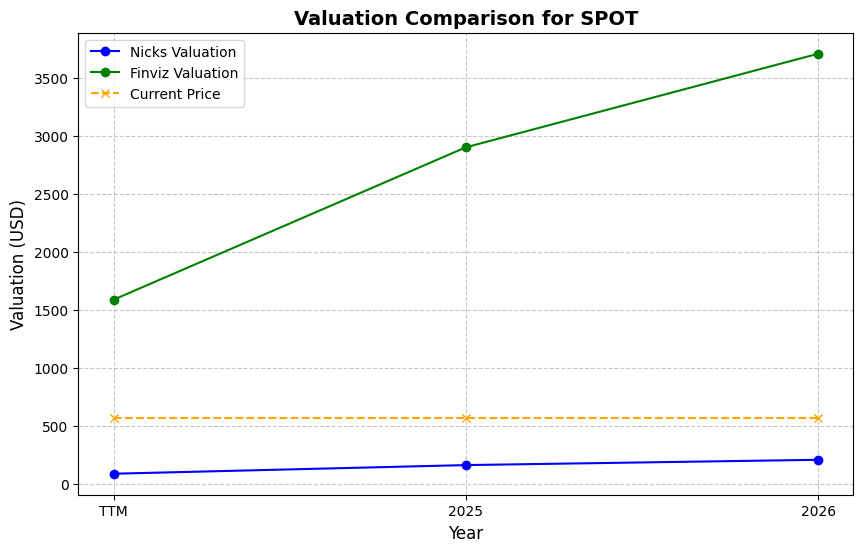
Valuation
| Share Price | Treasury Yield | Estimates | Fair Value (P/E) | Fair Value (P/S) | Current P/S | Current P/E |
|---|---|---|---|---|---|---|
| $497.68 | 4.5% | Nicks Growth: 9% Nick's Expected Margin: 10% FINVIZ Growth: 23% |
Nicks: 16 Finviz: 53 |
Nick's: 1.560 | 5.8 | 33.2 |
| Basis | Year | Nicks Valuation | Nicks vs Share Price | Finviz Valuation | Finviz vs Share Price |
|---|---|---|---|---|---|
| $14.98 EPS | TTM | $233.68 | -53.0% | $795.87 | 59.9% |
| $12.87 EPS | 2026 | $200.70 | -59.7% | $683.53 | 37.3% |
| $15.89 EPS | 2027 | $247.83 | -50.2% | $844.06 | 69.6% |
Implied Growth
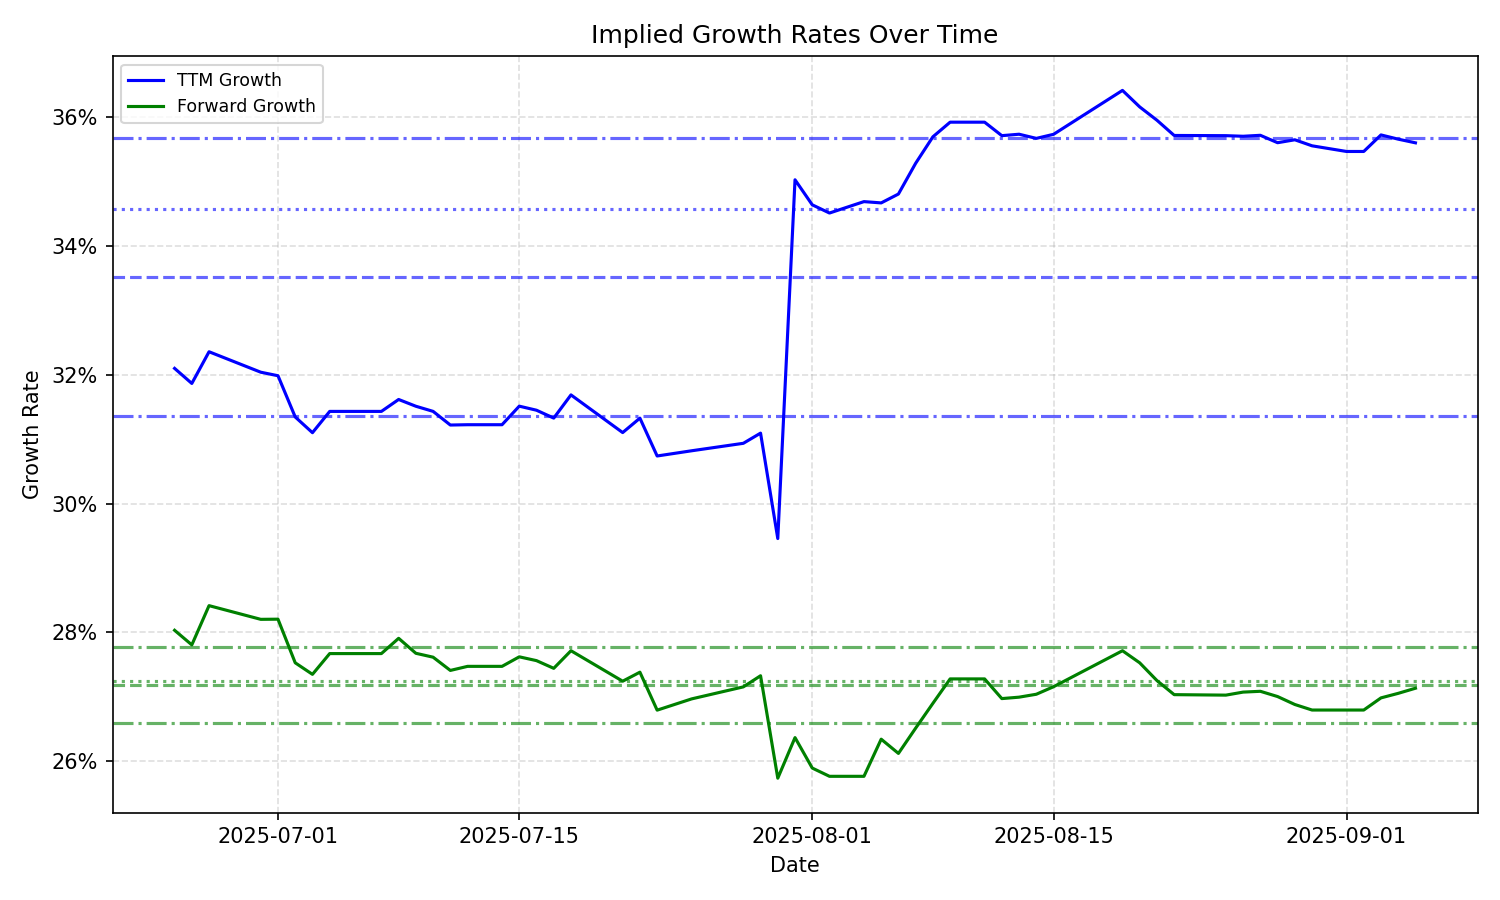
| Average | Median | Std Dev | Current | Percentile | ||||||
|---|---|---|---|---|---|---|---|---|---|---|
| TTM | Forward | TTM | Forward | TTM | Forward | TTM | Forward | TTM | Forward | |
| Timeframe | ||||||||||
| 1 Year | 27.18% | 21.47% | 26.63% | 24.80% | 7.12% | 5.83% | 17.64% | 15.28% | 8.3% | 29.8% |
| 3 Years | 27.18% | 21.47% | 26.63% | 24.80% | 7.12% | 5.83% | 17.64% | 15.28% | 8.3% | 29.8% |
| 5 Years | 27.18% | 21.47% | 26.63% | 24.80% | 7.12% | 5.83% | 17.64% | 15.28% | 8.3% | 29.8% |
| 10 Years | 27.18% | 21.47% | 26.63% | 24.80% | 7.12% | 5.83% | 17.64% | 15.28% | 8.3% | 29.8% |