Snap Inc. — SNAP
| Close Price | Market Cap | P/E Ratio | Forward P/E Ratio | Implied Growth* | Implied Forward Growth* | Dividend | P/B Ratio |
|---|---|---|---|---|---|---|---|
| $5.71 | $9.46B | - | 7.7 | N/A | 1.9% | - | 4.6 |
Latest Headlines
- · KeyBanc Keeps Sector Weight Rating on SNAP
- · Is Meta’s next growth engine subscriptions?
- · Meta (META) Quietly Launches A New Social App
- · Gary Vaynerchuk and District Announce Strategic Partnership
- · META Rides on Solid Momentum in Ad Business: A Sign of More Upside?
- · Wall Street Stays Cautious on Snap Inc. (SNAP) After Earnings, Here’s Why
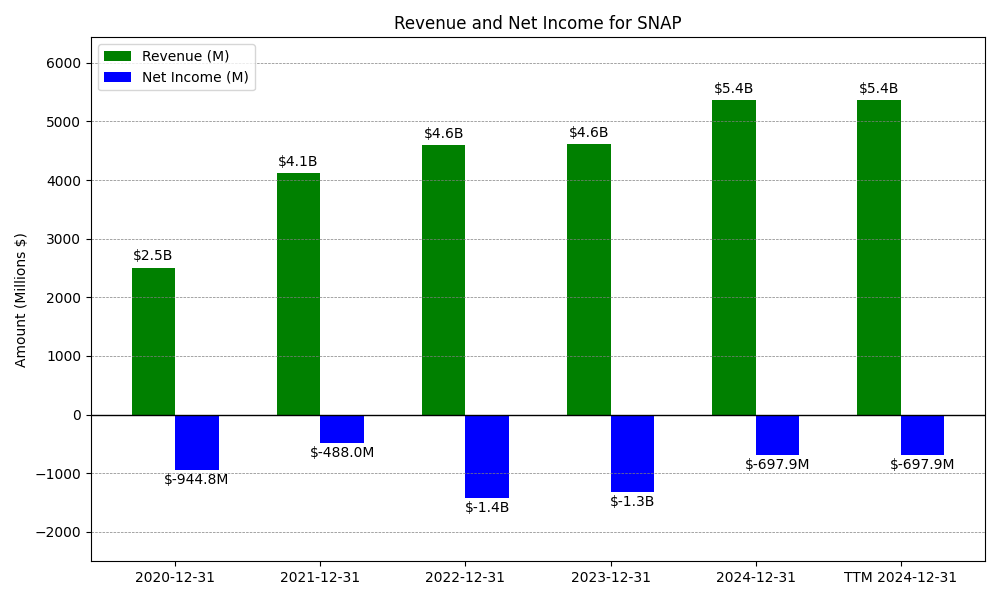
Revenue & Net Income
| Date | Revenue | Net_Income | EPS | Last_Updated | Revenue_Change | Net_Income_Change | EPS_Change | |
|---|---|---|---|---|---|---|---|---|
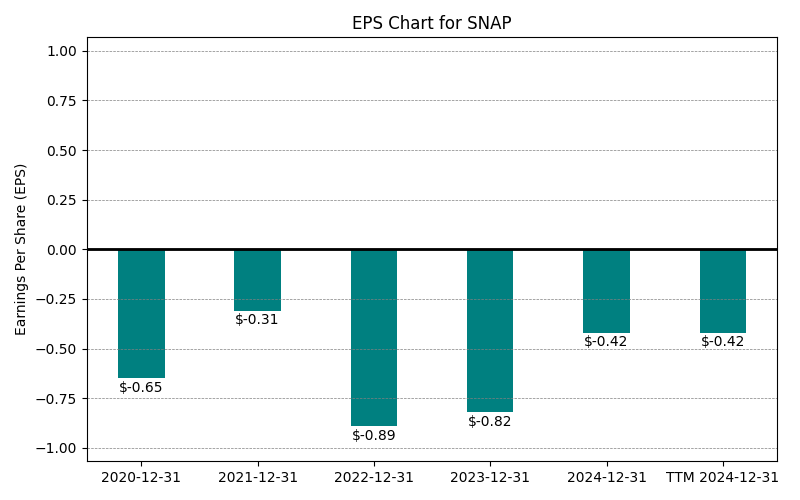
| 0 | 2020-12-31 | $2,507M | $-945M | $-0.65 | 2024-02-03 03:17:10 | N/A | N/A | N/A |
| 1 | 2021-12-31 | $4,117M | $-488M | $-0.31 | 2026-02-06 08:42:20 | 64.2% | -48.4% | -52.3% |
| 2 | 2022-12-31 | $4,602M | $-1,430M | $-0.89 | 2026-05-29 09:14:48 | 11.8% | 193.0% | 187.1% |
| 3 | 2023-12-31 | $4,606M | $-1,322M | $-0.82 | 2026-05-29 09:14:48 | 0.1% | -7.5% | -7.9% |
| 4 | 2024-12-31 | $5,361M | $-698M | $-0.42 | 2026-05-29 09:14:48 | 16.4% | -47.2% | -48.8% |
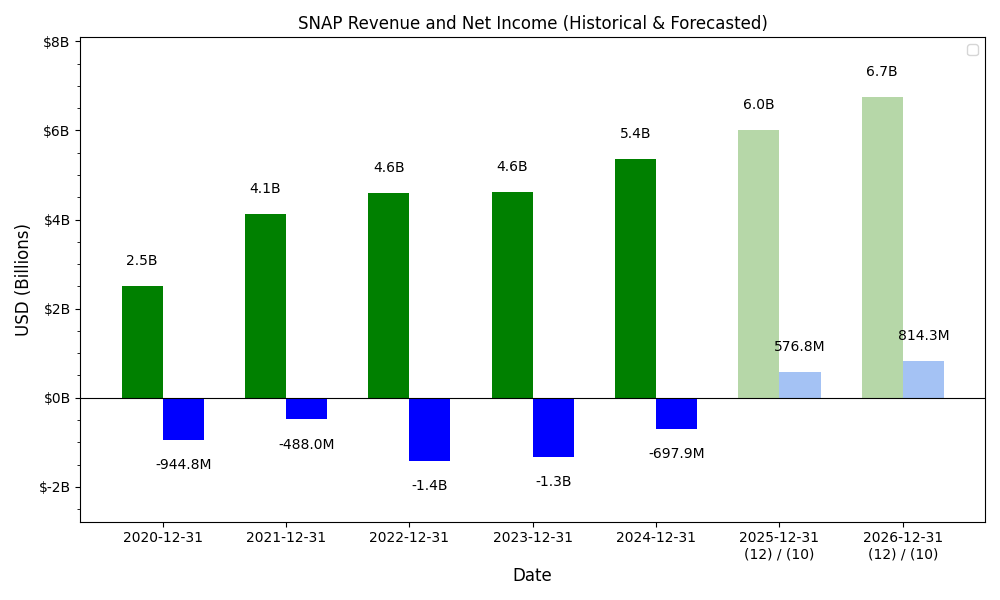
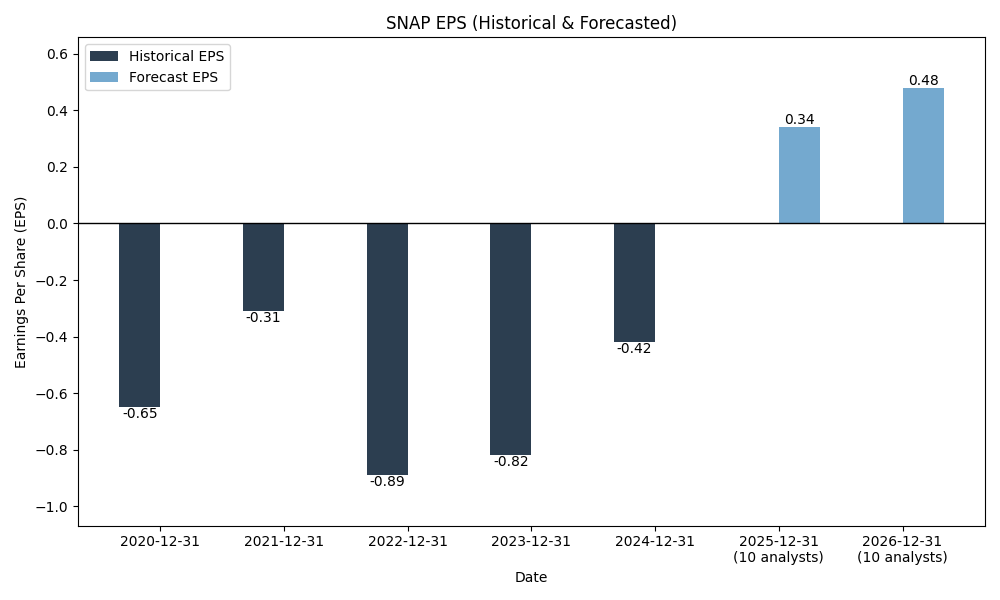
| 5 | 2025-12-31 | $5,931M | $-460M | $-0.27 | 2026-05-29 09:14:48 | 10.6% | -34.0% | -35.7% |
| 6 | TTM 2026-03-31 | $6,097M | $-410M | $-0.24 | 2026-05-11 09:15:32 | 2.8% | -11.0% | -11.1% |
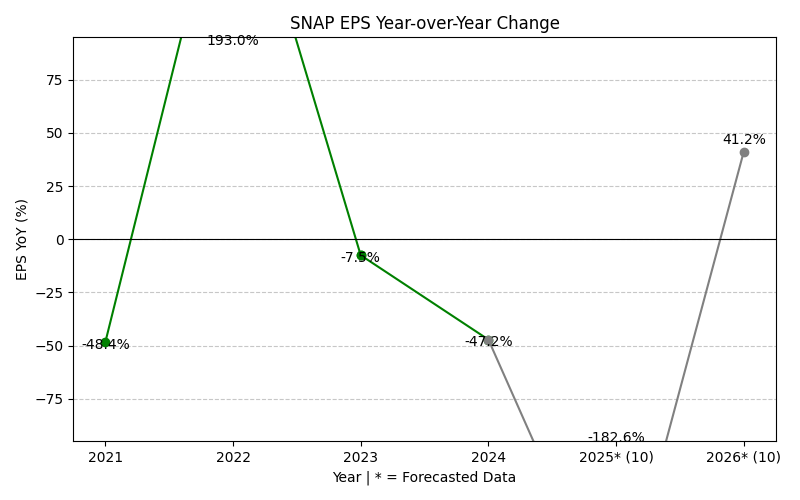
EPS
Forecasts
Y/Y % Change
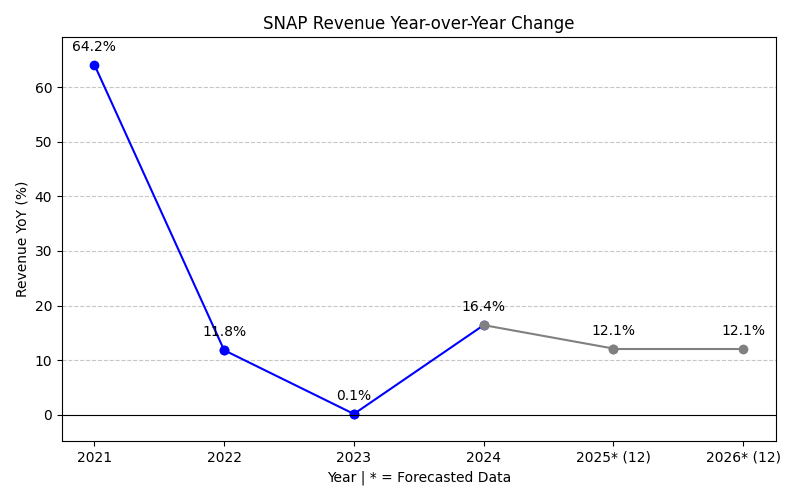
SNAP Year-over-Year Growth
| 2020 | 2021 | 2022 | 2023 | 2024 | 2025 | 2026 | 2027 | Average | |
|---|---|---|---|---|---|---|---|---|---|
| Revenue Growth (%) | 64.2% | 11.8% | 0.1% | 16.4% | 10.6% | 12.9% | 9.7% | 18.0% | |
| Revenue Analysts (#) | 0 | 0 | 0 | 0 | 0 | 0 | 40 | 40 | |
| EPS Growth (%) | -48.4% | 193.0% | -7.5% | -47.2% | -34.0% | -63.1% | -202.1% | -29.9% | |
| EPS Analysts (#) | 0 | 0 | 0 | 0 | 0 | 0 | 31 | 36 |
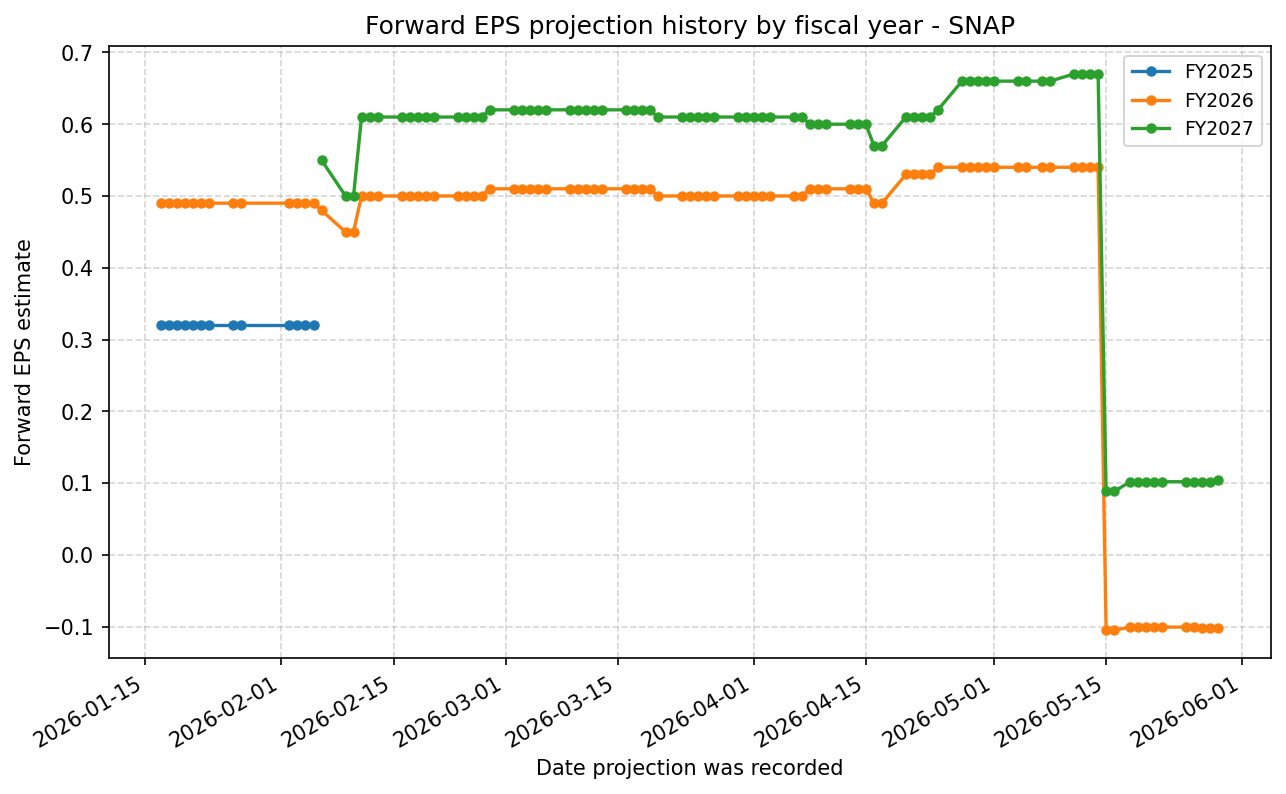
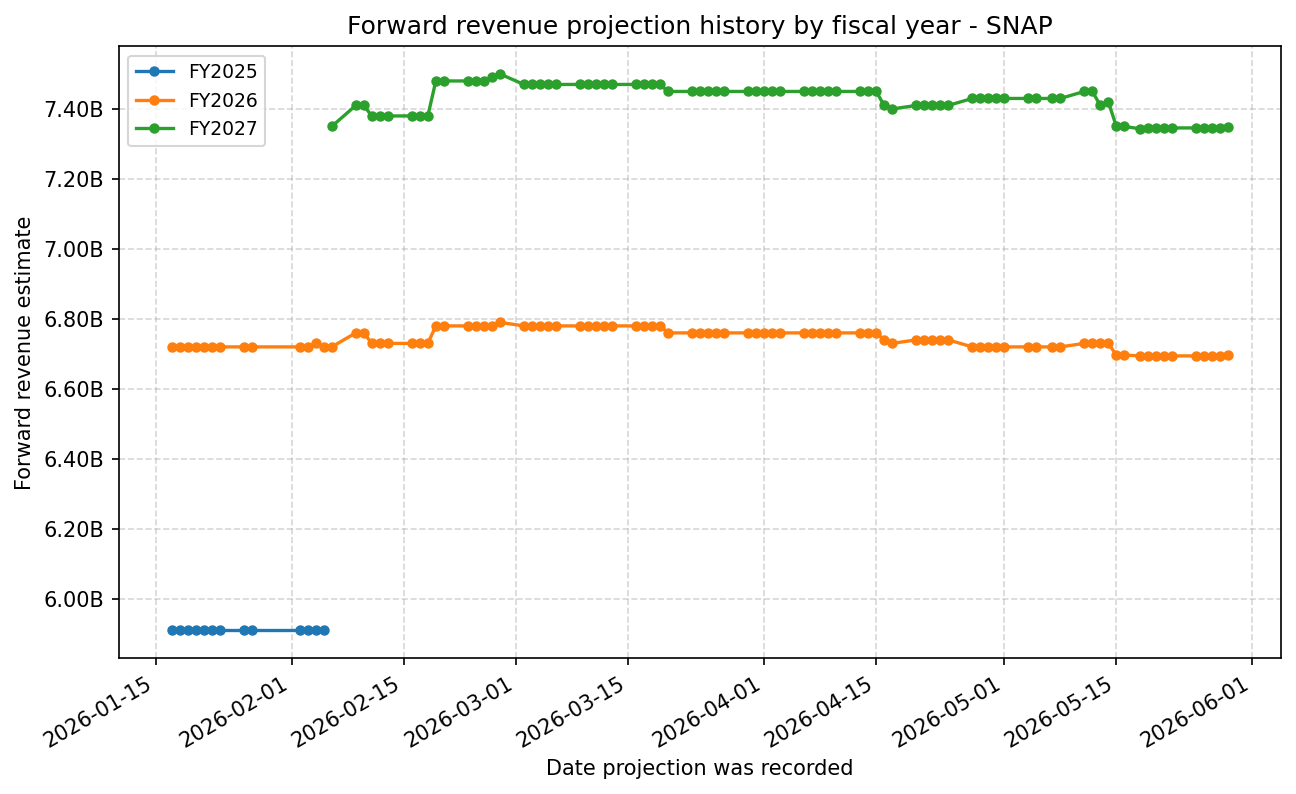
Forward Estimate History
How the next-FY EPS and revenue estimates have drifted over time. One line per fiscal year – past lines end when that FY became current.
Expenses
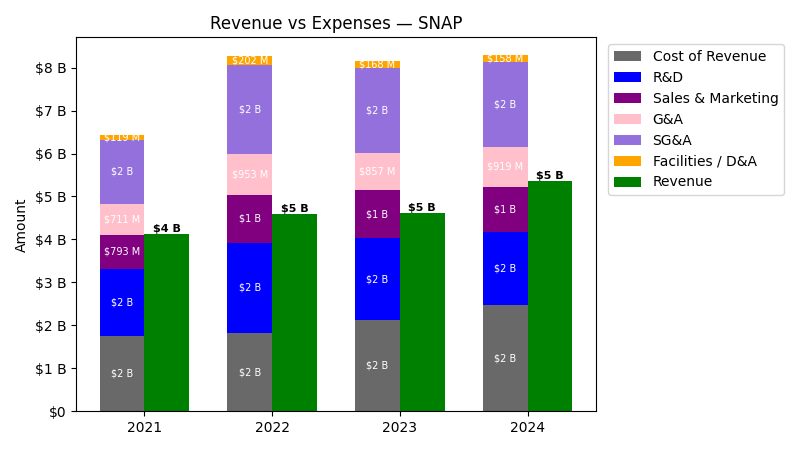
| Year | Revenue ($) | Cost of Revenue ($) | R&D ($) | Sales & Marketing ($) | G&A ($) | SG&A ($) | Facilities / D&A ($) |
|---|---|---|---|---|---|---|---|
| 2021 | $4.1B | $1.6B | $1.6B | $792.8M | $710.6M | $1.5B | $119.1M |
| 2022 | $4.6B | $1.6B | $2.1B | $1.1B | $953.3M | $2.1B | $202.2M |
| 2023 | $4.6B | $1.9B | $1.9B | $1.1B | $857.4M | $2.0B | $168.4M |
| 2024 | $5.4B | $2.3B | $1.7B | $1.1B | $919.1M | $2.0B | $158.1M |
| 2025 | $5.9B | $2.5B | $1.8B | $1.0B | $979.1M | $2.0B | $163.6M |
| TTM | $6.1B | $2.5B | $1.8B | $1.0B | $973.1M | $2.0B | $170.6M |
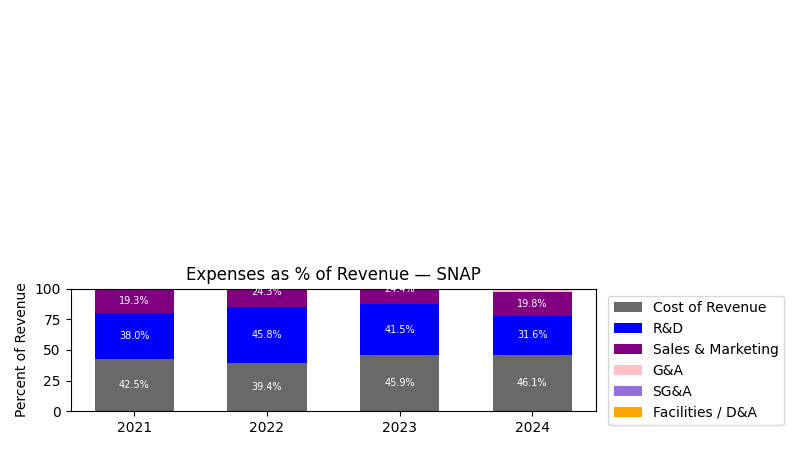
| Year | Revenue Change (%) | Cost of Revenue Change (%) | R&D Change (%) | Sales & Marketing Change (%) | G&A Change (%) | SG&A Change (%) | Facilities / D&A Change (%) |
|---|---|---|---|---|---|---|---|
| 2022 | 11.78 | -1.10 | 34.77 | 41.12 | 34.14 | 37.82 | 69.69 |
| 2023 | 0.09 | 20.61 | -9.43 | 0.30 | -10.05 | -4.46 | -16.68 |
| 2024 | 16.40 | 19.04 | -11.47 | -5.21 | 7.19 | 0.16 | -6.15 |
| 2025 | 10.63 | 8.19 | 6.02 | -3.98 | 6.53 | 0.89 | 3.52 |
| TTM | 2.79 | -1.56 | 3.02 | -1.53 | -0.62 | -1.09 | 4.27 |
No unmapped expenses.
Segment Performance
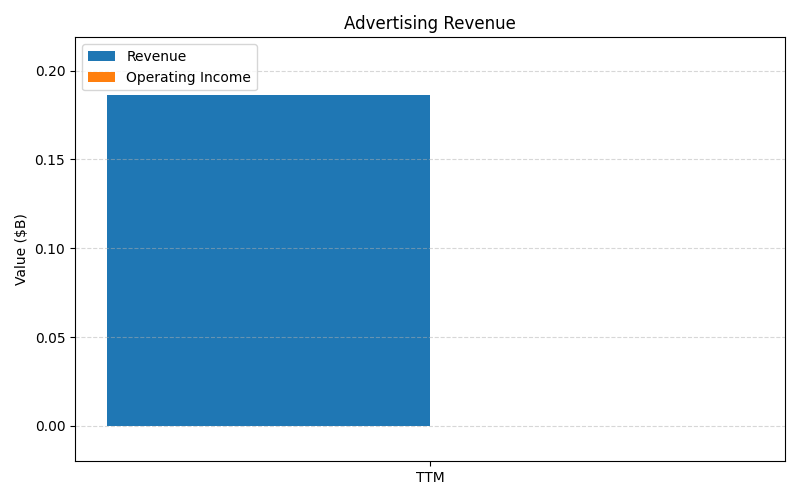
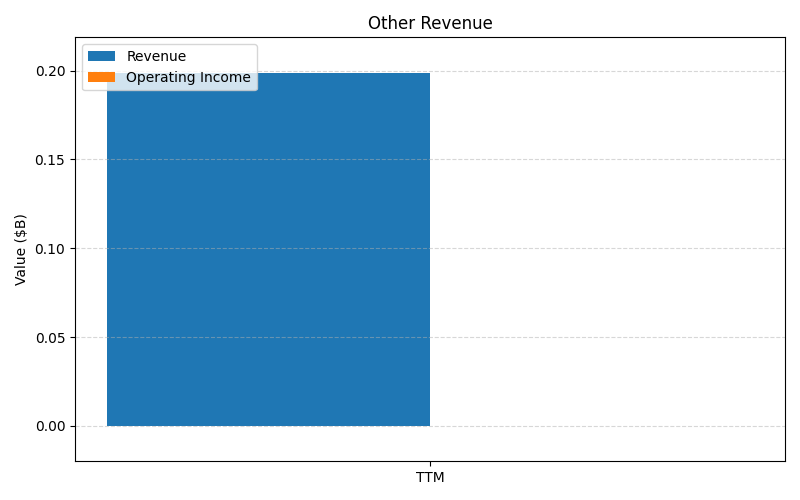
SEGMENTS v2025-09-09 · 2026-05-29 09:14 UTC — Units: $B. Rows list fiscal years (last 3 + TTM) with revenue for each segment; the final row shows the TTM revenue mix (operating income columns display “—” where mix is not applicable).
| Year | Advertising Revenue Rev | Other Revenue Rev | Total Rev |
|---|---|---|---|
| 2023 | 4.41B | 0.20B | 4.61B |
| 2024 | 4.90B | 0.46B | 5.36B |
| 2025 | 5.19B | 0.75B | 5.93B |
| TTM | 12.5B | 1.64B | 14.2B |
| % of Total (TTM) | 88.4% | 11.6% | 100% |
Balance Sheet
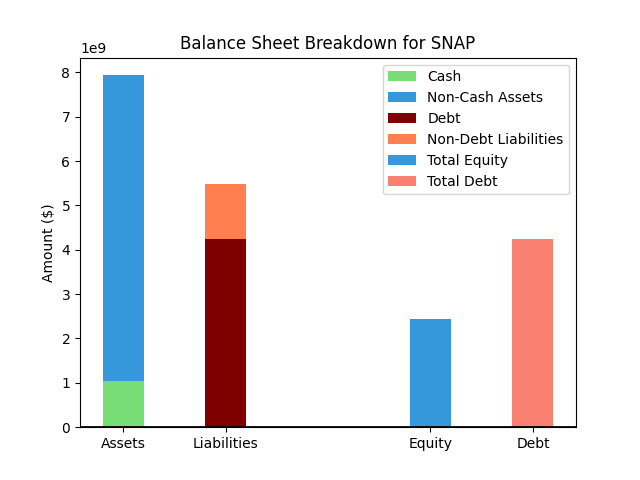
| Metric | Value | |
|---|---|---|
| 0 | Total Assets | $7,502M |
| 1 | Cash | $1,062M |
| 2 | Total Liabilities | $5,417M |
| 3 | Total Debt | $4,202M |
| 4 | Total Equity | $2,084M |
| 5 | Debt to Equity Ratio | 2.02 |
EPS & Dividend

Valuation
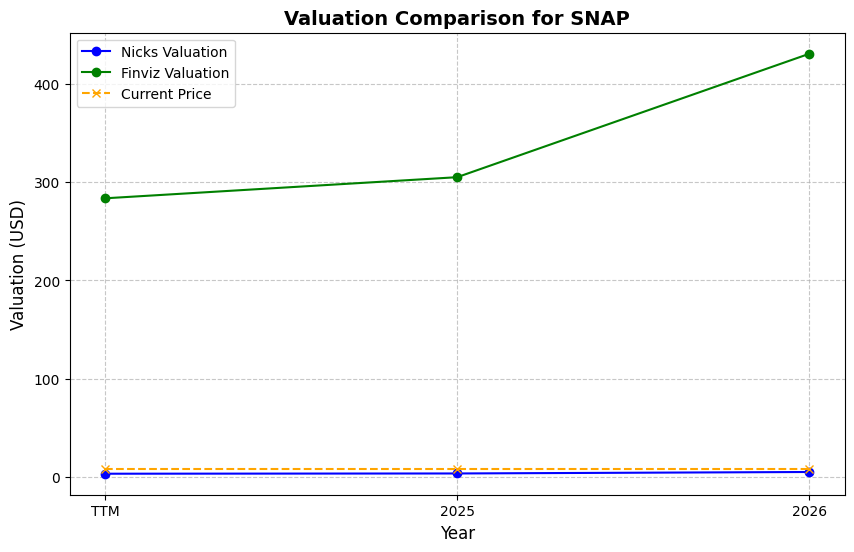
| Share Price | Treasury Yield | Estimates | Fair Value (P/E) | Fair Value (P/S) | Current P/S | Current P/E |
|---|---|---|---|---|---|---|
| $5.71 | 4.5% | Nicks Growth: 5% Nick's Expected Margin: 10% FINVIZ Growth: 42% |
Nicks: 11 Finviz: 249 |
Nick's: 1.056 | 1.6 | - |
| Basis | Year | Nicks Valuation | Nicks vs Share Price | Finviz Valuation | Finviz vs Share Price |
|---|---|---|---|---|---|
| $3.68 Revenue | TTM | $3.89 | -32.0% | $91.74 | 1506.7% |
| $4.04 Revenue | 2026 | $4.27 | -25.3% | $100.75 | 1664.4% |
| $0.10 EPS | 2027 | $1.11 | -80.6% | $26.10 | 357.1% |
Implied Growth
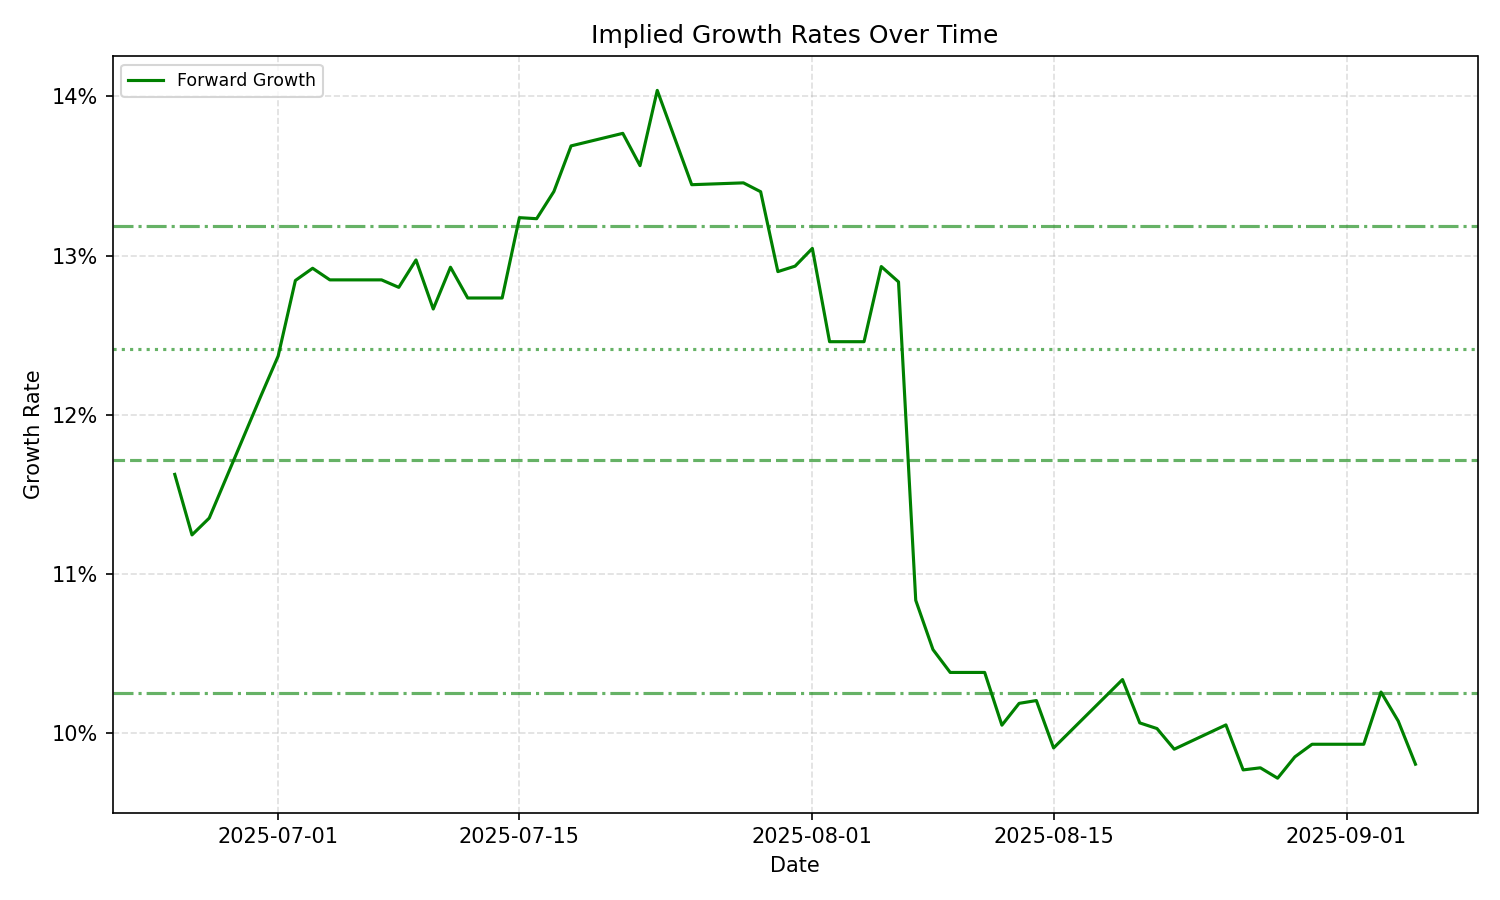
| Average | Median | Std Dev | Current | Percentile | ||||||
|---|---|---|---|---|---|---|---|---|---|---|
| TTM | Forward | TTM | Forward | TTM | Forward | TTM | Forward | TTM | Forward | |
| Timeframe | ||||||||||
| 1 Year | – | 8.00% | – | 9.94% | – | 4.20% | – | 2.22% | – | 17.8% |
| 3 Years | – | 8.00% | – | 9.94% | – | 4.20% | – | 2.22% | – | 17.8% |
| 5 Years | – | 8.00% | – | 9.94% | – | 4.20% | – | 2.22% | – | 17.8% |
| 10 Years | – | 8.00% | – | 9.94% | – | 4.20% | – | 2.22% | – | 17.8% |