Shopify Inc. — SHOP
| Close Price | Market Cap | P/E Ratio | Forward P/E Ratio | Implied Growth* | Implied Forward Growth* | Dividend | P/B Ratio |
|---|---|---|---|---|---|---|---|
| $118.71 | $154.04B | 116.4 | 50.9 | 32.3% | 22.1% | - | 12.4 |
Latest Headlines
- · Shopify POS business seen adding to gross merchandise value, profit growth over next decade, says UBS
- · Reddit integration with Shopify seen driving ad growth, adoption
- · Exploring 3 High Growth Tech Stocks In The US Market
- · Ankur Jain says Bilt is building the ‘Shopify for housing’—and the company’s card is only the beginning
- · Why Shopify (SHOP) Stock Is Up Today
- · Intuit Expands Mailchimp AI Tools And Integrations For Small Business Growth
Revenue & Net Income
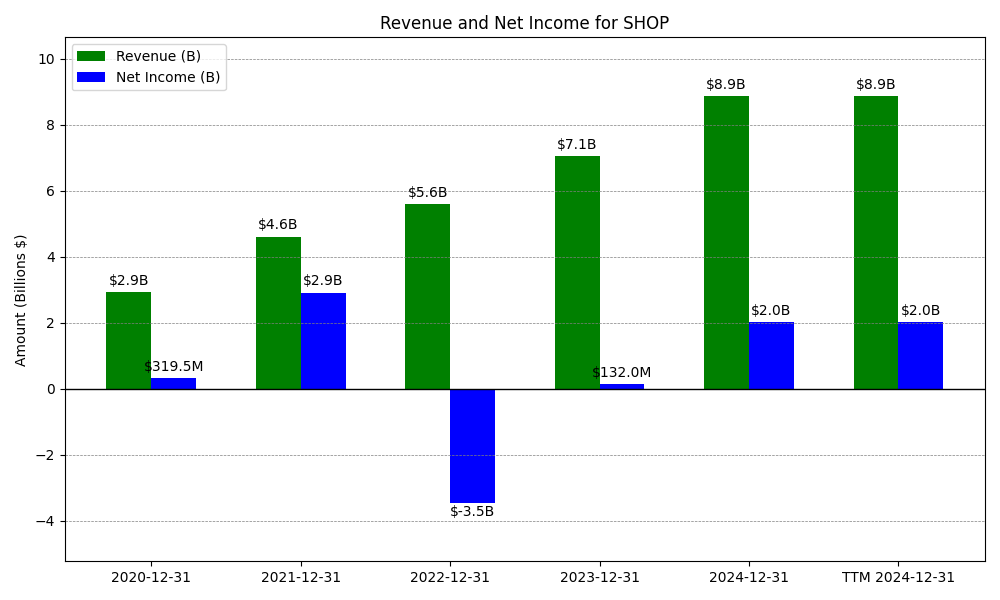
| Date | Revenue | Net_Income | EPS | Last_Updated | Revenue_Change | Net_Income_Change | EPS_Change | |
|---|---|---|---|---|---|---|---|---|
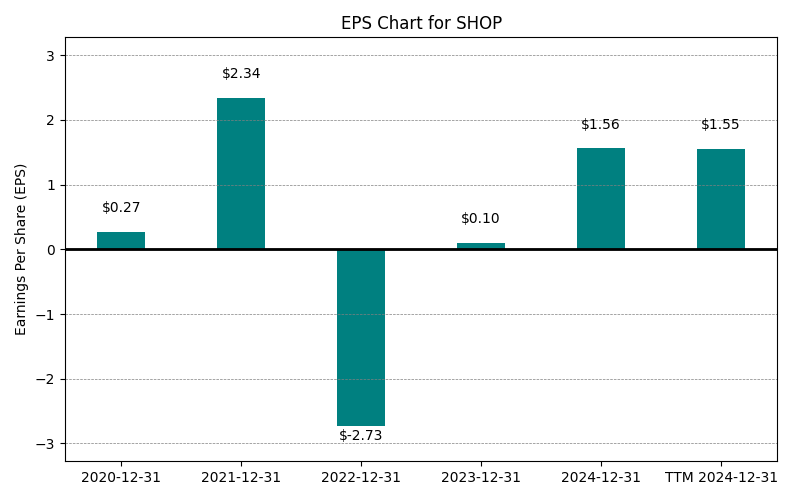
| 0 | 2020-12-31 | $2,929M | $320M | $0.27 | 2024-05-08 21:43:24 | N/A | N/A | N/A |
| 1 | 2021-12-31 | $5,600M | $-3,460M | $2.34 | 2026-05-29 09:14:42 | 91.2% | -1182.9% | 775.7% |
| 2 | 2022-12-31 | $5,600M | $-3,460M | $-2.73 | 2026-05-29 09:14:42 | 0.0% | 0.0% | -216.8% |
| 3 | 2023-12-31 | $7,060M | $132M | $0.10 | 2026-05-29 09:14:42 | 26.1% | -103.8% | -103.7% |
| 4 | 2024-12-31 | $8,880M | $2,019M | $1.56 | 2026-05-29 09:14:42 | 25.8% | 1429.5% | 1459.6% |
| 5 | 2025-12-31 | $11,556M | $1,231M | $1.56 | 2026-05-29 09:14:42 | 30.1% | -39.0% | 0.0% |
| 6 | TTM 2026-03-31 | $12,366M | $1,332M | $1.02 | 2026-05-11 09:15:26 | 7.0% | 8.2% | -34.6% |
EPS
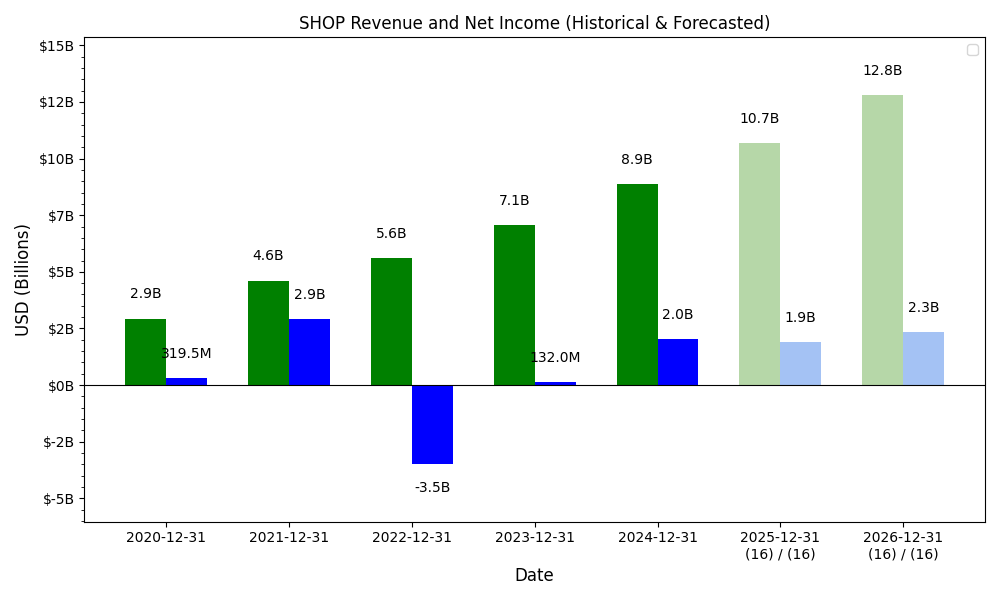
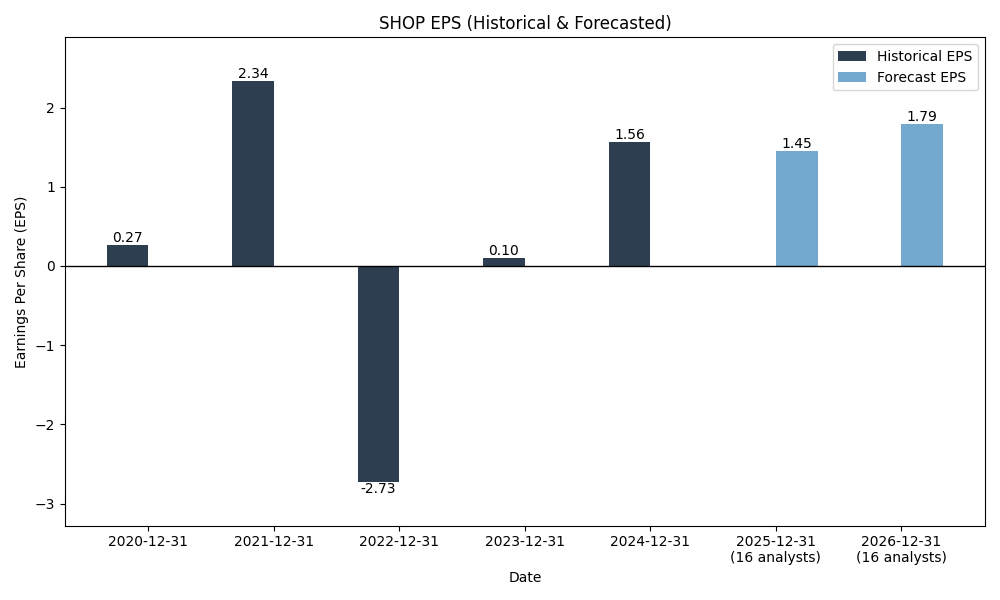
Forecasts
Y/Y % Change
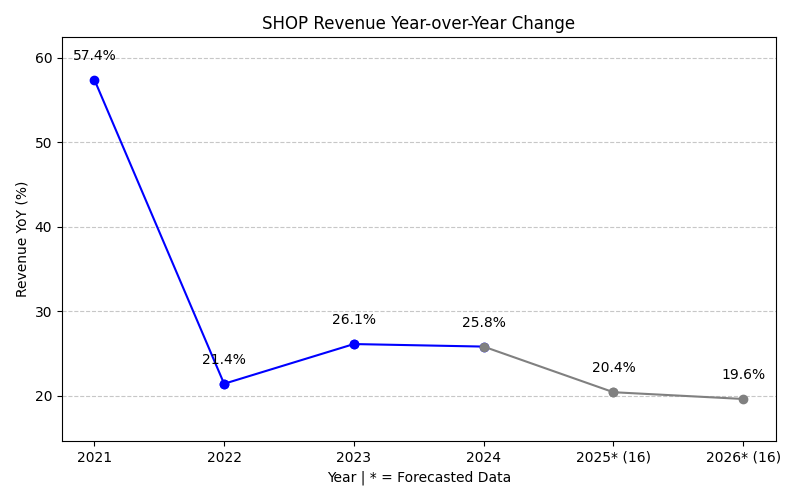
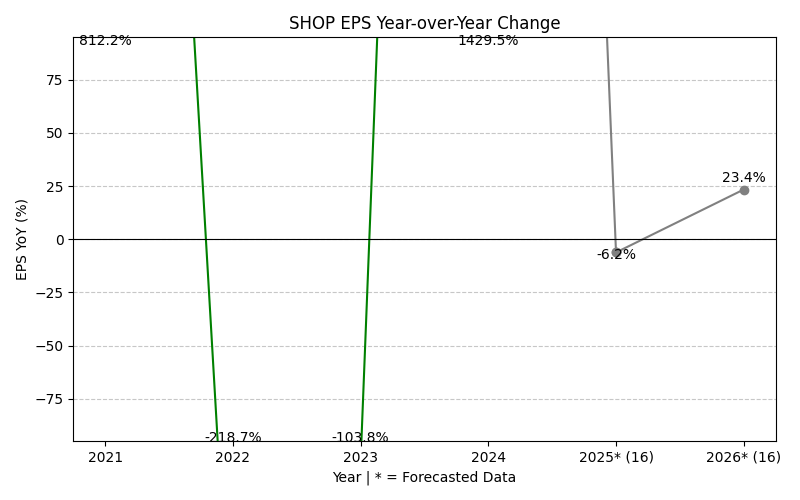
SHOP Year-over-Year Growth
| 2020 | 2021 | 2022 | 2023 | 2024 | 2025 | 2026 | 2027 | Average | |
|---|---|---|---|---|---|---|---|---|---|
| Revenue Growth (%) | 91.2% | 0.0% | 26.1% | 25.8% | 30.1% | 28.0% | 23.8% | 32.1% | |
| Revenue Analysts (#) | 0 | 0 | 0 | 0 | 0 | 0 | 44 | 45 | |
| EPS Growth (%) | -1182.9% | 0.0% | -103.8% | 1429.5% | -39.0% | 93.6% | 27.0% | 32.1% | |
| EPS Analysts (#) | 0 | 0 | 0 | 0 | 0 | 0 | 40 | 38 |
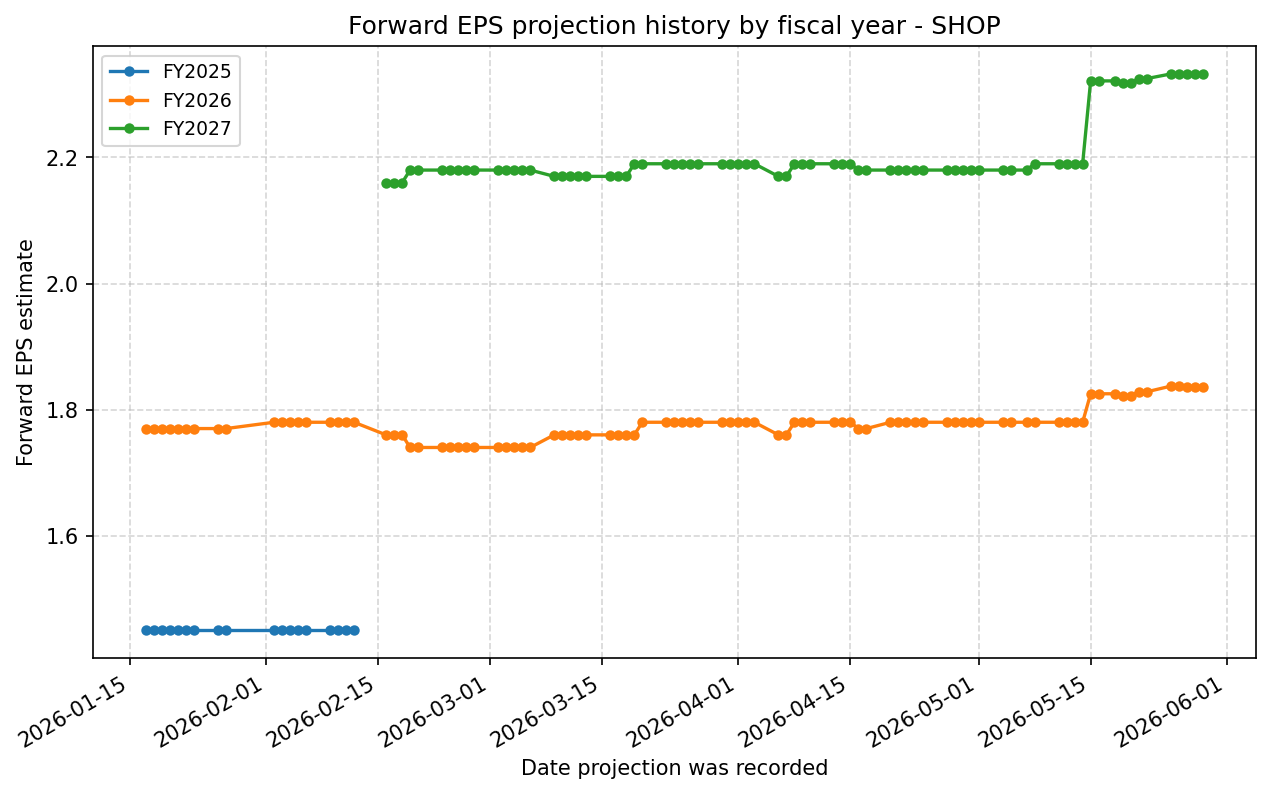
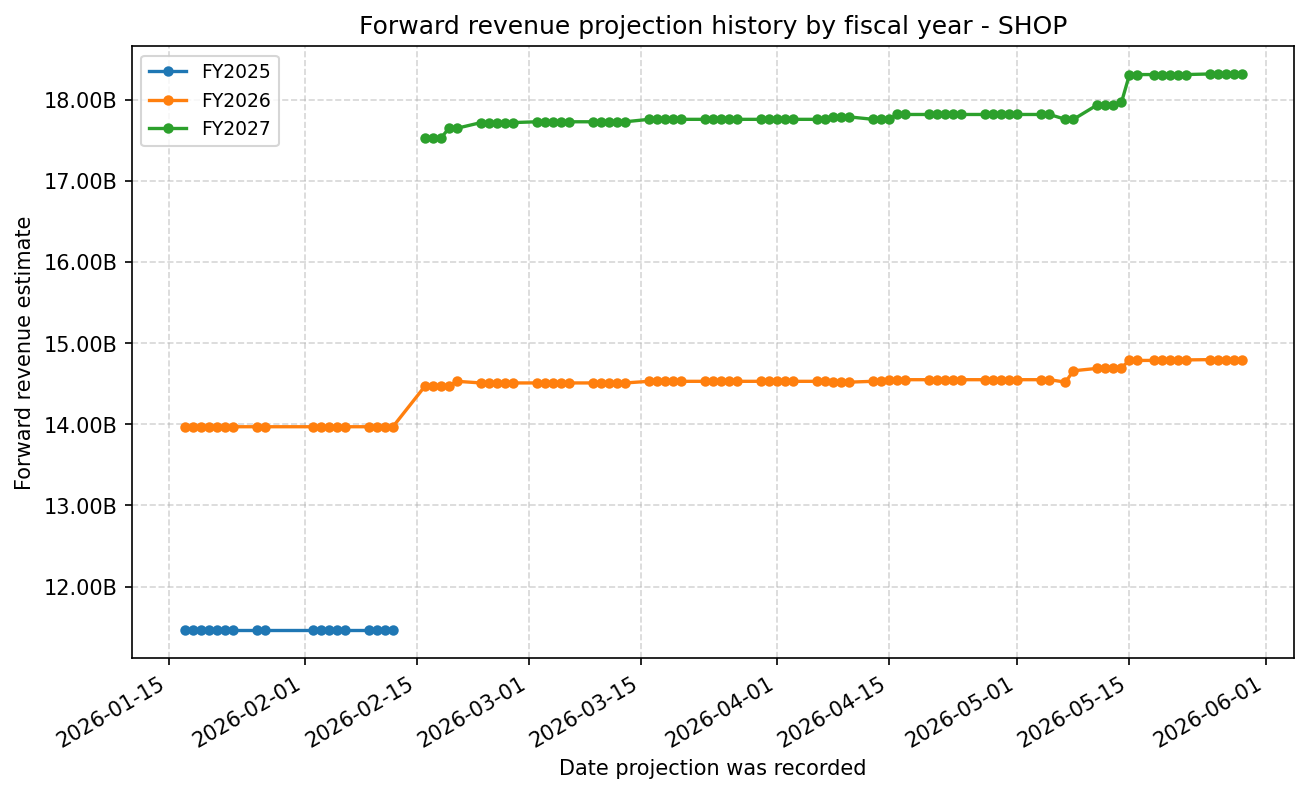
Forward Estimate History
How the next-FY EPS and revenue estimates have drifted over time. One line per fiscal year – past lines end when that FY became current.
Expenses
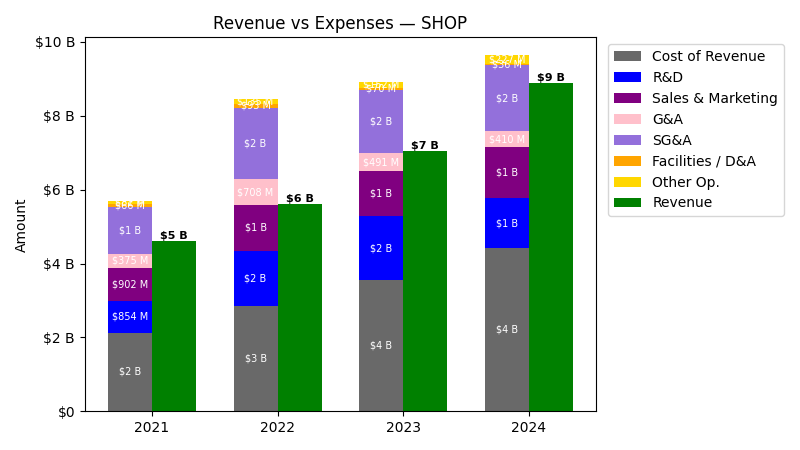
| Year | Revenue ($) | Cost of Revenue ($) | R&D ($) | Sales & Marketing ($) | G&A ($) | SG&A ($) | Facilities / D&A ($) |
|---|---|---|---|---|---|---|---|
| 2022 | $5.6B | $2.8B | $1.5B | $1.2B | $708.0M | $1.9B | $93.0M |
| 2023 | $7.1B | $3.5B | $1.7B | $1.2B | $491.0M | $1.7B | $70.0M |
| 2024 | $8.9B | $4.4B | $1.4B | $1.4B | $410.0M | $1.8B | $36.0M |
| 2025 | $11.6B | $6.0B | $1.5B | $1.7B | $471.0M | $2.1B | $31.0M |
| TTM | $12.4B | $6.4B | $1.6B | $1.8B | $477.0M | $2.2B | $30.0M |
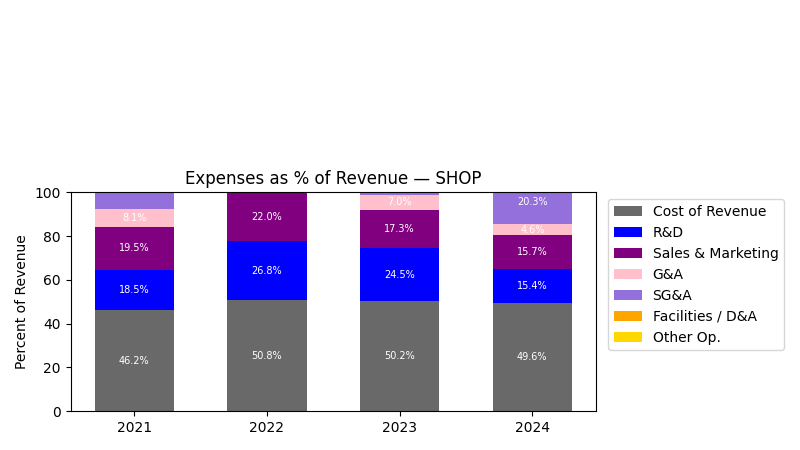
| Year | Revenue Change (%) | Cost of Revenue Change (%) | R&D Change (%) | Sales & Marketing Change (%) | G&A Change (%) | SG&A Change (%) | Facilities / D&A Change (%) |
|---|---|---|---|---|---|---|---|
| 2023 | 26.07 | 26.23 | 15.10 | -0.81 | -30.65 | -11.71 | -24.73 |
| 2024 | 25.78 | 25.81 | -20.98 | 14.18 | -16.50 | 5.38 | -48.57 |
| 2025 | 30.14 | 36.55 | 12.36 | 19.38 | 14.88 | 18.36 | -13.89 |
| TTM | 7.01 | 7.27 | 3.91 | 5.47 | 1.27 | 4.55 | -3.23 |
No unmapped expenses.
Segment Performance
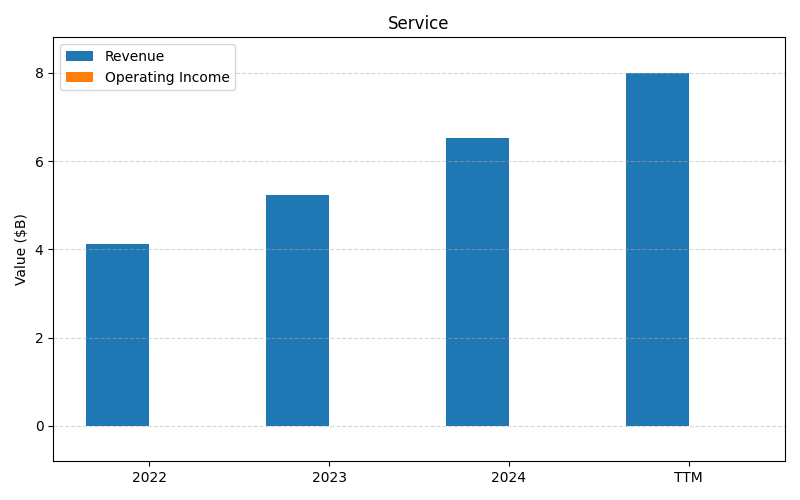
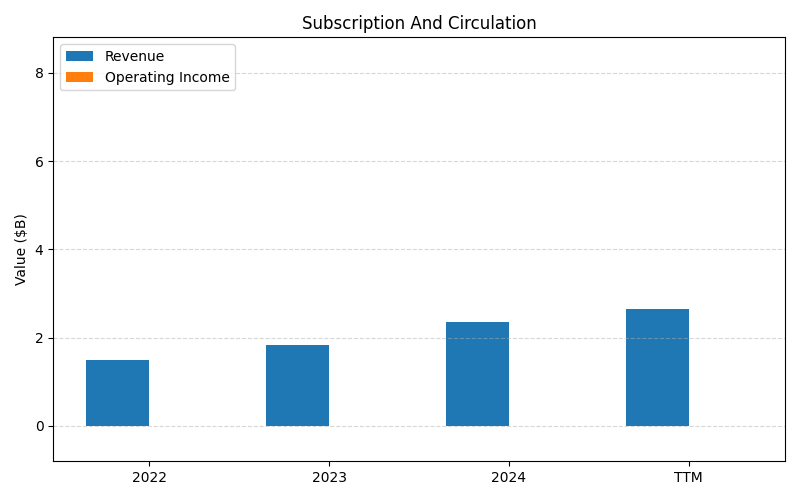
SEGMENTS v2025-09-09 · 2026-05-29 09:14 UTC — Units: $B. Rows list fiscal years (last 3 + TTM) with revenue for each segment; the final row shows the TTM revenue mix (operating income columns display “—” where mix is not applicable).
| Year | Services Rev | Subscription And Circulation Rev | Total Rev |
|---|---|---|---|
| 2023 | 5.22B | 1.84B | 7.06B |
| 2024 | 6.53B | 2.35B | 8.88B |
| 2025 | 8.80B | 2.75B | 11.6B |
| TTM | 19.5B | 6.47B | 26B |
| % of Total (TTM) | 75.1% | 24.9% | 100% |
Balance Sheet
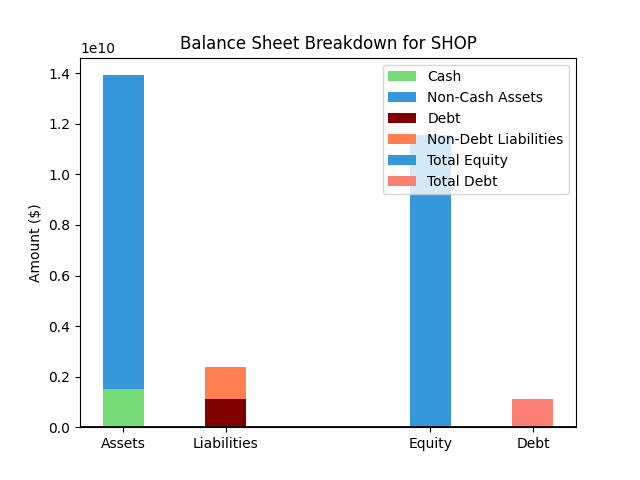
| Metric | Value | |
|---|---|---|
| 0 | Total Assets | $14,121M |
| 1 | Cash | $1,848M |
| 2 | Total Liabilities | $1,620M |
| 3 | Total Debt | $179M |
| 4 | Total Equity | $12,501M |
| 5 | Debt to Equity Ratio | 0.01 |
EPS & Dividend

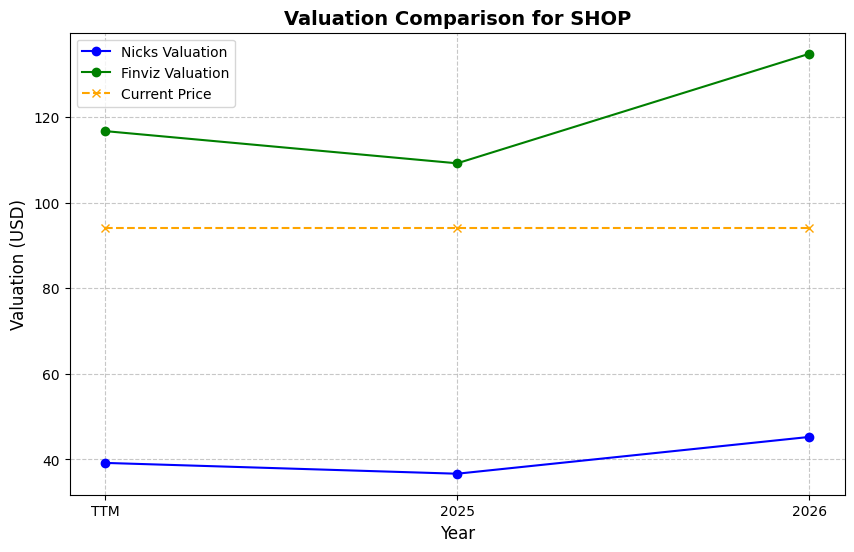
Valuation
| Share Price | Treasury Yield | Estimates | Fair Value (P/E) | Fair Value (P/S) | Current P/S | Current P/E |
|---|---|---|---|---|---|---|
| $118.71 | 4.5% | Nicks Growth: 14% Nick's Expected Margin: 10% FINVIZ Growth: 31% |
Nicks: 25 Finviz: 102 |
Nick's: 2.489 | 12.5 | 116.4 |
| Basis | Year | Nicks Valuation | Nicks vs Share Price | Finviz Valuation | Finviz vs Share Price |
|---|---|---|---|---|---|
| $1.02 EPS | TTM | $25.39 | -78.6% | $104.25 | -12.2% |
| $1.84 EPS | 2026 | $45.71 | -61.5% | $187.70 | 58.1% |
| $2.33 EPS | 2027 | $58.04 | -51.1% | $238.31 | 100.8% |
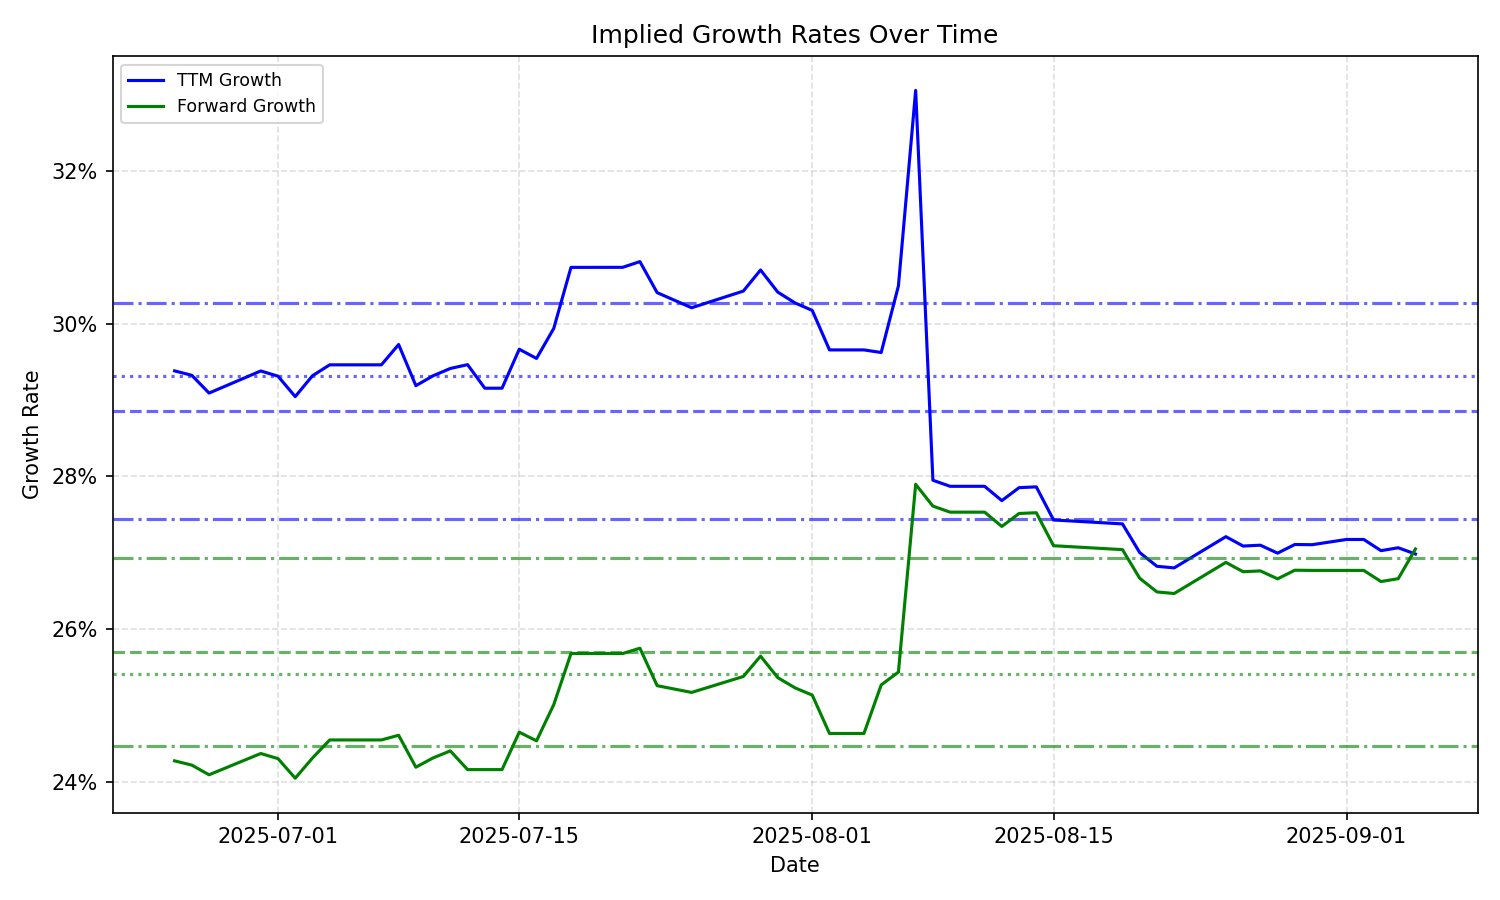
Implied Growth
| Average | Median | Std Dev | Current | Percentile | ||||||
|---|---|---|---|---|---|---|---|---|---|---|
| TTM | Forward | TTM | Forward | TTM | Forward | TTM | Forward | TTM | Forward | |
| Timeframe | ||||||||||
| 1 Year | 30.57% | 25.46% | 30.57% | 26.59% | 2.28% | 2.70% | 31.87% | 21.76% | 64.4% | 11.3% |
| 3 Years | 30.57% | 25.46% | 30.57% | 26.59% | 2.28% | 2.70% | 31.87% | 21.76% | 64.4% | 11.3% |
| 5 Years | 30.57% | 25.46% | 30.57% | 26.59% | 2.28% | 2.70% | 31.87% | 21.76% | 64.4% | 11.3% |
| 10 Years | 30.57% | 25.46% | 30.57% | 26.59% | 2.28% | 2.70% | 31.87% | 21.76% | 64.4% | 11.3% |