Charles Schwab Corporation (The — SCHW
| Close Price | Market Cap | P/E Ratio | Forward P/E Ratio | Implied Growth* | Implied Forward Growth* | Dividend | P/B Ratio |
|---|---|---|---|---|---|---|---|
| $87.35 | $151.91B | 17.4 | 12.1 | 10.1% | 6.4% | $1.28 1.5% | 3.6 |
Latest Headlines
- · HOOD Stock Retreats After 2025 Rally: Should You Stay Invested?
- · Schwab’s Beatty Says Expanding Wealth Advice Not at Risk of ‘Bumping Into’ RIAs
- · HOOD Brings AI Agents to Trading and Spending: Opportunity or Risk?
- · “Municipal Bonds Belong in Taxable Accounts,” Say Charles Schwab Investment Experts
- · Robinhood Launches AI Stock Trading, Purchases on Credit Cards
- · Charles Schwab Foundation Launches Schwab Moneywise Momentum Grants as Part of a $20 Million Multi-Year Commitment to Financial Education
Revenue & Net Income
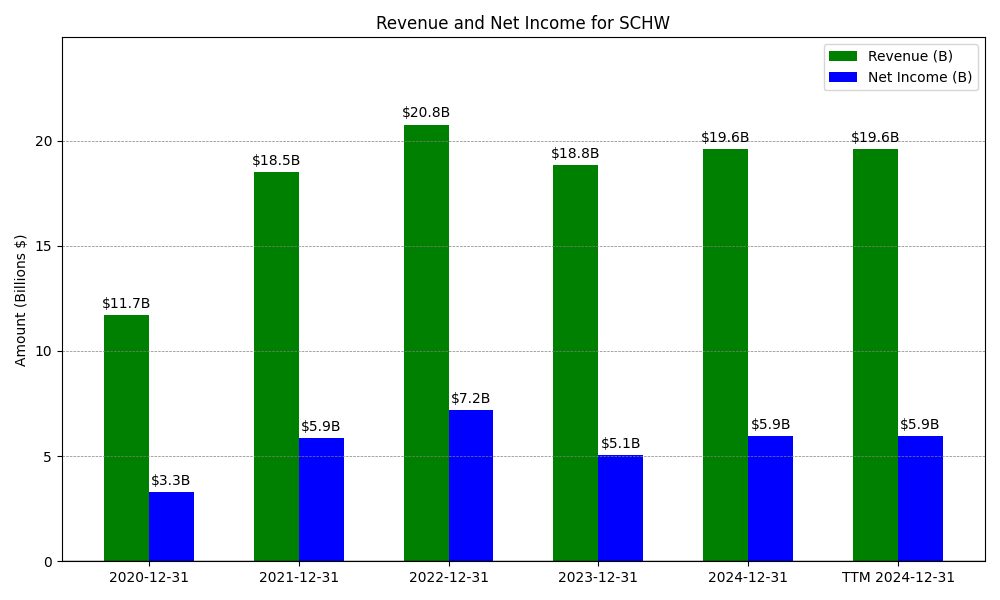
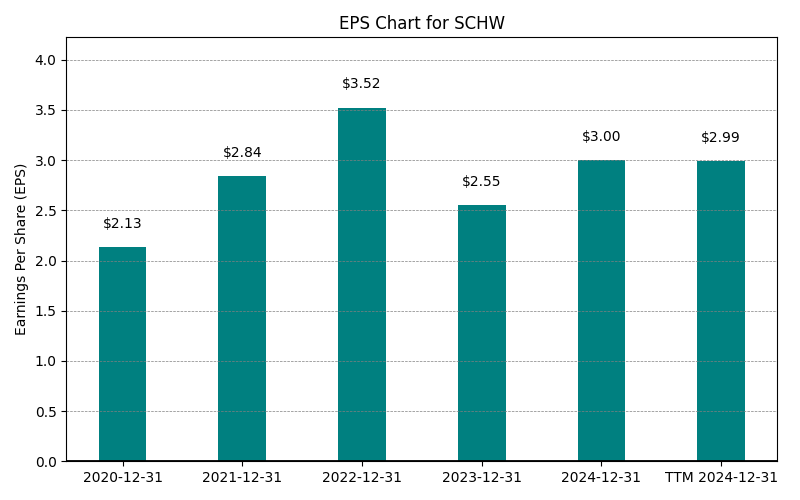
| Date | Revenue | Net_Income | EPS | Last_Updated | Revenue_Change | Net_Income_Change | EPS_Change | |
|---|---|---|---|---|---|---|---|---|
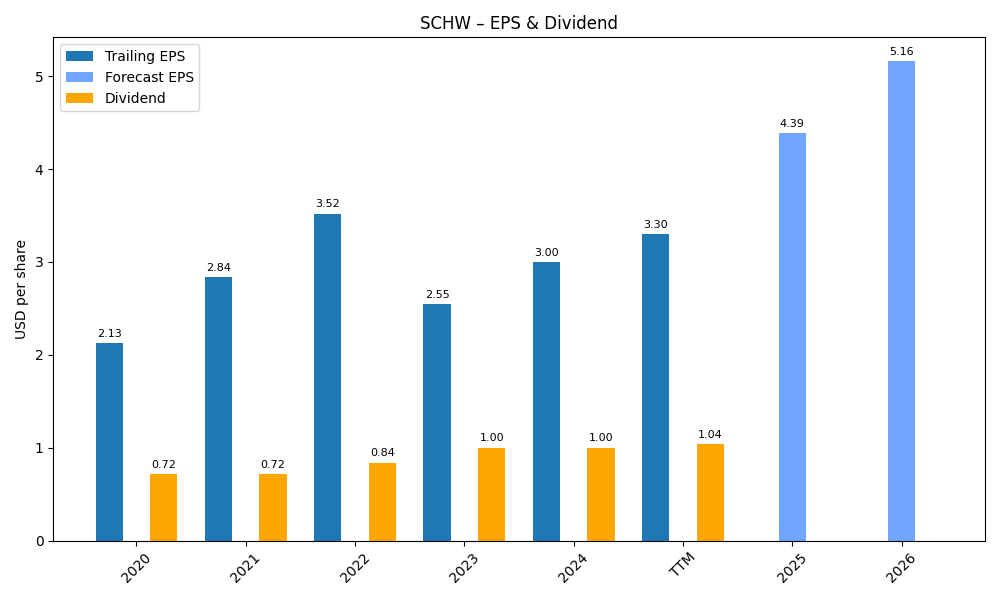
| 0 | 2020-12-31 | $11,691M | $3,299M | $2.13 | 2024-02-03 03:17:10 | N/A | N/A | N/A |
| 1 | 2021-12-31 | $18,520M | $5,855M | $3.52 | 2026-03-05 08:41:26 | 58.4% | 77.5% | 65.3% |
| 2 | 2022-12-31 | $20,762M | $7,183M | $3.52 | 2026-05-29 09:14:32 | 12.1% | 22.7% | 0.0% |
| 3 | 2023-12-31 | $18,837M | $5,067M | $2.55 | 2026-05-29 09:14:32 | -9.3% | -29.5% | -27.6% |
| 4 | 2024-12-31 | $19,606M | $5,942M | $3.00 | 2026-05-29 09:14:32 | 4.1% | 17.3% | 17.6% |
| 5 | 2025-12-31 | $23,921M | $8,852M | $4.67 | 2026-05-29 09:14:32 | 22.0% | 49.0% | 55.7% |
| 6 | TTM 2026-03-31 | $24,804M | $9,422M | $5.03 | 2026-04-20 08:53:27 | 3.7% | 6.4% | 7.7% |
EPS
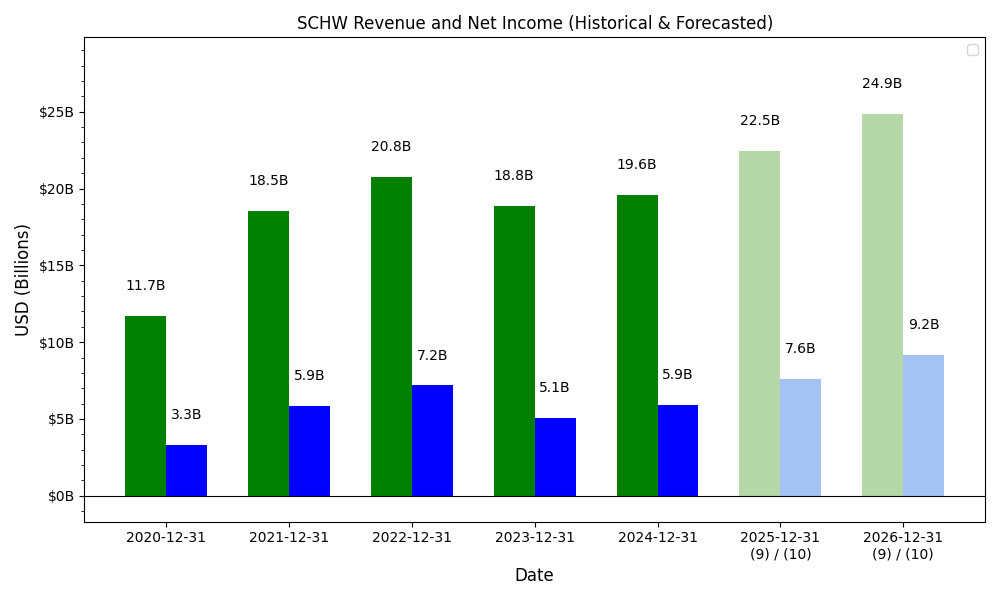
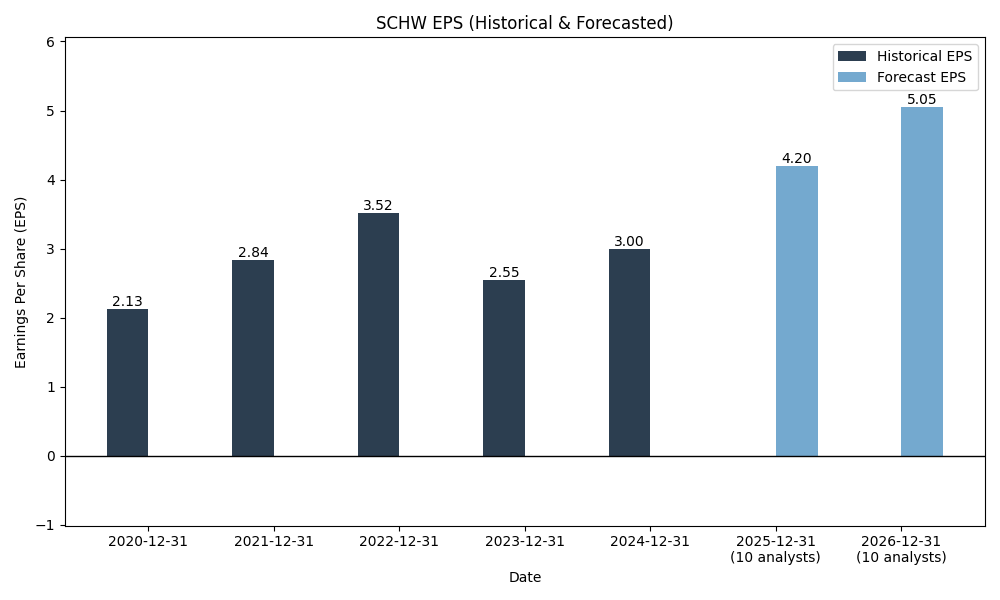
Forecasts
Y/Y % Change
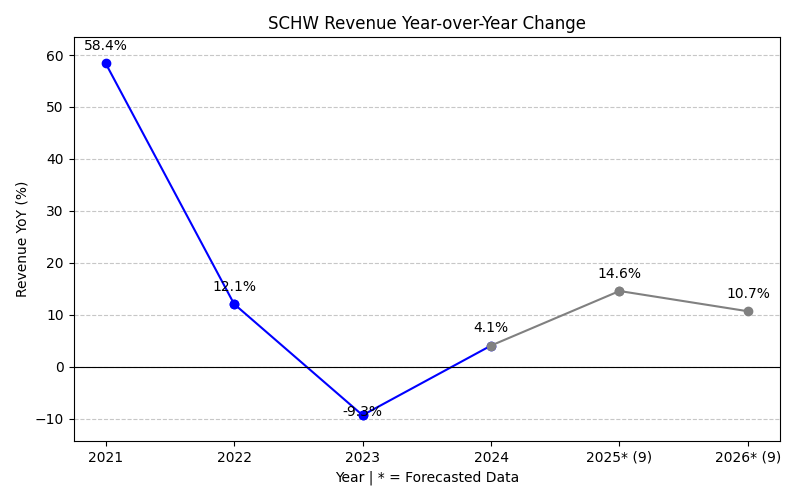
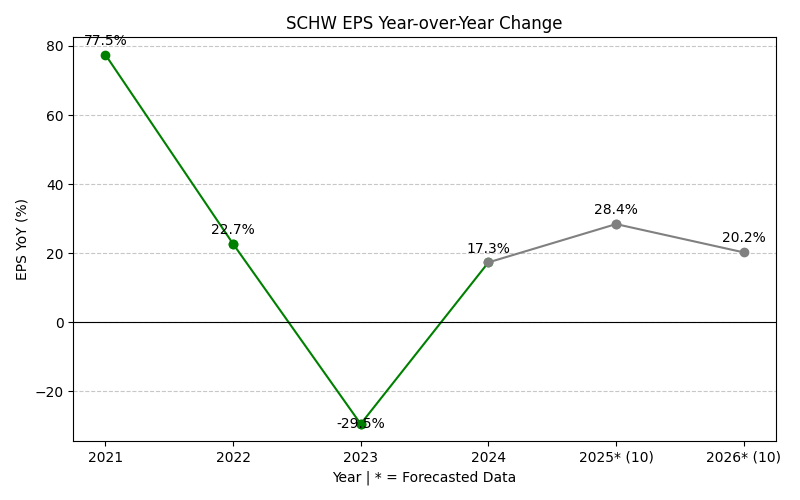
SCHW Year-over-Year Growth
| 2020 | 2021 | 2022 | 2023 | 2024 | 2025 | 2026 | 2027 | Average | |
|---|---|---|---|---|---|---|---|---|---|
| Revenue Growth (%) | 58.4% | 12.1% | -9.3% | 4.1% | 22.0% | 14.0% | 8.2% | 15.6% | |
| Revenue Analysts (#) | 0 | 0 | 0 | 0 | 0 | 0 | 9 | 16 | |
| EPS Growth (%) | 77.5% | 22.7% | -29.5% | 17.3% | 49.0% | 20.9% | 17.3% | 25.0% | |
| EPS Analysts (#) | 0 | 0 | 0 | 0 | 0 | 0 | 20 | 21 |
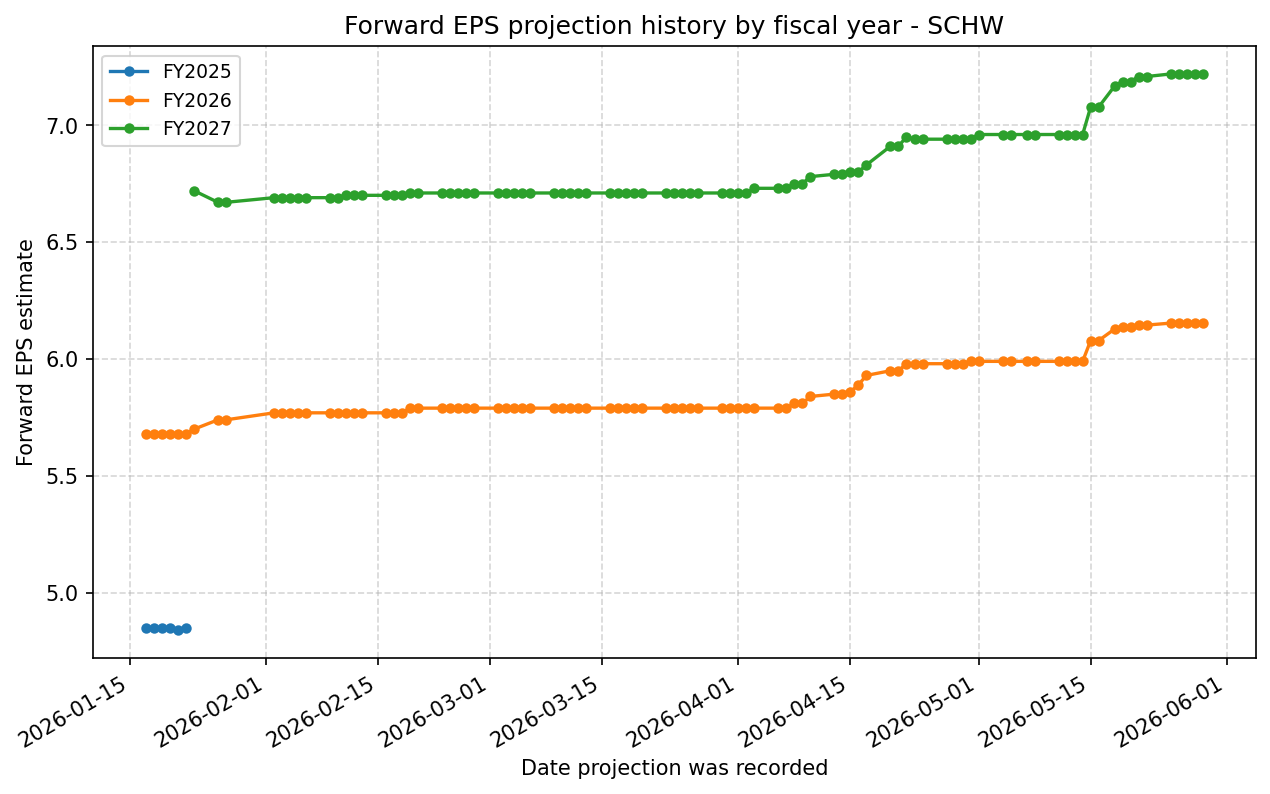
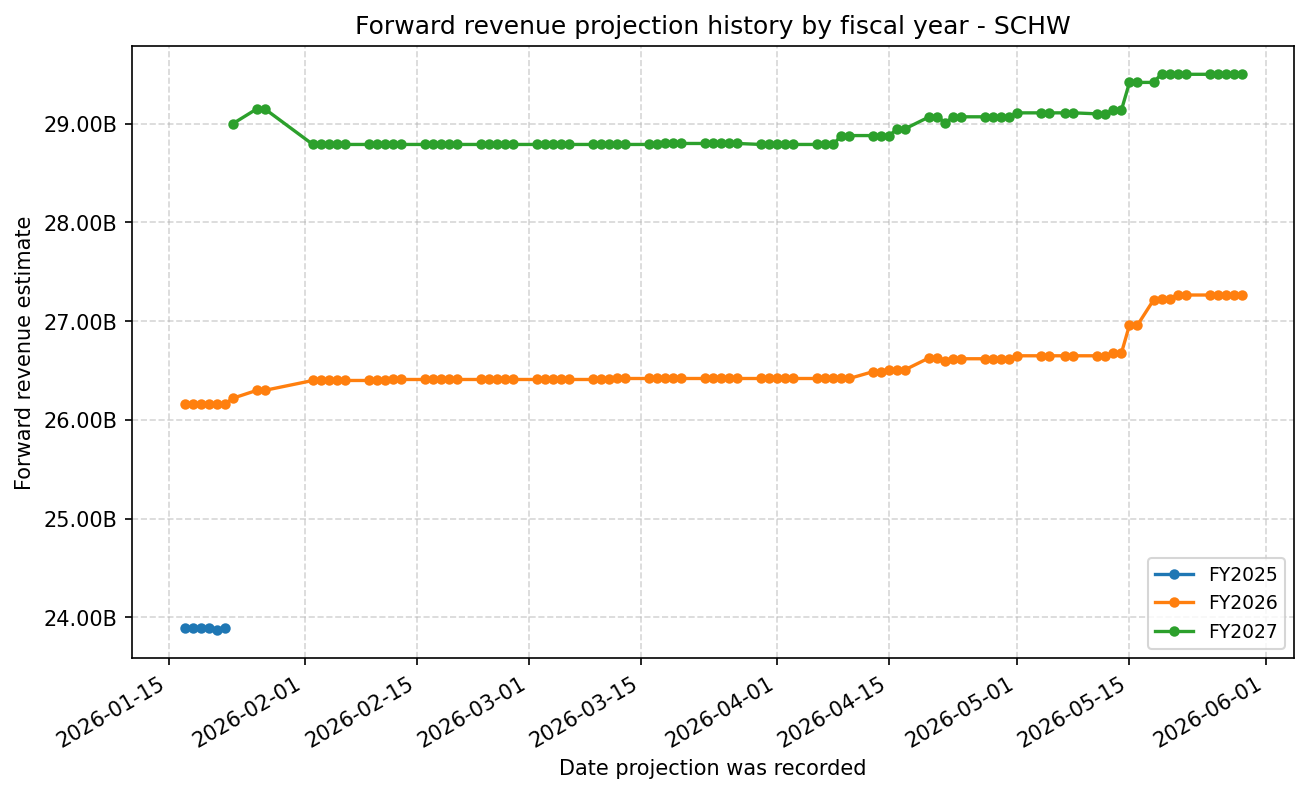
Forward Estimate History
How the next-FY EPS and revenue estimates have drifted over time. One line per fiscal year – past lines end when that FY became current.
Expenses
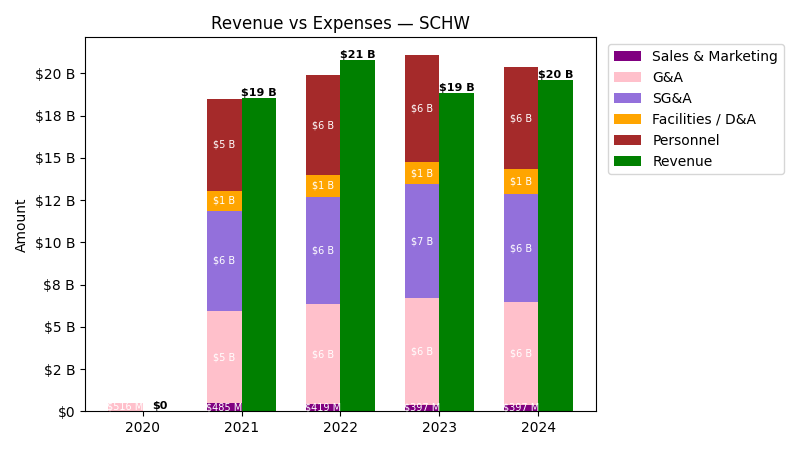
| Year | Revenue ($) | Sales & Marketing ($) | G&A ($) | SG&A ($) | Facilities / D&A ($) | Personnel ($) |
|---|---|---|---|---|---|---|
| 2022 | $20.8B | $419.0M | $5.9B | $6.4B | $1.2B | $5.9B |
| 2023 | $18.8B | $397.0M | $6.3B | $6.7B | $1.3B | $6.3B |
| 2024 | $19.6B | $397.0M | $6.0B | $6.4B | $1.4B | $6.0B |
| 2025 | $23.9B | $420.0M | $6.5B | $6.9B | $1.4B | $6.5B |
| TTM | $24.8B | $425.0M | $6.6B | $7.1B | $1.3B | $6.6B |
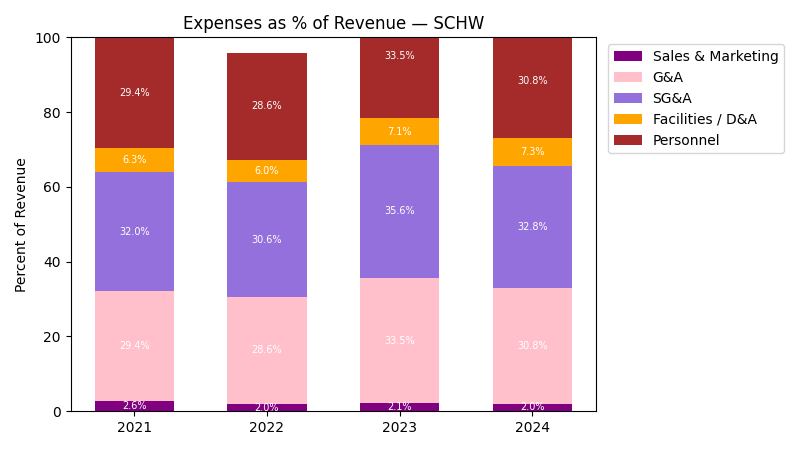
| Year | Revenue Change (%) | Sales & Marketing Change (%) | G&A Change (%) | SG&A Change (%) | Facilities / D&A Change (%) | Personnel Change (%) |
|---|---|---|---|---|---|---|
| 2023 | -9.27 | -5.25 | 6.38 | 5.62 | 7.21 | 6.38 |
| 2024 | 4.08 | 0.00 | -4.31 | -4.05 | 7.25 | -4.31 |
| 2025 | 22.01 | 5.79 | 7.41 | 7.31 | -5.09 | 7.41 |
| TTM | 3.69 | 1.19 | 2.16 | 2.10 | -1.03 | 2.16 |
No unmapped expenses.
Segment Performance
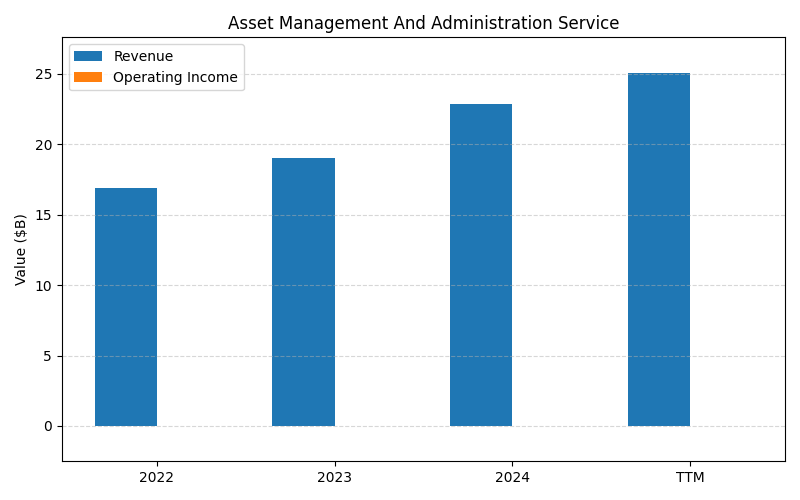
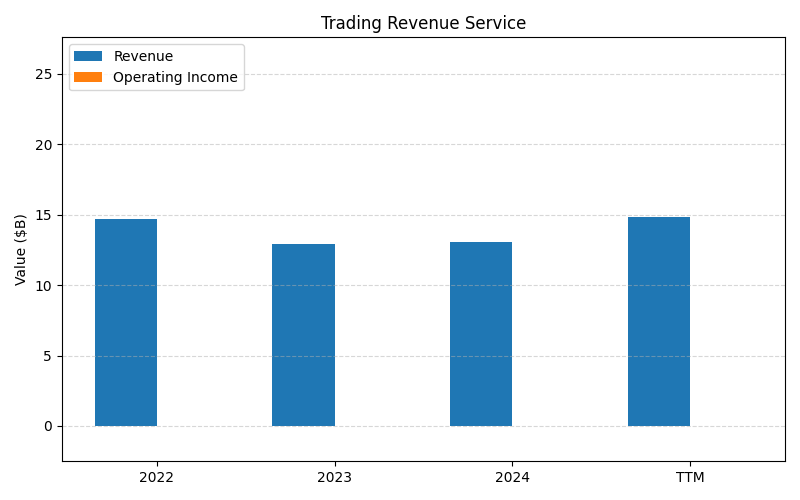
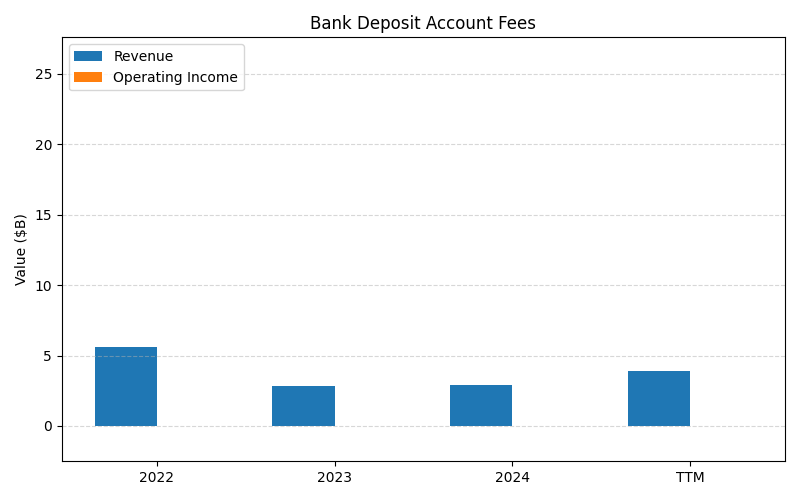
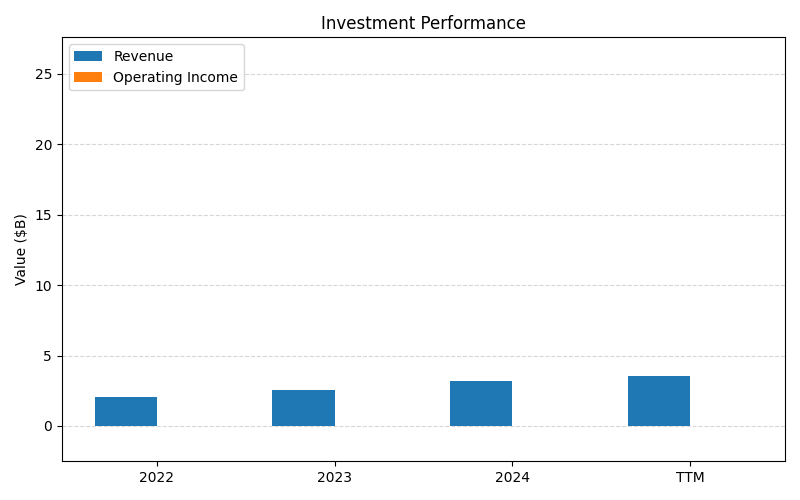
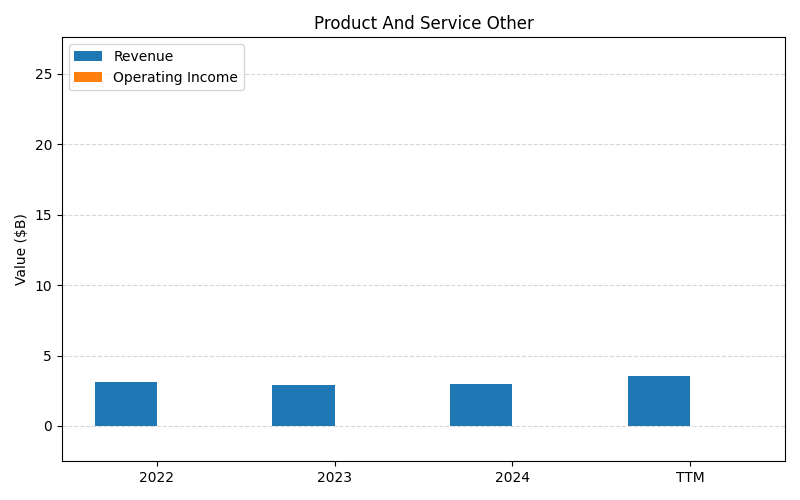
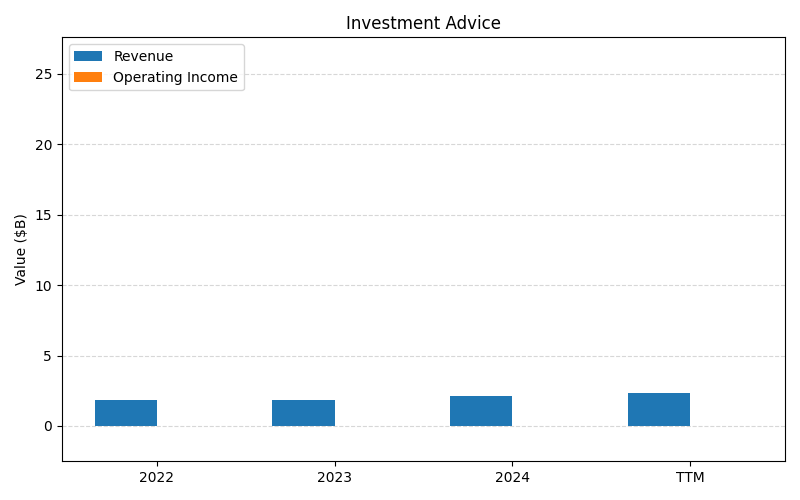
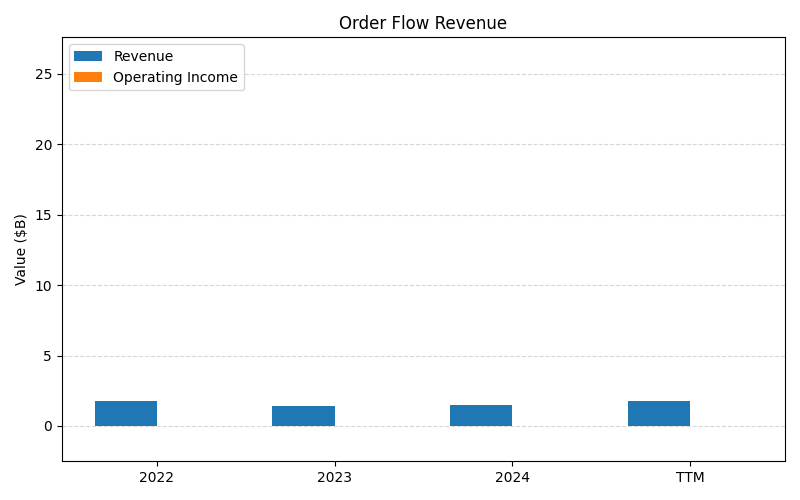
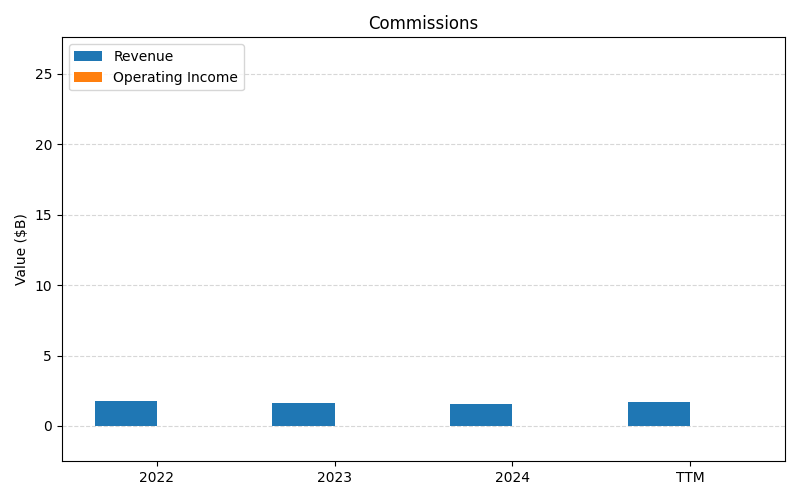

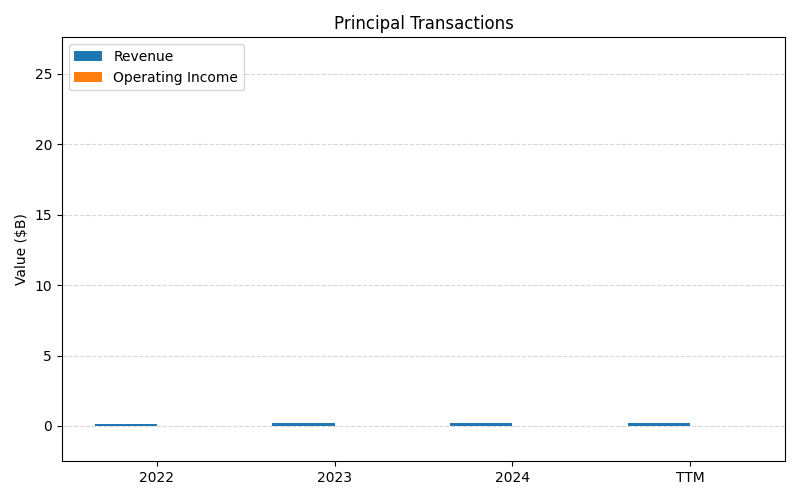
SEGMENTS v2025-09-09 · 2026-05-29 09:14 UTC — Units: $B. Rows list fiscal years (last 3 + TTM) with revenue for each segment; the final row shows the TTM revenue mix (operating income columns display “—” where mix is not applicable).
| Year | Asset Management And Administration Service Rev | Trading Revenue Service Rev | Bank Deposit Account Fees Rev | Investment Performance Rev | Product And Service Other Rev | Investment Advice Rev | Order Flow Revenue Rev | Commissions Rev | Financial Service Other Rev | Principal Transactions Rev | Total Rev |
|---|---|---|---|---|---|---|---|---|---|---|---|
| 2023 | 19B | 12.9B | 2.82B | 2.56B | 2.88B | 1.87B | 1.40B | 1.60B | 0.33B | 0.23B | 45.6B |
| 2024 | 22.9B | 13.1B | 2.92B | 3.22B | 3.01B | 2.13B | 1.48B | 1.59B | 0.37B | 0.20B | 50.8B |
| 2025 | 26B | 15.7B | 3.91B | 3.67B | 3.08B | 2.44B | 1.93B | 1.80B | 0.40B | 0.19B | 59.1B |
| TTM | 62B | 36.7B | 8.98B | 8.76B | 7.71B | 5.81B | 4.41B | 4.31B | 0.94B | 0.46B | 140.2B |
| % of Total (TTM) | 44.3% | 26.2% | 6.4% | 6.2% | 5.5% | 4.1% | 3.1% | 3.1% | 0.7% | 0.3% | 100% |
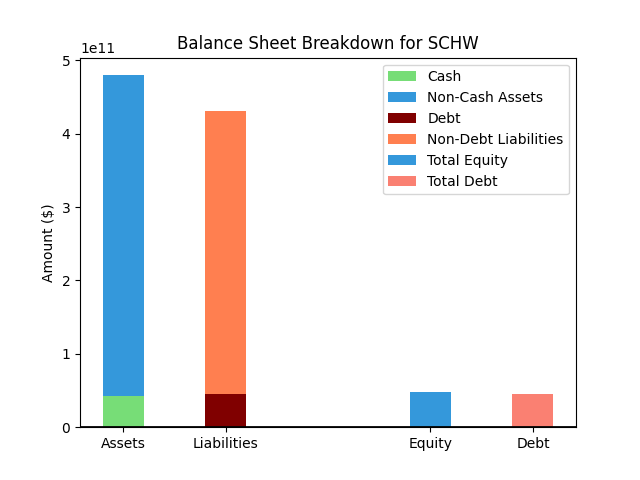
Balance Sheet
| Metric | Value | |
|---|---|---|
| 0 | Total Assets | $493,319M |
| 1 | Cash | $44,975M |
| 2 | Total Liabilities | $444,085M |
| 3 | Total Debt | $33,069M |
| 4 | Total Equity | $49,234M |
| 5 | Debt to Equity Ratio | 0.67 |
EPS & Dividend
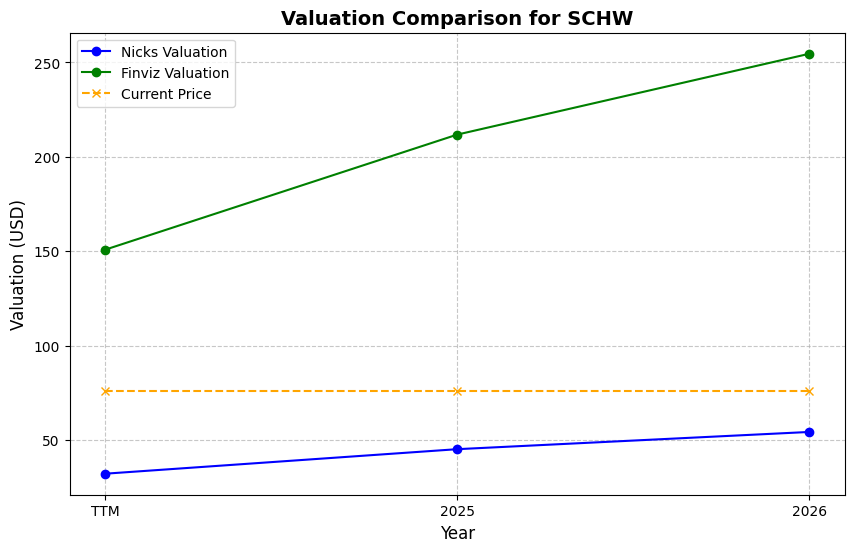
Valuation
| Share Price | Treasury Yield | Estimates | Fair Value (P/E) | Fair Value (P/S) | Current P/S | Current P/E |
|---|---|---|---|---|---|---|
| $87.35 | 4.5% | Nicks Growth: 5% Nick's Expected Margin: 30% FINVIZ Growth: 21% |
Nicks: 11 Finviz: 45 |
Nick's: 3.168 | 6.1 | 17.4 |
| Basis | Year | Nicks Valuation | Nicks vs Share Price | Finviz Valuation | Finviz vs Share Price |
|---|---|---|---|---|---|
| $5.03 EPS | TTM | $53.12 | -39.2% | $225.69 | 158.4% |
| $6.15 EPS | 2026 | $64.99 | -25.6% | $276.11 | 216.1% |
| $7.22 EPS | 2027 | $76.24 | -12.7% | $323.91 | 270.8% |
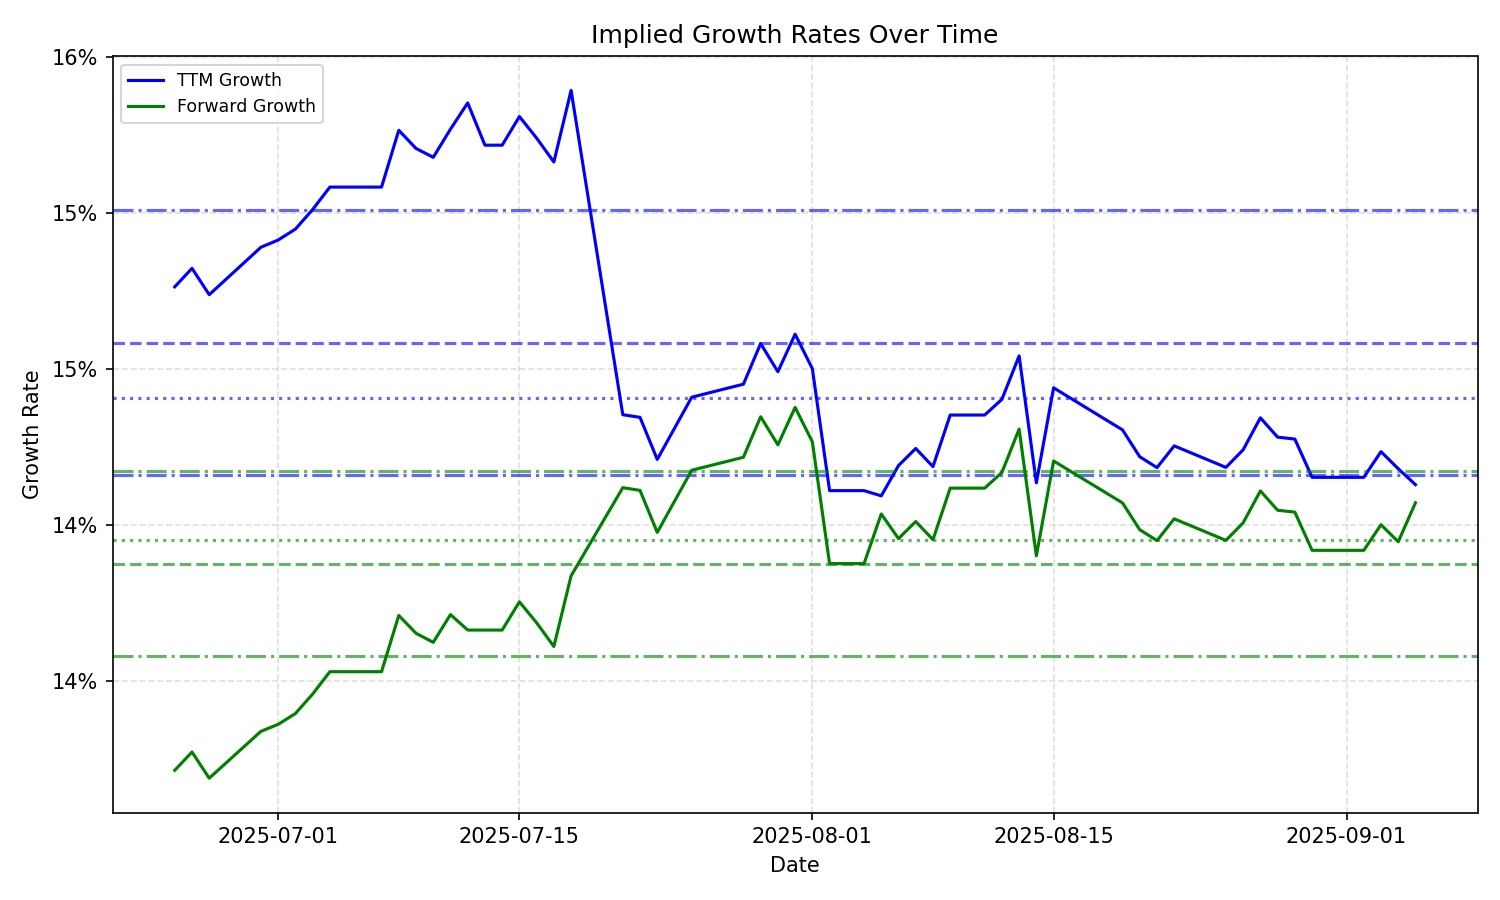
Implied Growth
| Average | Median | Std Dev | Current | Percentile | ||||||
|---|---|---|---|---|---|---|---|---|---|---|
| TTM | Forward | TTM | Forward | TTM | Forward | TTM | Forward | TTM | Forward | |
| Timeframe | ||||||||||
| 1 Year | 12.76% | 11.09% | 12.60% | 13.25% | 1.42% | 2.94% | 9.88% | 6.14% | 0.4% | 0.4% |
| 3 Years | 12.76% | 11.09% | 12.60% | 13.25% | 1.42% | 2.94% | 9.88% | 6.14% | 0.4% | 0.4% |
| 5 Years | 12.76% | 11.09% | 12.60% | 13.25% | 1.42% | 2.94% | 9.88% | 6.14% | 0.4% | 0.4% |
| 10 Years | 12.76% | 11.09% | 12.60% | 13.25% | 1.42% | 2.94% | 9.88% | 6.14% | 0.4% | 0.4% |