Starbucks Corporation — SBUX
| Close Price | Market Cap | P/E Ratio | Forward P/E Ratio | Implied Growth* | Implied Forward Growth* | Dividend | P/B Ratio |
|---|---|---|---|---|---|---|---|
| $99.16 | $113.01B | 75.7 | 32.7 | 26.9% | 17.0% | $2.48 2.5% | -13.3 |
Latest Headlines
- · SunPower Achieves High NPS Score from Starbucks
- · Alsea launches first Starbucks Smart Lounge in Chile
- · Starbucks Suffers Significant Drop in Sales in South Korea
- · Starbucks quietly retired its AI agent just months after deployment after it miscounted coffee shop inventories and slowed down baristas
- · Six Flags hires Hot Topic CFO for finance chief
- · Why Is Starbucks (SBUX) Down 3.2% Since Last Earnings Report?
Revenue & Net Income
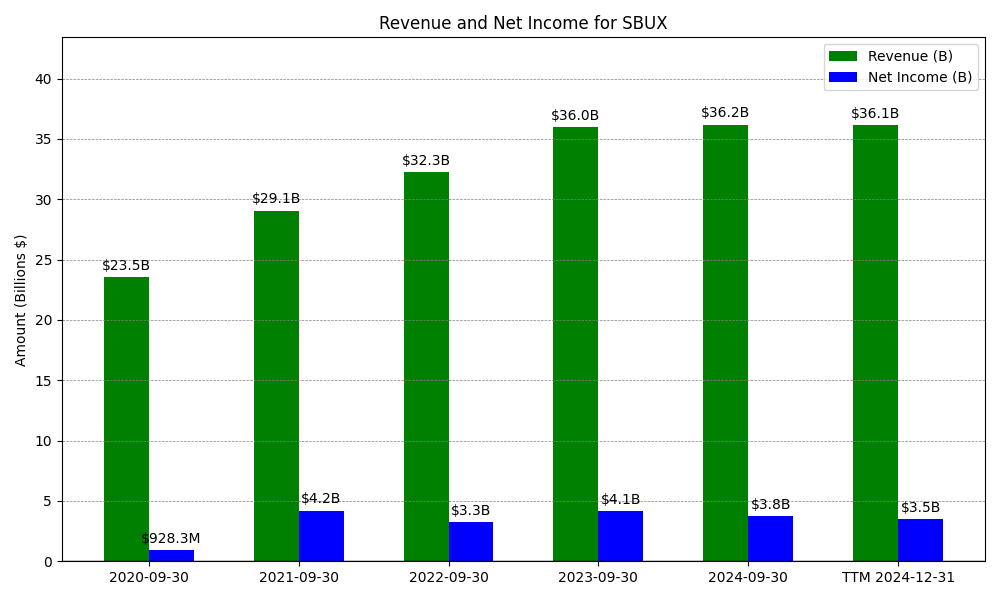
| Date | Revenue | Net_Income | EPS | Last_Updated | Revenue_Change | Net_Income_Change | EPS_Change | |
|---|---|---|---|---|---|---|---|---|
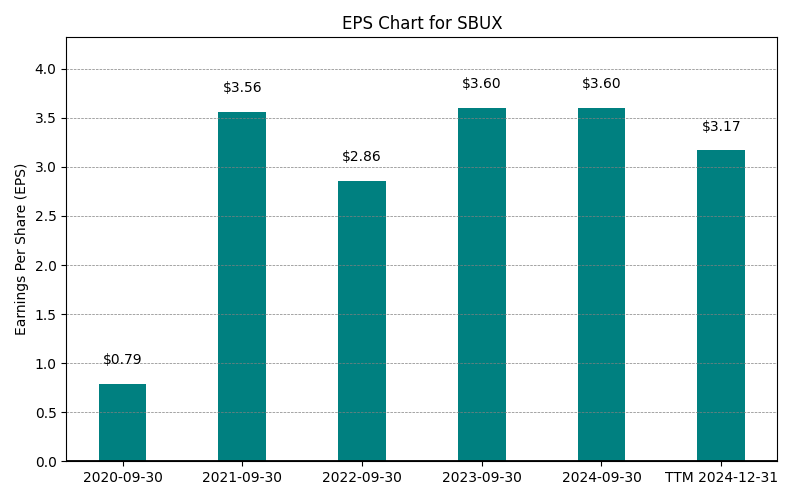
| 0 | 2020-09-30 | $23,518M | $928M | $0.79 | 2024-02-04 04:18:37 | N/A | N/A | N/A |
| 1 | 2021-09-30 | $29,061M | $4,199M | $3.56 | 2024-02-04 04:18:37 | 23.6% | 352.4% | 350.1% |
| 2 | 2022-09-30 | $32,250M | $3,282M | $2.86 | 2026-05-29 09:14:24 | 11.0% | -21.9% | -19.7% |
| 3 | 2023-09-30 | $35,976M | $4,124M | $3.60 | 2026-05-29 09:14:24 | 11.6% | 25.7% | 25.9% |
| 4 | 2024-09-30 | $36,176M | $3,761M | $3.32 | 2026-05-29 09:14:24 | 0.6% | -8.8% | -7.9% |
| 5 | 2025-09-30 | $37,184M | $1,856M | $1.63 | 2026-05-29 09:14:24 | 2.8% | -50.6% | -50.8% |
| 6 | TTM 2026-03-31 | $38,472M | $1,496M | $1.31 | 2026-04-30 08:55:07 | 3.5% | -19.4% | -19.8% |
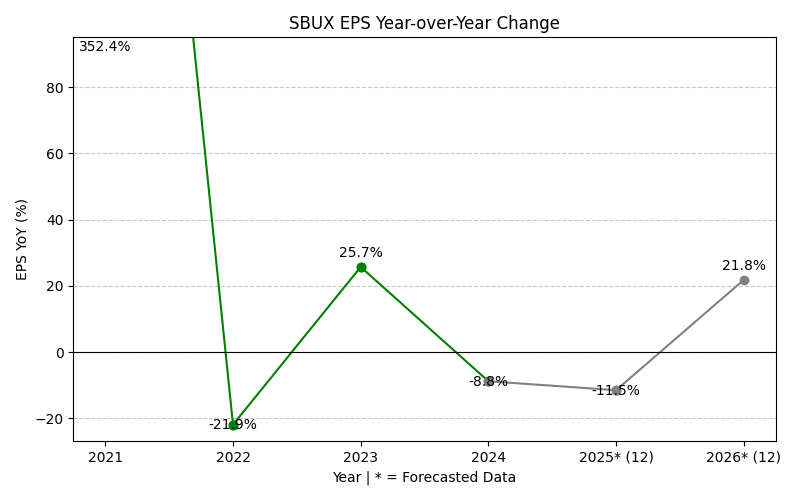
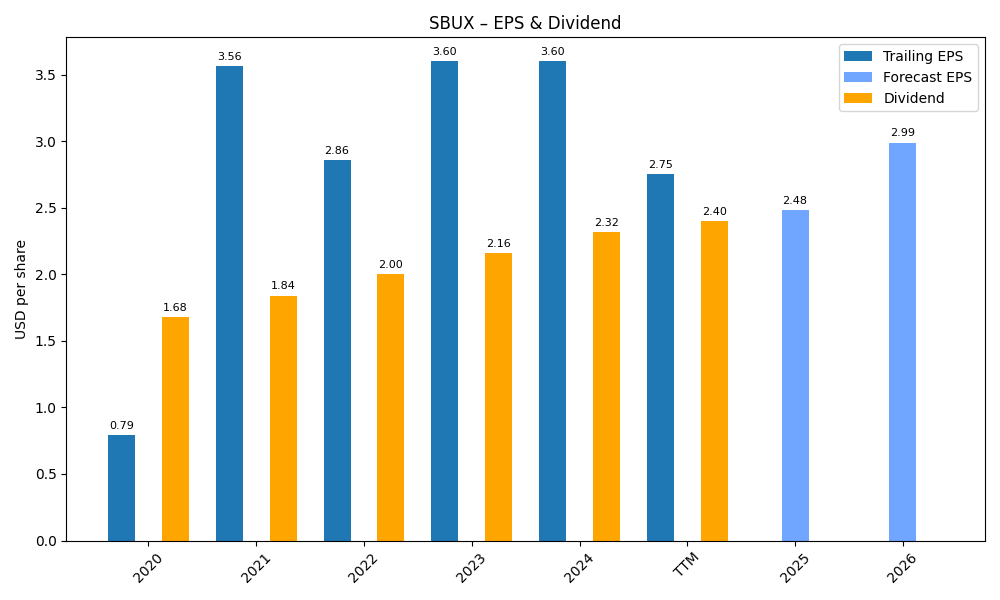
EPS
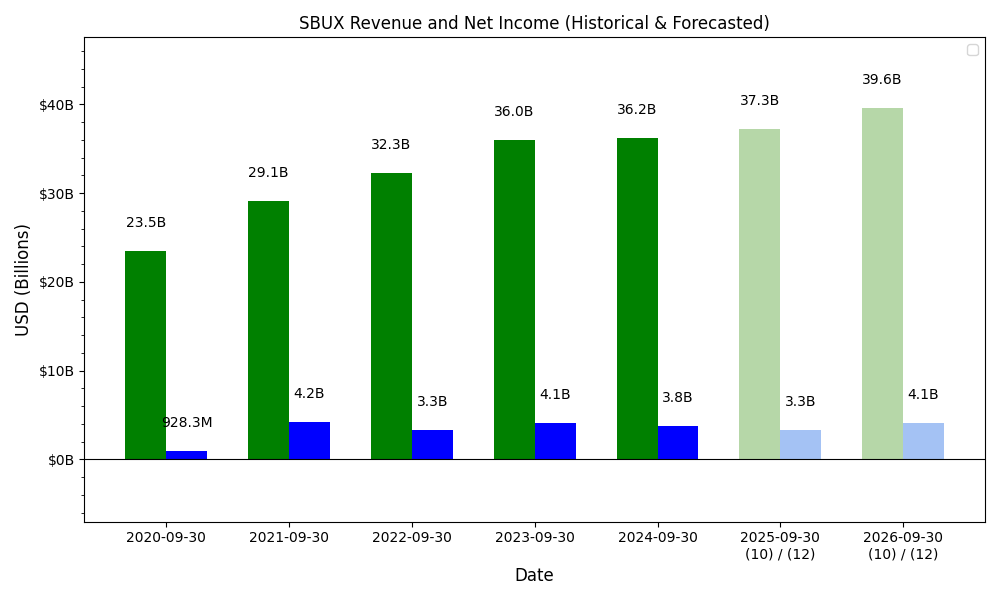
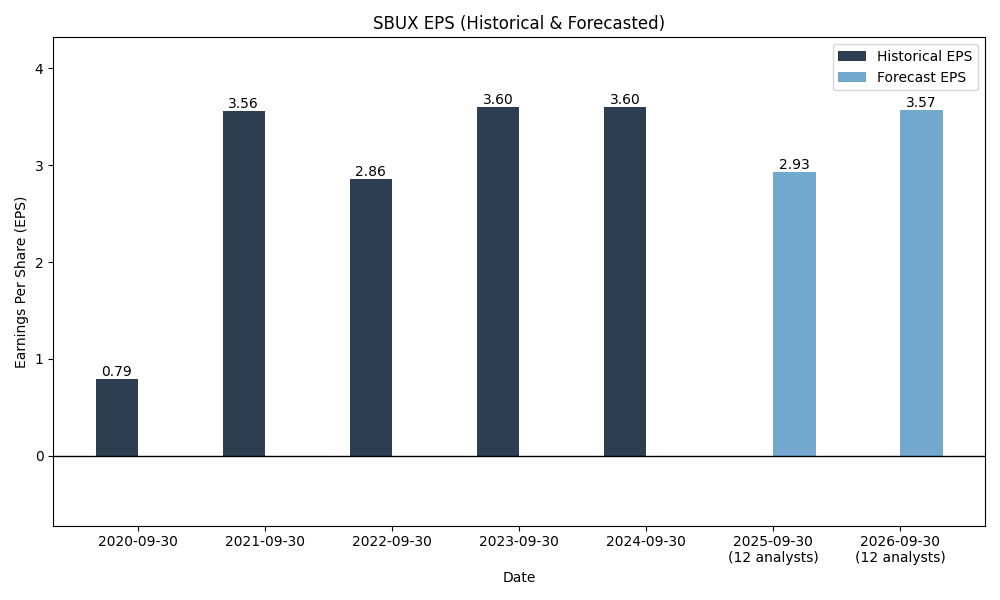
Forecasts
Y/Y % Change
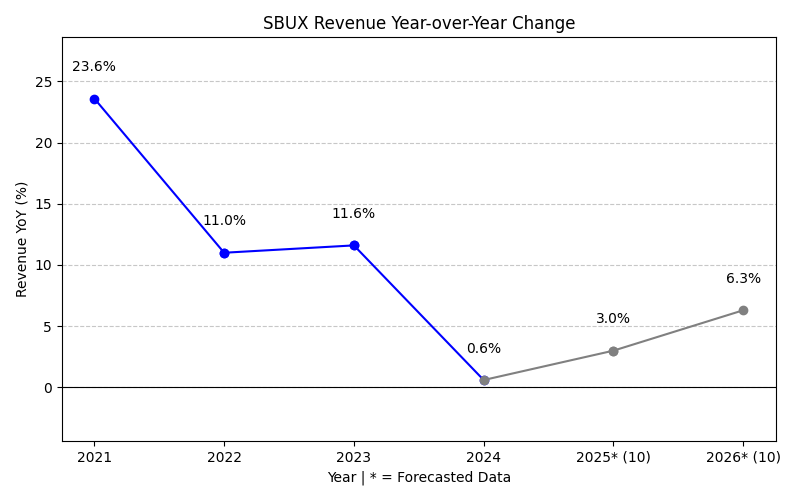
SBUX Year-over-Year Growth
| 2020 | 2021 | 2022 | 2023 | 2024 | 2025 | 2026 | 2027 | Average | |
|---|---|---|---|---|---|---|---|---|---|
| Revenue Growth (%) | 23.6% | 11.0% | 11.6% | 0.6% | 2.8% | 1.5% | 2.3% | 7.6% | |
| Revenue Analysts (#) | 0 | 0 | 0 | 0 | 0 | 0 | 31 | 31 | |
| EPS Growth (%) | 352.4% | -21.9% | 25.7% | -8.8% | -50.6% | 46.8% | 26.7% | 52.9% | |
| EPS Analysts (#) | 0 | 0 | 0 | 0 | 0 | 0 | 32 | 33 |
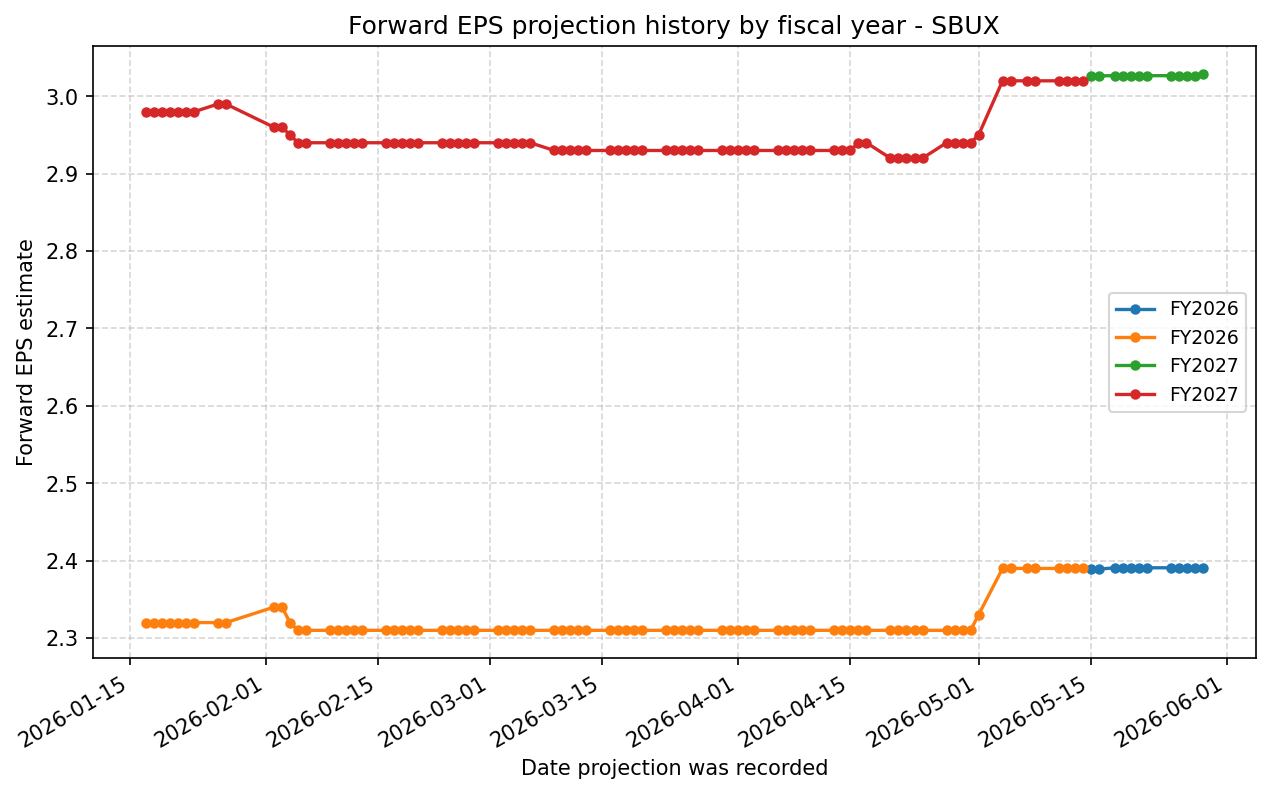
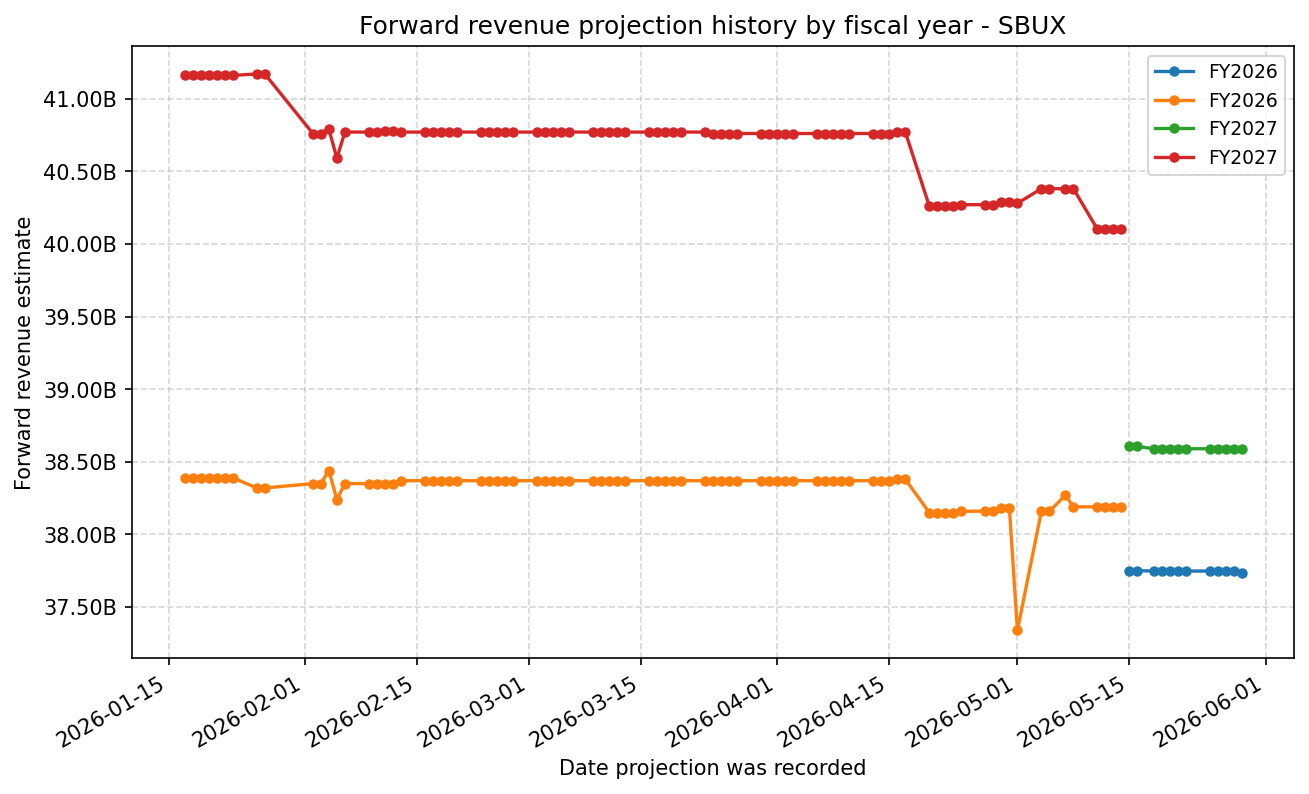
Forward Estimate History
How the next-FY EPS and revenue estimates have drifted over time. One line per fiscal year – past lines end when that FY became current.
Expenses
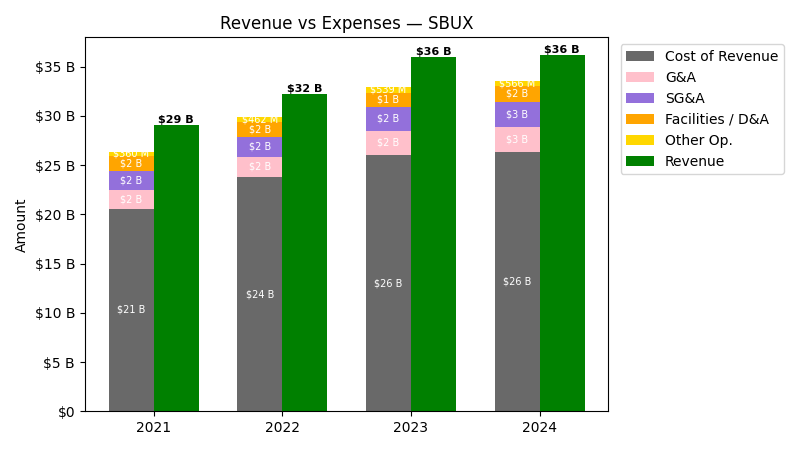
| Year | Revenue ($) | Cost of Revenue ($) | G&A ($) | SG&A ($) | Facilities / D&A ($) |
|---|---|---|---|---|---|
| 2022 | $32.3B | $22.3B | $2.0B | $2.0B | $1.5B |
| 2023 | $36.0B | $24.6B | $2.4B | $2.4B | $1.5B |
| 2024 | $36.2B | $24.8B | $2.5B | $2.5B | $1.6B |
| 2025 | $37.2B | $26.9B | $2.6B | $2.6B | $1.8B |
| TTM | $38.5B | $28.3B | $2.6B | $2.6B | $1.7B |
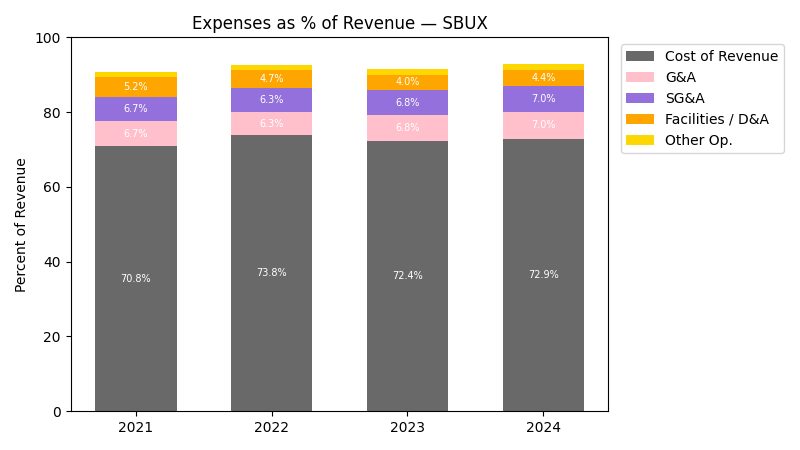
| Year | Revenue Change (%) | Cost of Revenue Change (%) | G&A Change (%) | SG&A Change (%) | Facilities / D&A Change (%) |
|---|---|---|---|---|---|
| 2023 | 11.55 | 10.43 | 20.14 | 20.14 | -5.17 |
| 2024 | 0.56 | 0.83 | 3.36 | 3.36 | 9.80 |
| 2025 | 2.79 | 8.32 | 3.72 | 3.72 | 11.25 |
| TTM | 3.46 | 5.45 | -1.57 | -1.57 | -2.62 |
No unmapped expenses.
Segment Performance
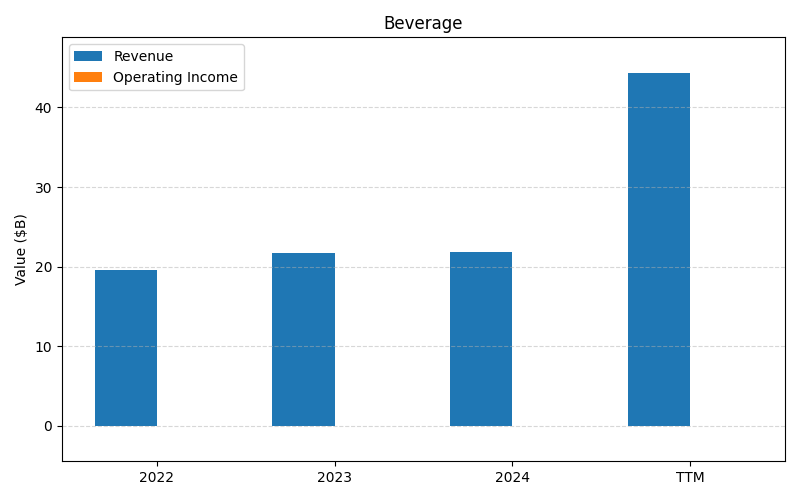
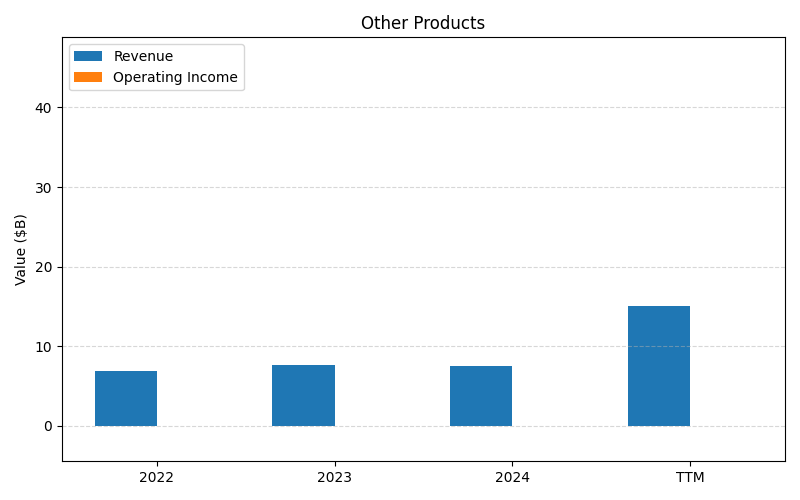
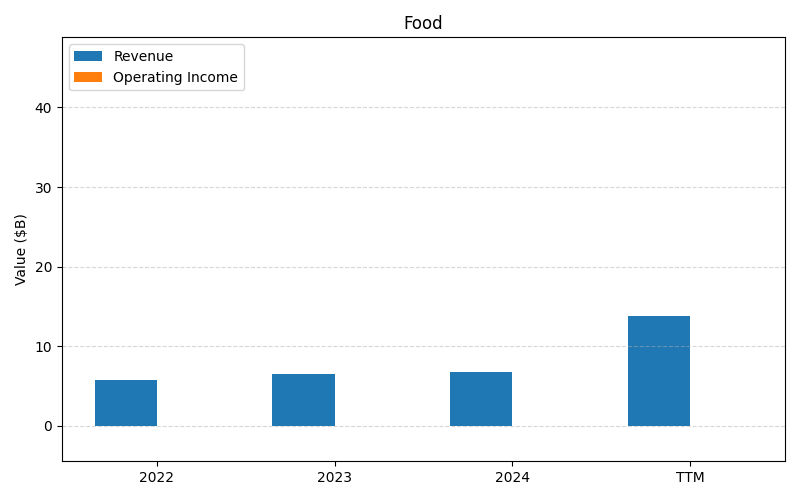
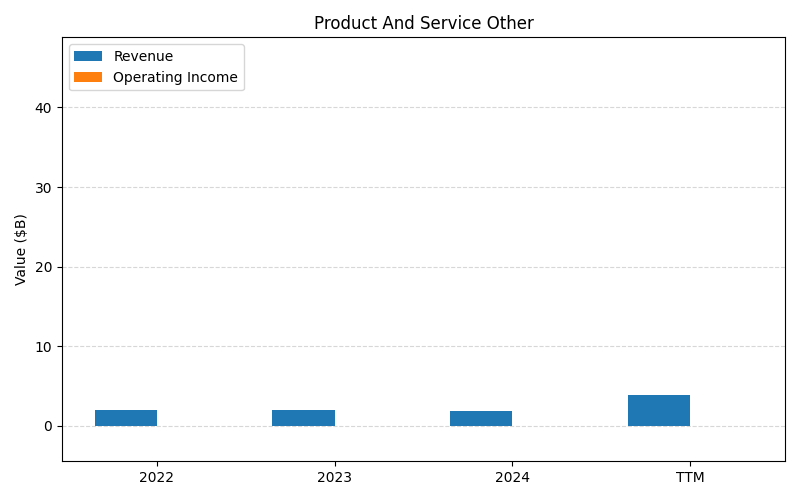
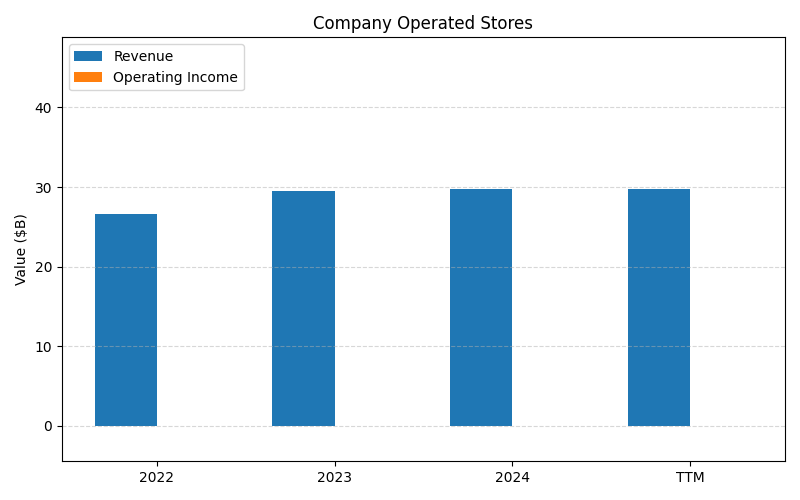
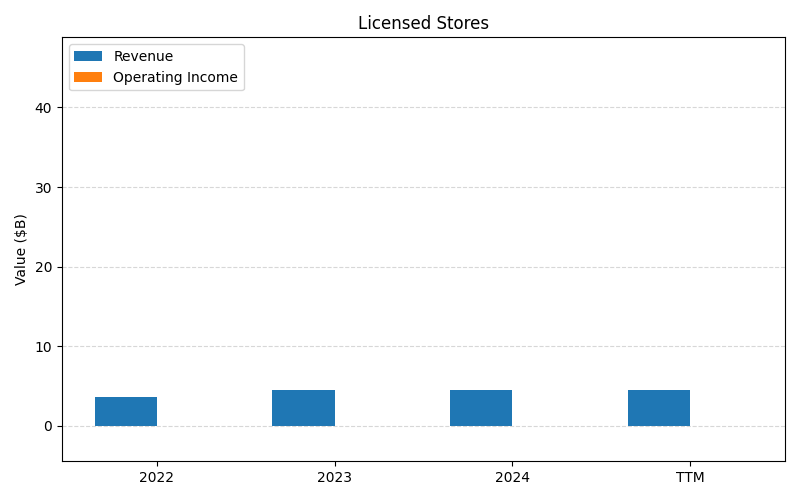
SEGMENTS v2025-09-09 · 2026-05-29 09:14 UTC — Units: $B. Rows list fiscal years (last 3 + TTM) with revenue for each segment; the final row shows the TTM revenue mix (operating income columns display “—” where mix is not applicable).
| Year | Beverage Rev | Other Products Rev | Food Rev | Product And Service Other Rev | Company Operated Stores Rev | Licensed Stores Rev | Total Rev |
|---|---|---|---|---|---|---|---|
| 2023 | 21.7B | 7.71B | 6.59B | 2.00B | 29.5B | 4.51B | 72B |
| 2024 | 21.9B | 7.54B | 6.75B | 1.91B | 29.8B | 4.51B | 72.4B |
| 2025 | 22.5B | 7.59B | 7.05B | 2.09B | 30.7B | 4.35B | 74.4B |
| TTM | 78B | 26.8B | 24.5B | 7.24B | – | – | 136.5B |
| % of Total (TTM) | 57.1% | 19.6% | 18.0% | 5.3% | – | – | 100% |
Segment Performance (Axis 2)
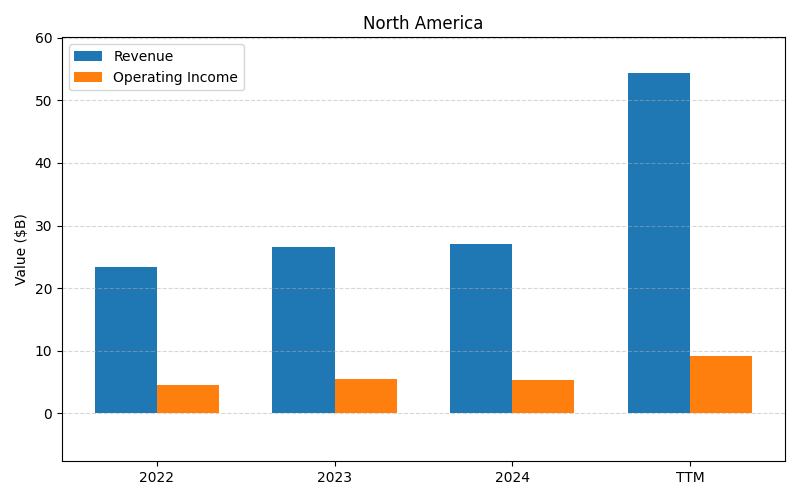
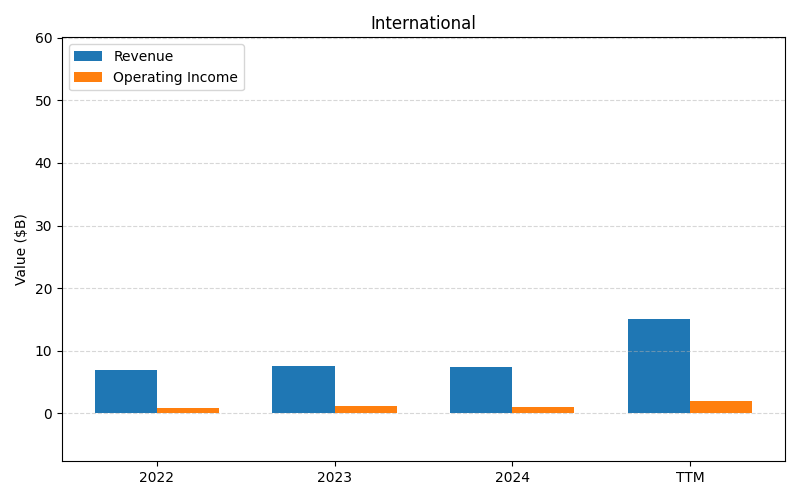
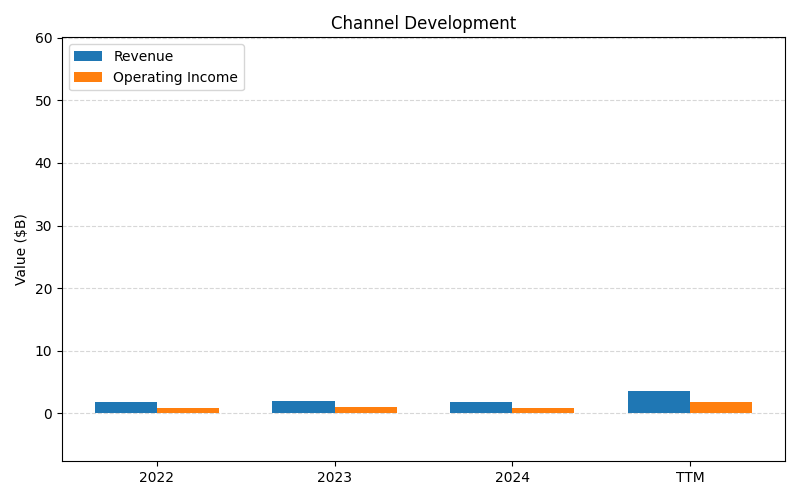
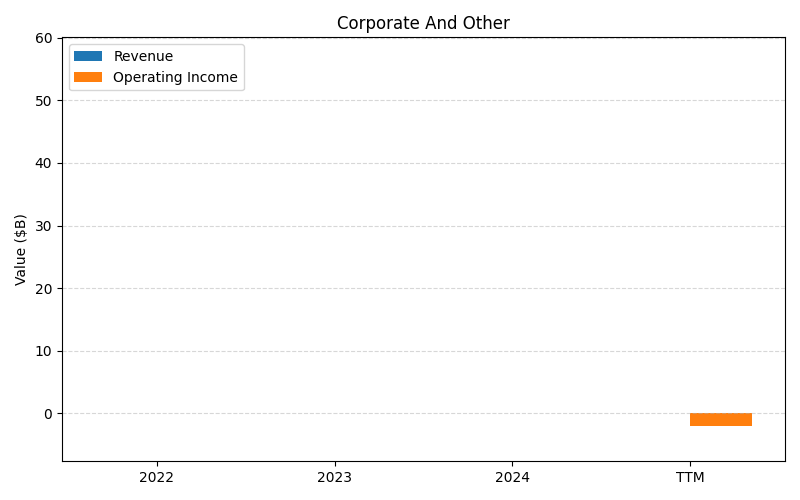
SEGMENTS v2025-09-09 · 2026-05-29 09:14 UTC — Units: $B. Rows list fiscal years (last 3 + TTM) with revenue and operating income for each segment; the final row shows the TTM revenue mix (operating income columns display “—” where mix is not applicable).
| Year | North America Rev | North America OI | International Rev | International OI | Channel Development Rev | Channel Development OI | Corporate And Other Rev | Corporate And Other OI | Total Rev | Total OI |
|---|---|---|---|---|---|---|---|---|---|---|
| 2023 | 26.6B | 5.50B | 7.49B | 1.23B | 1.89B | 0.97B | 0.02B | -1.82B | 36B | 5.87B |
| 2024 | 27B | 5.36B | 7.34B | 1.05B | 1.77B | 0.93B | 0.06B | -1.92B | 36.2B | 5.41B |
| 2025 | 27.4B | 3.16B | 7.82B | 0.95B | 1.87B | 0.89B | 0.12B | -2.06B | 37.2B | 2.94B |
| TTM | 95.5B | 13.4B | 26.9B | 3.75B | 6.55B | 3.08B | 0.31B | -7.03B | 129.3B | 13.2B |
| % of Total (TTM) | 73.9% | — | 20.8% | — | 5.1% | — | 0.2% | — | 100% | — |
Balance Sheet
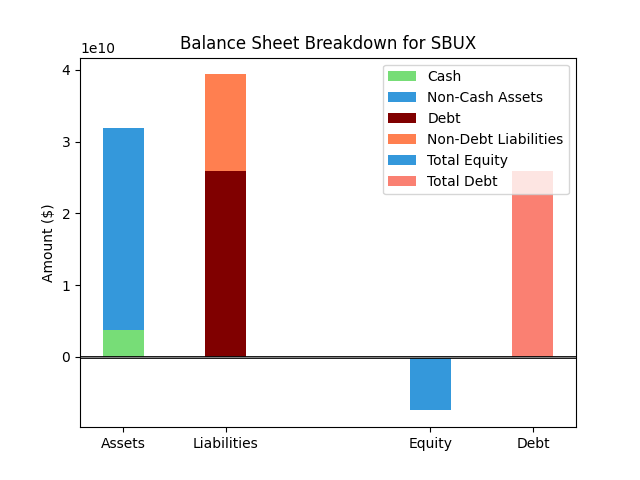
| Metric | Value | |
|---|---|---|
| 0 | Total Assets | $30,558M |
| 1 | Cash | $1,532M |
| 2 | Total Liabilities | $39,015M |
| 3 | Total Debt | $24,391M |
| 4 | Total Equity | $-8,465M |
| 5 | Debt to Equity Ratio | -2.88 |
EPS & Dividend
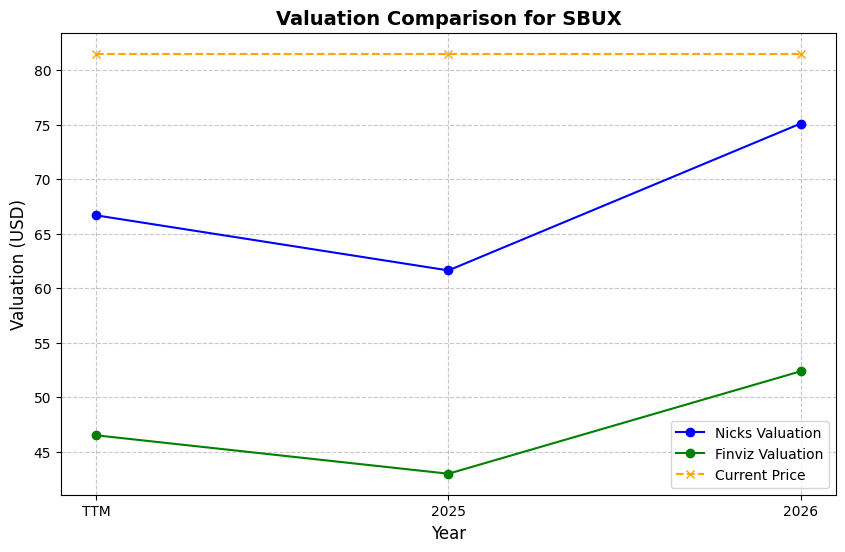
Valuation
| Share Price | Treasury Yield | Estimates | Fair Value (P/E) | Fair Value (P/S) | Current P/S | Current P/E |
|---|---|---|---|---|---|---|
| $99.16 | 4.5% | Nicks Growth: 12% Nick's Expected Margin: 10% FINVIZ Growth: 20% |
Nicks: 21 Finviz: 43 |
Nick's: 2.070 | 2.9 | 75.7 |
| Basis | Year | Nicks Valuation | Nicks vs Share Price | Finviz Valuation | Finviz vs Share Price |
|---|---|---|---|---|---|
| $1.31 EPS | TTM | $27.12 | -72.7% | $56.79 | -42.7% |
| $2.39 EPS | 2026 | $49.50 | -50.1% | $103.65 | 4.5% |
| $3.03 EPS | 2027 | $62.70 | -36.8% | $131.30 | 32.4% |
Implied Growth
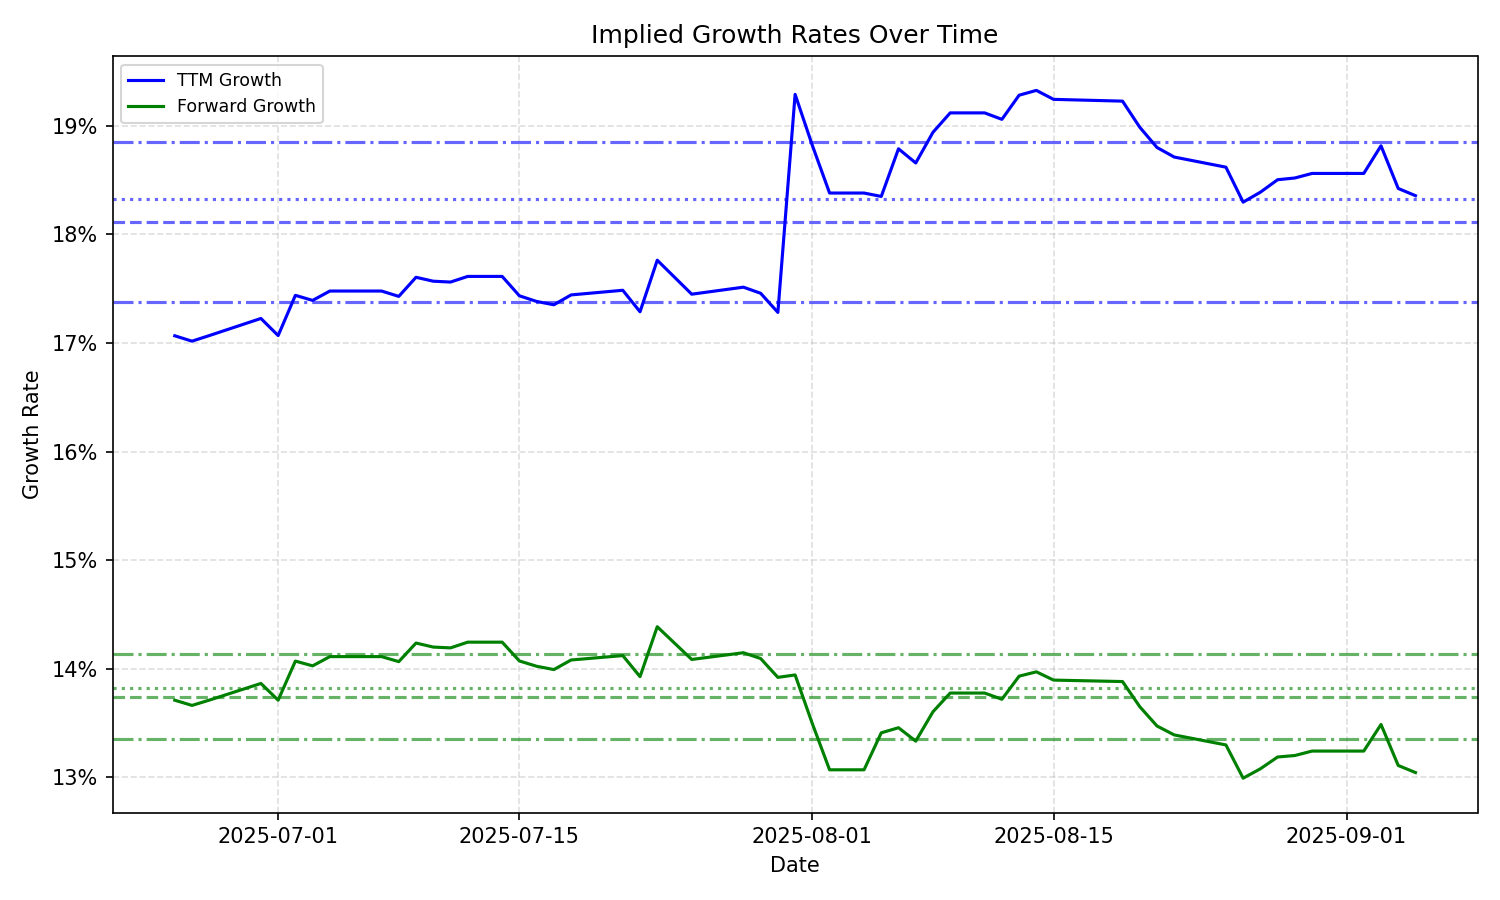
| Average | Median | Std Dev | Current | Percentile | ||||||
|---|---|---|---|---|---|---|---|---|---|---|
| TTM | Forward | TTM | Forward | TTM | Forward | TTM | Forward | TTM | Forward | |
| Timeframe | ||||||||||
| 1 Year | 22.23% | 14.74% | 22.05% | 14.11% | 4.12% | 1.94% | 27.09% | 17.23% | 72.7% | 88.0% |
| 3 Years | 22.23% | 14.74% | 22.05% | 14.11% | 4.12% | 1.94% | 27.09% | 17.23% | 72.7% | 88.0% |
| 5 Years | 22.23% | 14.74% | 22.05% | 14.11% | 4.12% | 1.94% | 27.09% | 17.23% | 72.7% | 88.0% |
| 10 Years | 22.23% | 14.74% | 22.05% | 14.11% | 4.12% | 1.94% | 27.09% | 17.23% | 72.7% | 88.0% |