RTX Corporation — RTX
| Close Price | Market Cap | P/E Ratio | Forward P/E Ratio | Implied Growth* | Implied Forward Growth* | Dividend | P/B Ratio |
|---|---|---|---|---|---|---|---|
| $179.66 | $241.95B | 33.7 | 23.8 | 17.4% | 13.5% | $2.77 1.5% | 3.7 |
Latest Headlines
- · 3 Aerospace Stocks Ready to Ride the Aftermarket Rebound
- · Defense Contractors Stocks Q1 Highlights: RTX (NYSE:RTX)
- · Why Is General Dynamics (GD) Up 1.4% Since Last Earnings Report?
- · Can GE's Growth Investments Create Long-Term Value for Investors?
- · Trump Holds the Line on Iran: No Sanctions Relief as Oil Slides Below $89
- · RTX Is Set to Revolutionize Munitions Manufacturing
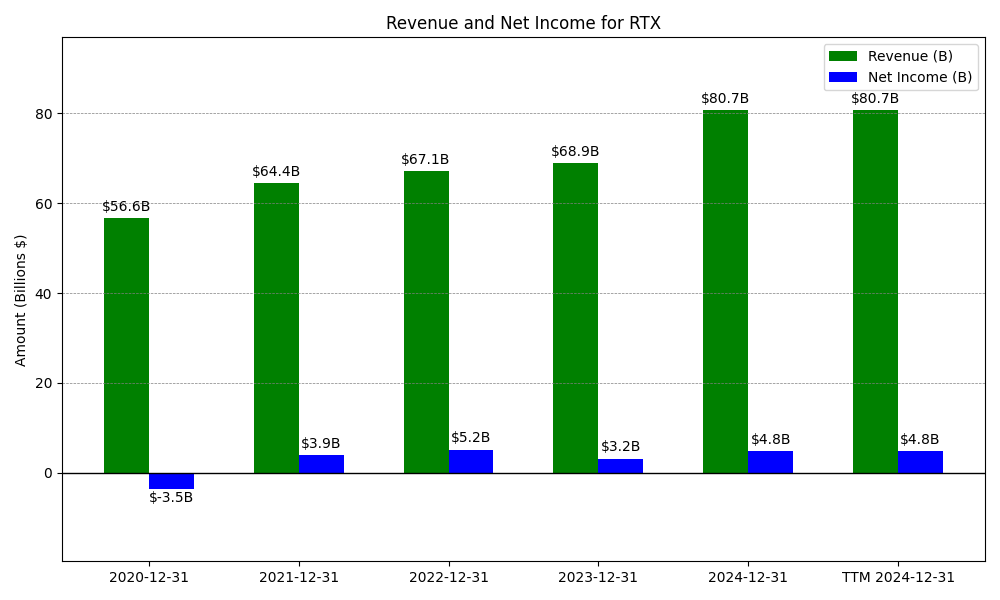
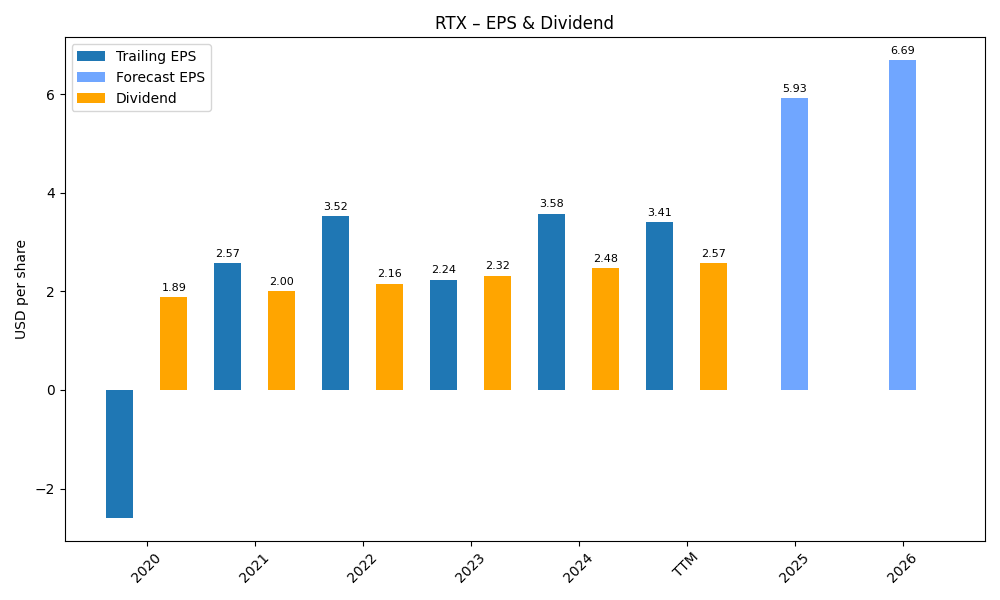
Revenue & Net Income
| Date | Revenue | Net_Income | EPS | Last_Updated | Revenue_Change | Net_Income_Change | EPS_Change | |
|---|---|---|---|---|---|---|---|---|
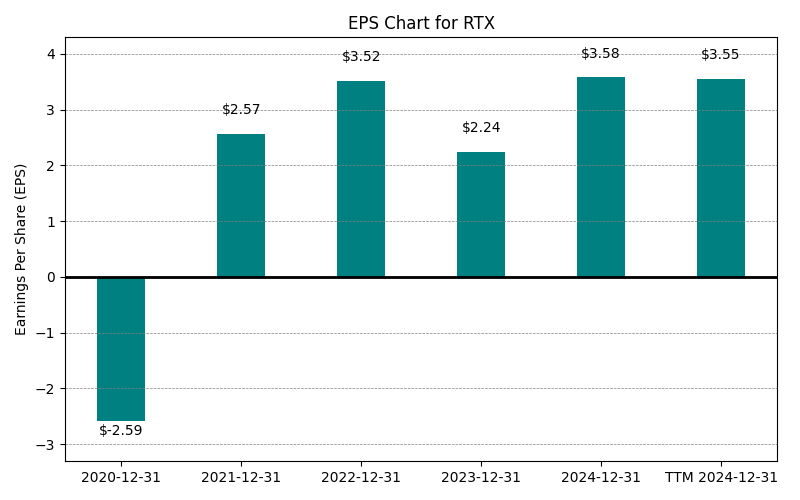
| 0 | 2020-12-31 | $56,587M | $-3,519M | $-2.59 | 2024-02-09 04:07:23 | N/A | N/A | N/A |
| 1 | 2021-12-31 | $64,388M | $3,864M | $2.57 | 2026-02-09 08:50:24 | 13.8% | -209.8% | -199.2% |
| 2 | 2022-12-31 | $67,074M | $5,197M | $3.52 | 2026-05-29 09:14:17 | 4.2% | 34.5% | 37.0% |
| 3 | 2023-12-31 | $68,920M | $3,195M | $2.24 | 2026-05-29 09:14:17 | 2.8% | -38.5% | -36.4% |
| 4 | 2024-12-31 | $80,738M | $4,774M | $3.58 | 2026-05-29 09:14:17 | 17.1% | 49.4% | 59.8% |
| 5 | 2025-12-31 | $88,603M | $6,732M | $5.02 | 2026-05-29 09:14:17 | 9.7% | 41.0% | 40.2% |
| 6 | TTM 2026-03-31 | $90,373M | $7,256M | $5.33 | 2026-04-23 08:44:12 | 2.0% | 7.8% | 6.2% |
EPS
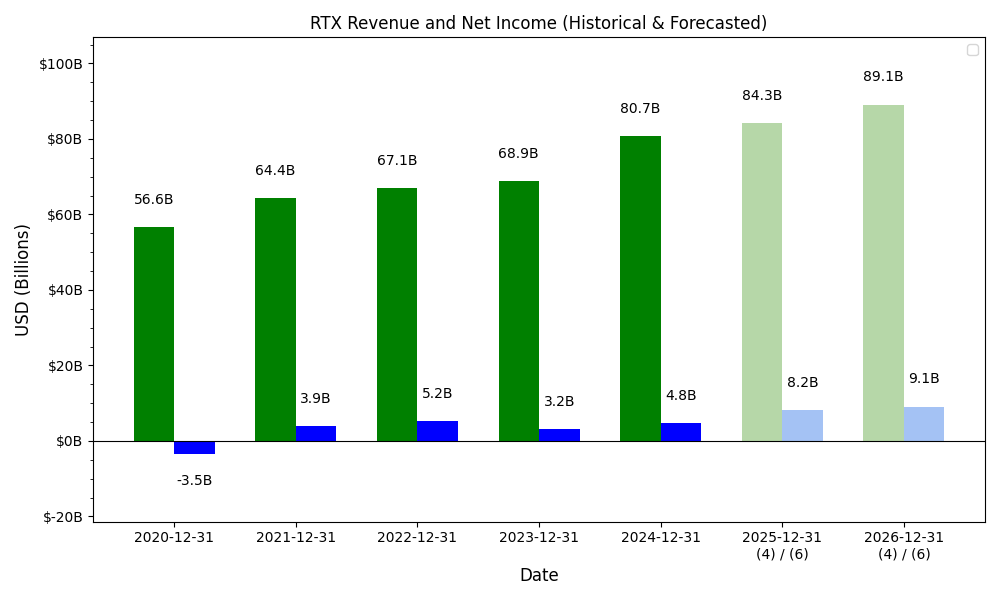
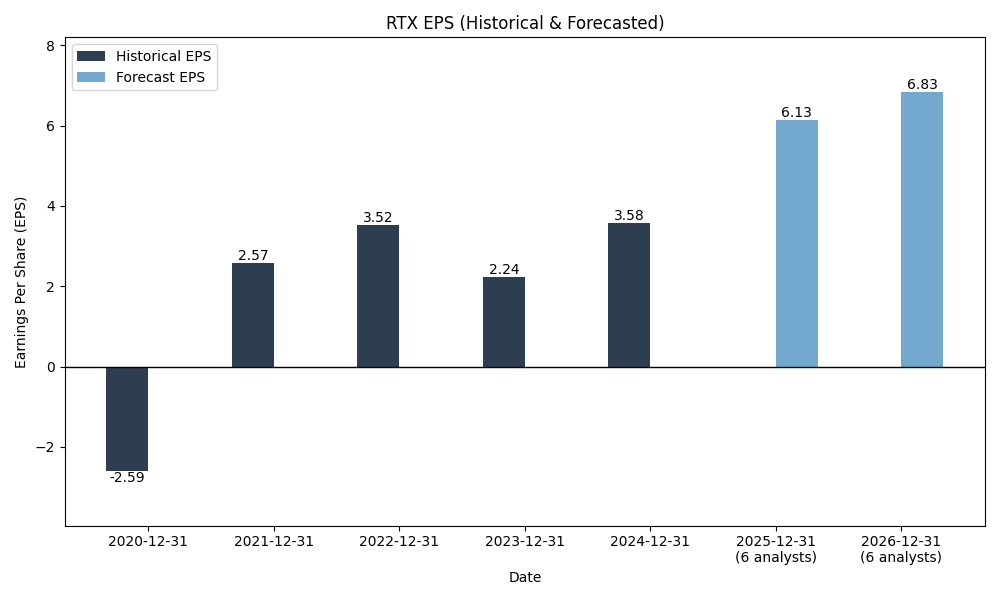
Forecasts
Y/Y % Change
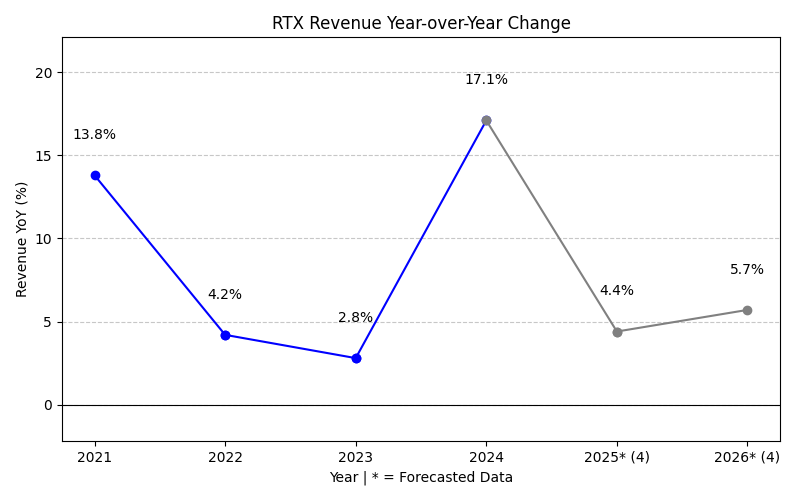
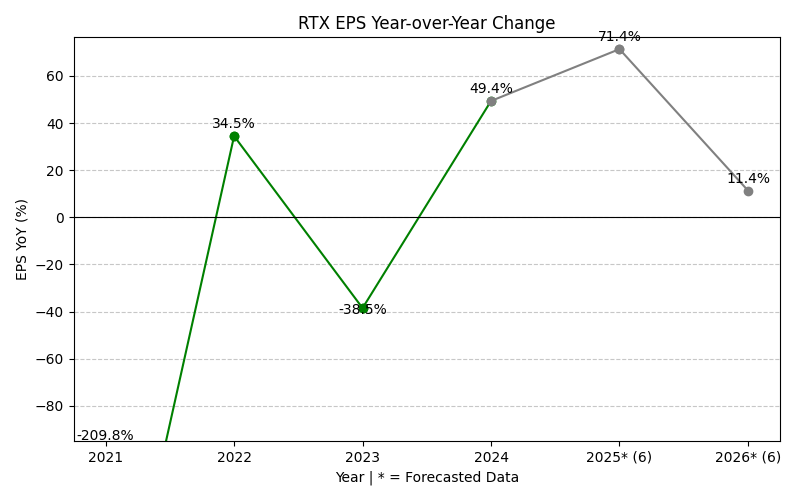
RTX Year-over-Year Growth
| 2020 | 2021 | 2022 | 2023 | 2024 | 2025 | 2026 | 2027 | Average | |
|---|---|---|---|---|---|---|---|---|---|
| Revenue Growth (%) | 13.8% | 4.2% | 2.8% | 17.1% | 9.7% | 6.1% | 7.0% | 8.7% | |
| Revenue Analysts (#) | 0 | 0 | 0 | 0 | 0 | 0 | 22 | 22 | |
| EPS Growth (%) | -209.8% | 34.5% | -38.5% | 49.4% | 41.0% | 38.0% | 9.5% | -10.8% | |
| EPS Analysts (#) | 0 | 0 | 0 | 0 | 0 | 0 | 23 | 23 |
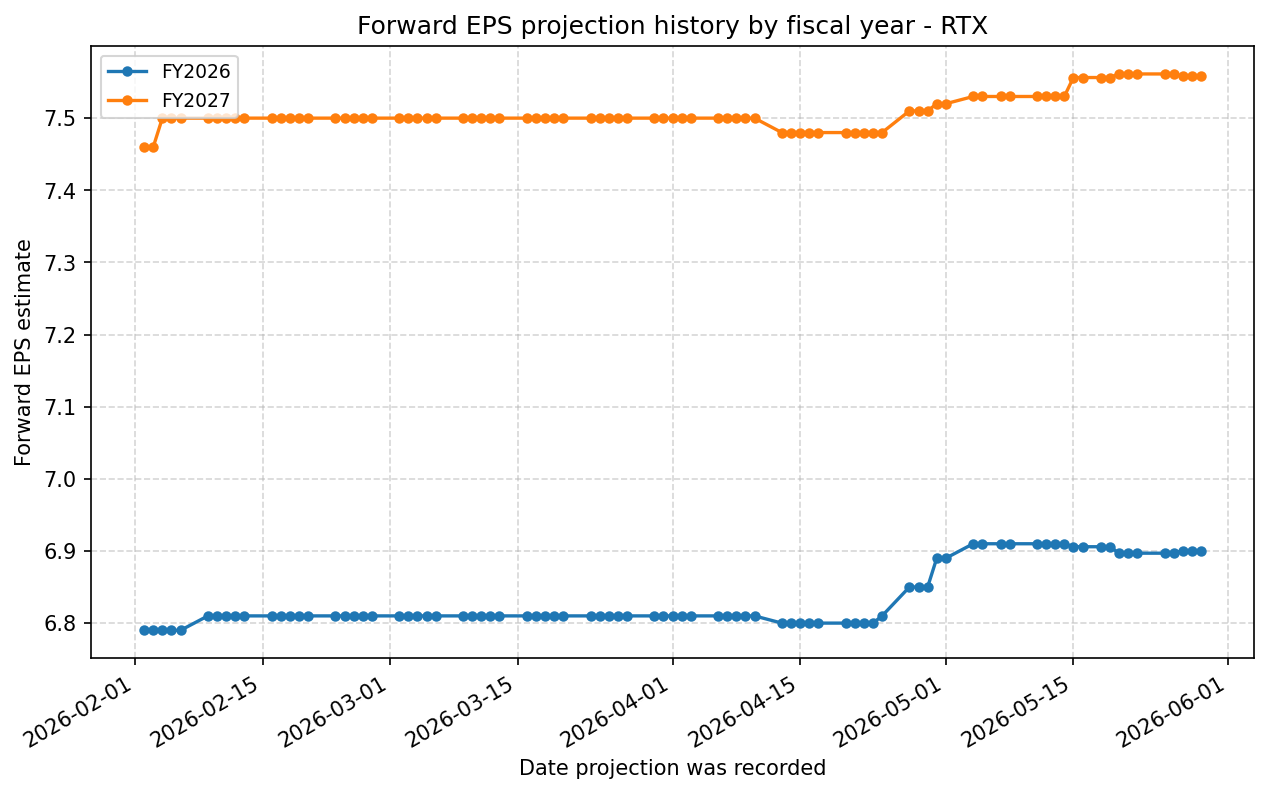
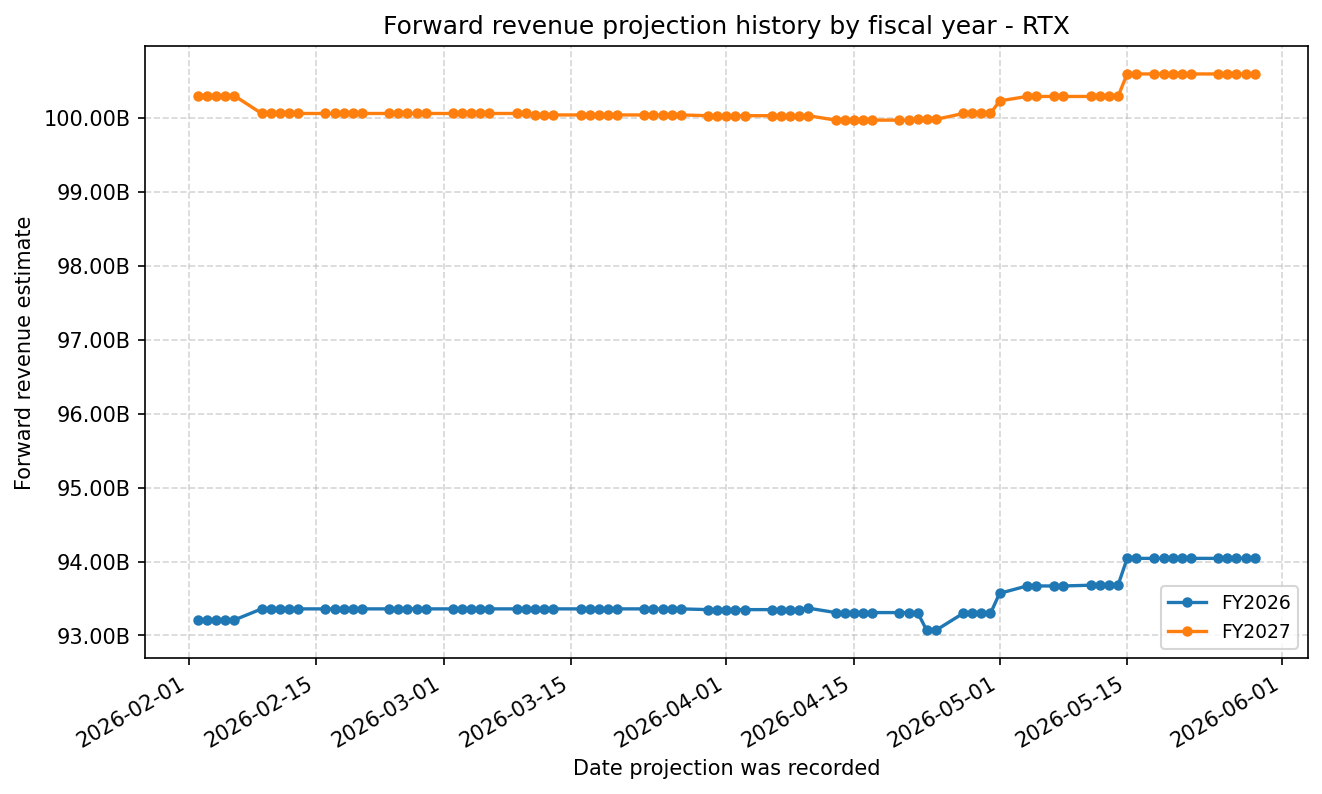
Forward Estimate History
How the next-FY EPS and revenue estimates have drifted over time. One line per fiscal year – past lines end when that FY became current.
Expenses
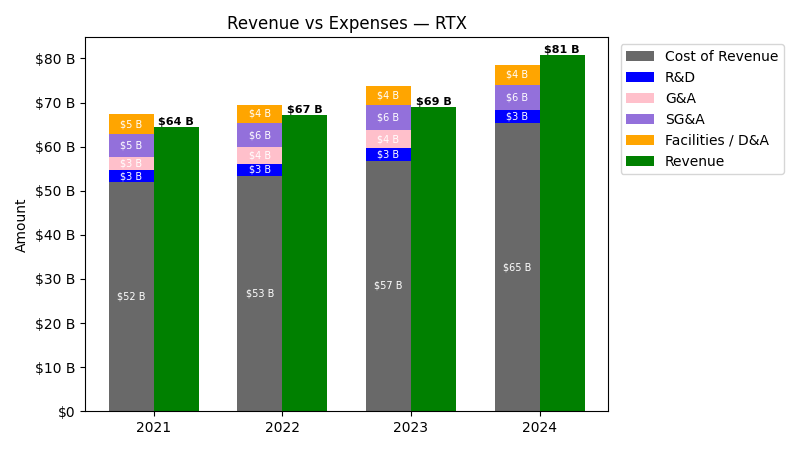
| Year | Revenue ($) | Cost of Revenue ($) | R&D ($) | G&A ($) | SG&A ($) | Facilities / D&A ($) | Personnel ($) |
|---|---|---|---|---|---|---|---|
| 2022 | $67.1B | $49.3B | $2.7B | $3.7B | $5.6B | $4.1B | $-1.9B |
| 2023 | $68.9B | $52.6B | $2.8B | $4.0B | $5.8B | $4.2B | $-1.8B |
| 2024 | $80.7B | $61.0B | $2.9B | $0.0 | $5.8B | $4.4B | $0.0 |
| 2025 | $88.6B | $66.4B | $2.8B | $0.0 | $6.1B | $4.4B | $0.0 |
| TTM | $90.4B | $67.7B | $2.8B | $0.0 | $6.1B | $4.4B | $0.0 |
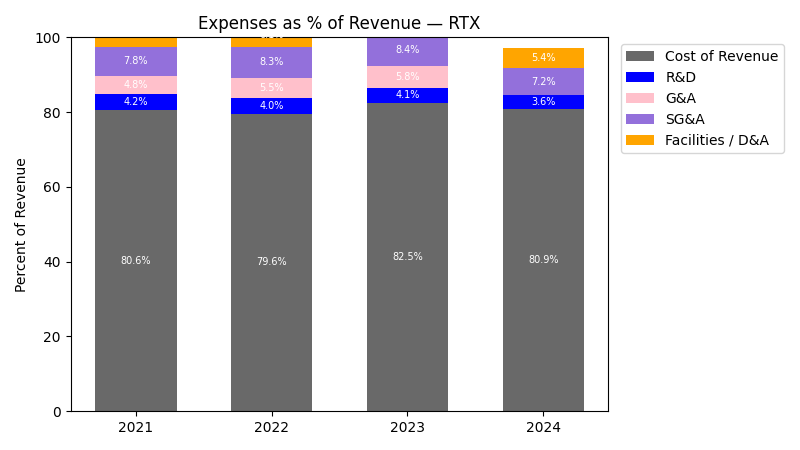
| Year | Revenue Change (%) | Cost of Revenue Change (%) | R&D Change (%) | G&A Change (%) | SG&A Change (%) | Facilities / D&A Change (%) | Personnel Change (%) |
|---|---|---|---|---|---|---|---|
| 2023 | 2.75 | 6.74 | 3.47 | 9.36 | 4.23 | 2.51 | -5.77 |
| 2024 | 17.15 | 15.86 | 4.60 | -100.00 | -0.05 | 3.63 | -100.00 |
| 2025 | 9.74 | 8.98 | -4.33 | NaN | 4.98 | 0.32 | NaN |
| TTM | 2.00 | 1.92 | -0.36 | NaN | 0.46 | 0.43 | NaN |
No unmapped expenses.
Segment Performance
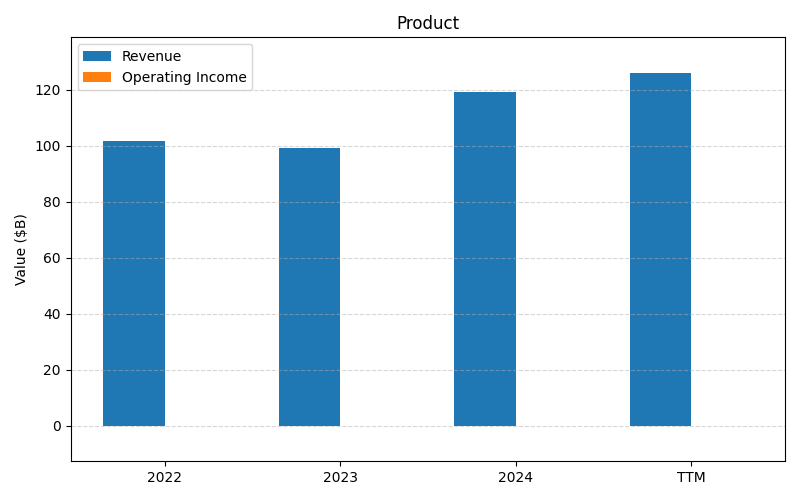
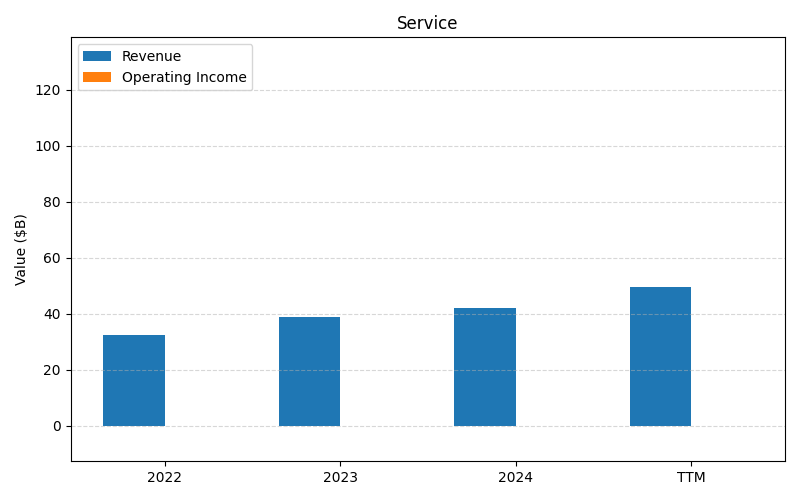
SEGMENTS v2025-09-09 · 2026-05-29 09:14 UTC — Units: $B. Rows list fiscal years (last 3 + TTM) with revenue for each segment; the final row shows the TTM revenue mix (operating income columns display “—” where mix is not applicable).
| Year | Prod Rev | Services Rev | Total Rev |
|---|---|---|---|
| 2023 | 148.7B | 58B | 206.8B |
| 2024 | 178.8B | 63.4B | 242.2B |
| 2025 | 192.5B | 73.3B | 265.8B |
| TTM | 462.4B | 172.8B | 635.2B |
| % of Total (TTM) | 72.8% | 27.2% | 100% |
Segment Performance (Axis 2)
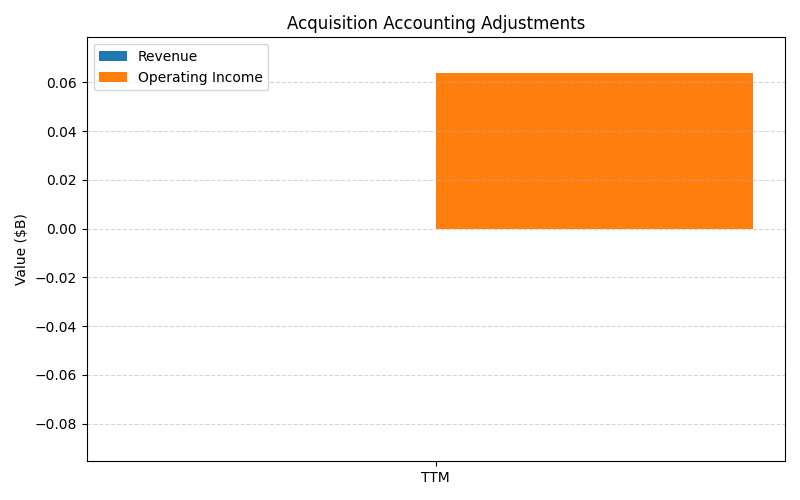
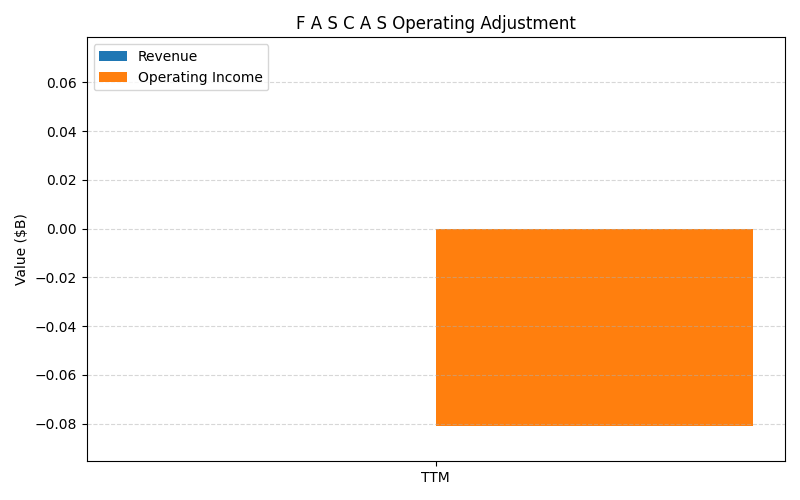
SEGMENTS v2025-09-09 · 2026-05-29 09:14 UTC — Units: $B. Rows list fiscal years (last 3 + TTM) with revenue and operating income for each segment; the final row shows the TTM revenue mix (operating income columns display “—” where mix is not applicable).
| Year | Acquisition Accounting Adjustments Rev | Acquisition Accounting Adjustments OI | F A S C A S Operating Adjustment Rev | F A S C A S Operating Adjustment OI | Total Rev | Total OI |
|---|---|---|---|---|---|---|
| 2023 | – | -2.00B | – | 1.13B | – | -0.87B |
| 2024 | – | -2.06B | – | 0.83B | – | -1.23B |
| 2025 | – | -2.00B | – | 0.75B | – | -1.25B |
| TTM | 0.00B | -5.00B | 0.00B | 1.94B | 0.00B | -3.06B |
Balance Sheet
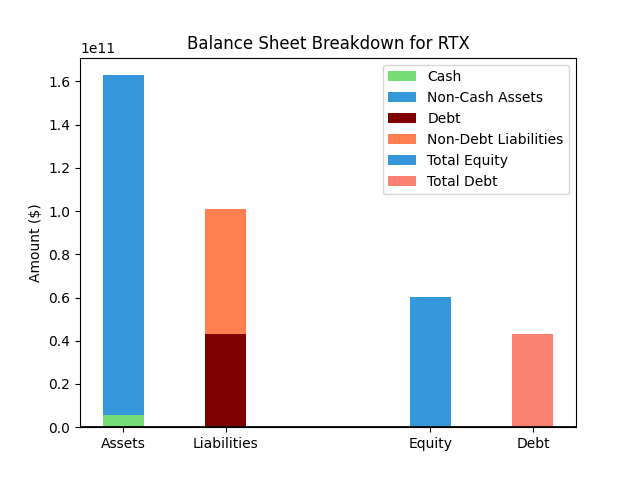
| Metric | Value | |
|---|---|---|
| 0 | Total Assets | $170,431M |
| 1 | Cash | $6,818M |
| 2 | Total Liabilities | $102,397M |
| 3 | Total Debt | $38,935M |
| 4 | Total Equity | $66,280M |
| 5 | Debt to Equity Ratio | 0.59 |
EPS & Dividend
Valuation
| Share Price | Treasury Yield | Estimates | Fair Value (P/E) | Fair Value (P/S) | Current P/S | Current P/E |
|---|---|---|---|---|---|---|
| $179.66 | 4.5% | Nicks Growth: 10% Nick's Expected Margin: 5% FINVIZ Growth: 10% |
Nicks: 17 Finviz: 17 |
Nick's: 0.858 | 2.7 | 33.7 |
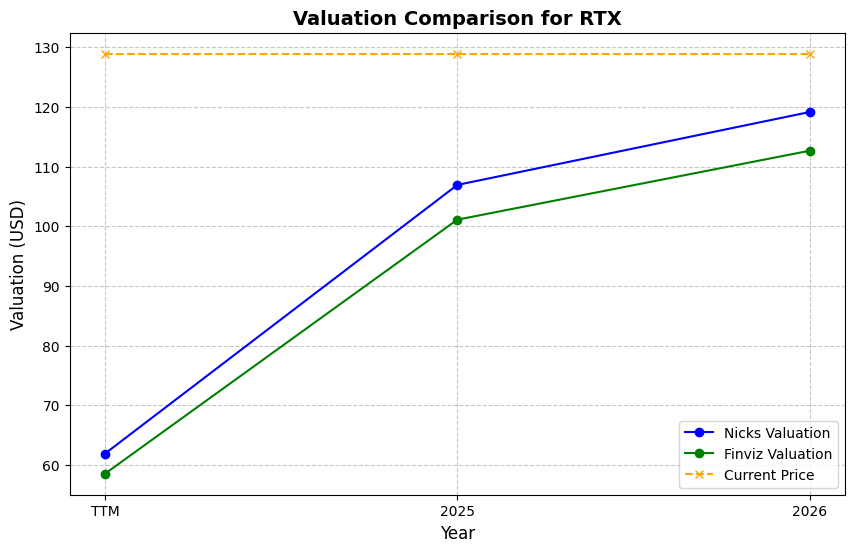
| Basis | Year | Nicks Valuation | Nicks vs Share Price | Finviz Valuation | Finviz vs Share Price |
|---|---|---|---|---|---|
| $5.33 EPS | TTM | $91.45 | -49.1% | $92.32 | -48.6% |
| $6.90 EPS | 2026 | $118.39 | -34.1% | $119.52 | -33.5% |
| $7.56 EPS | 2027 | $129.68 | -27.8% | $130.92 | -27.1% |
Implied Growth
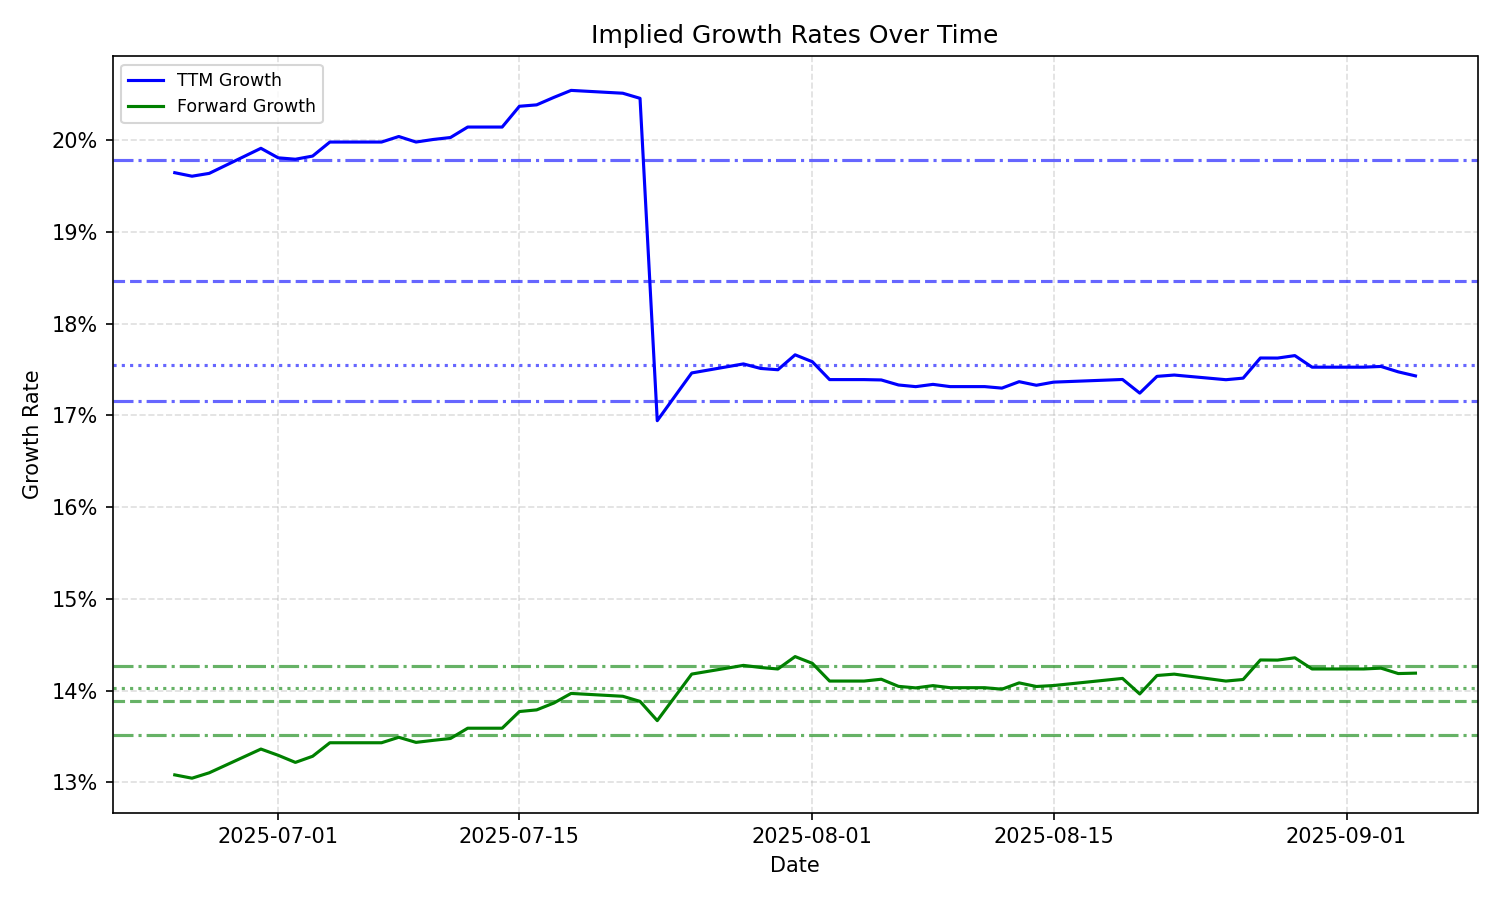
| Average | Median | Std Dev | Current | Percentile | ||||||
|---|---|---|---|---|---|---|---|---|---|---|
| TTM | Forward | TTM | Forward | TTM | Forward | TTM | Forward | TTM | Forward | |
| Timeframe | ||||||||||
| 1 Year | 17.94% | 14.28% | 17.57% | 14.18% | 0.95% | 0.64% | 17.33% | 13.46% | 23.9% | 14.2% |
| 3 Years | 17.94% | 14.28% | 17.57% | 14.18% | 0.95% | 0.64% | 17.33% | 13.46% | 23.9% | 14.2% |
| 5 Years | 17.94% | 14.28% | 17.57% | 14.18% | 0.95% | 0.64% | 17.33% | 13.46% | 23.9% | 14.2% |
| 10 Years | 17.94% | 14.28% | 17.57% | 14.18% | 0.95% | 0.64% | 17.33% | 13.46% | 23.9% | 14.2% |