Rivian Automotive, Inc. — RIVN
| Close Price | Market Cap | P/E Ratio | Forward P/E Ratio | Implied Growth* | Implied Forward Growth* | Dividend | P/B Ratio |
|---|---|---|---|---|---|---|---|
| $16.30 | $21.89B | - | -8.6 | N/A | - | - | 4.7 |
Latest Headlines
- · Stock Market Today, May 29: Rivian Automotive Jumps on R2 SUV Launch Confirmation
- · Rivian Faces NHTSA Probe Covering 115,000 R1 Vehicles
- · Rivian Rallies 8% as Tesla, Nio Stall: R2 Launch and Software Growth in Focus
- · Nio Just Achieved What Rivian and Lucid Dream of. Is It Finally a Buy?
- · Rivian Automotive, Inc. (RIVN) Is a Trending Stock: Facts to Know Before Betting on It
- · NHTSA Probes 115,000 Rivian Vehicles Over Rear Toe Link
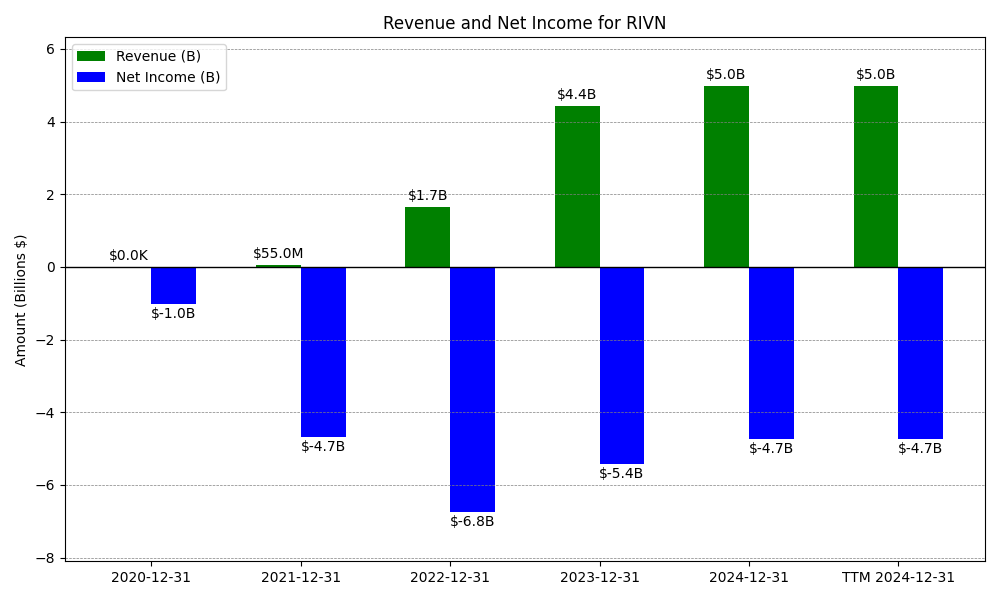
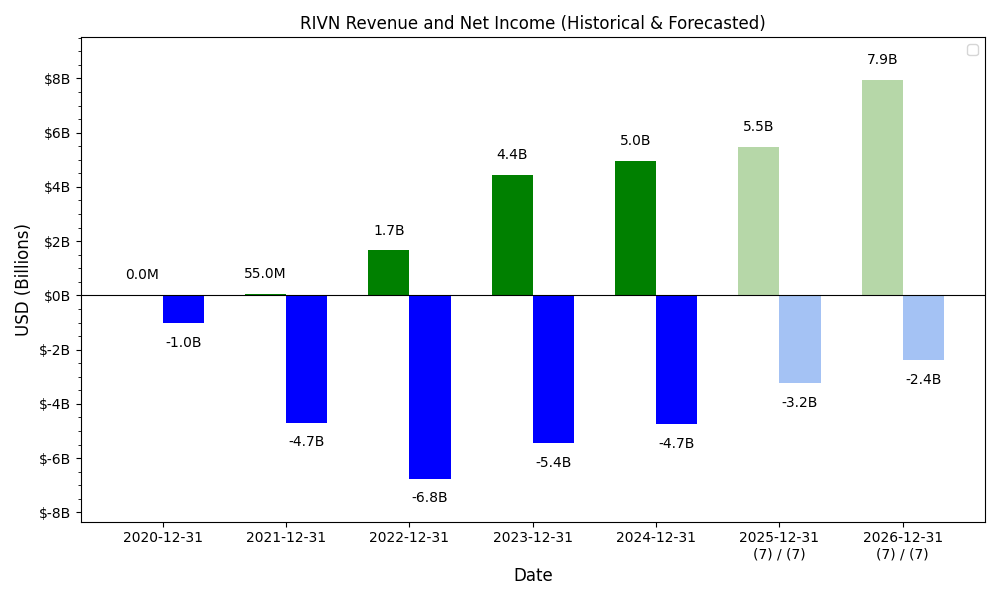
Revenue & Net Income
| Date | Revenue | Net_Income | EPS | Last_Updated | Revenue_Change | Net_Income_Change | EPS_Change | |
|---|---|---|---|---|---|---|---|---|
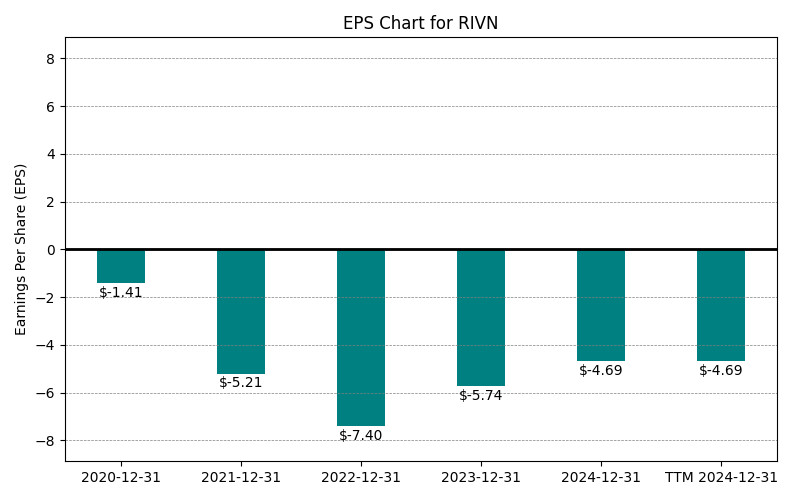
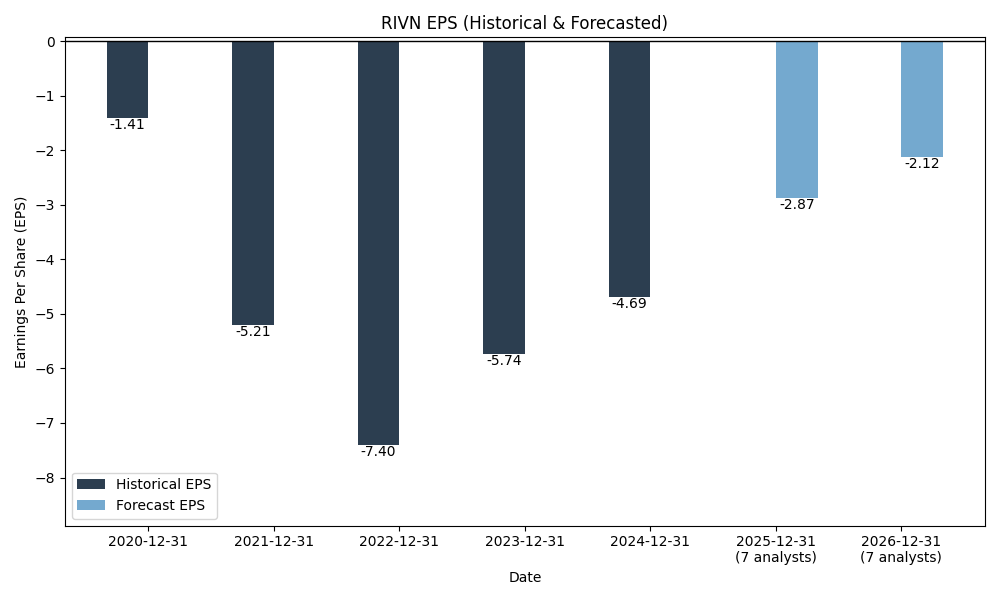
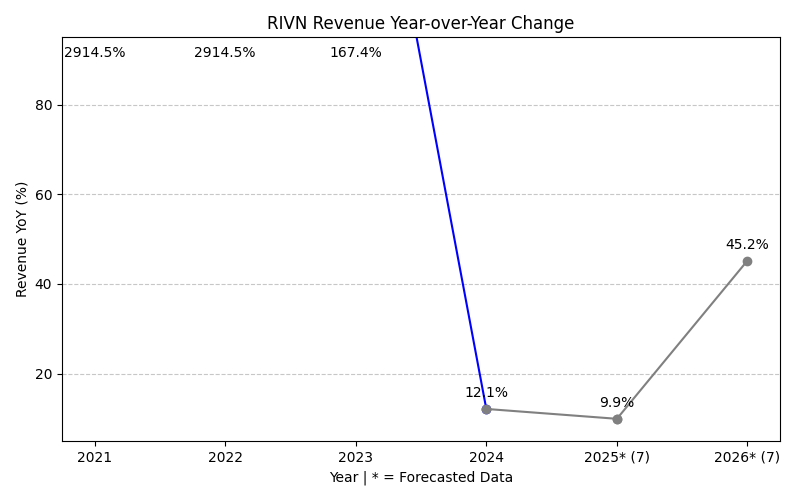
| 0 | 2020-12-31 | $0M | $-1,018M | $-1.41 | 2024-04-02 21:59:45 | N/A | N/A | N/A |
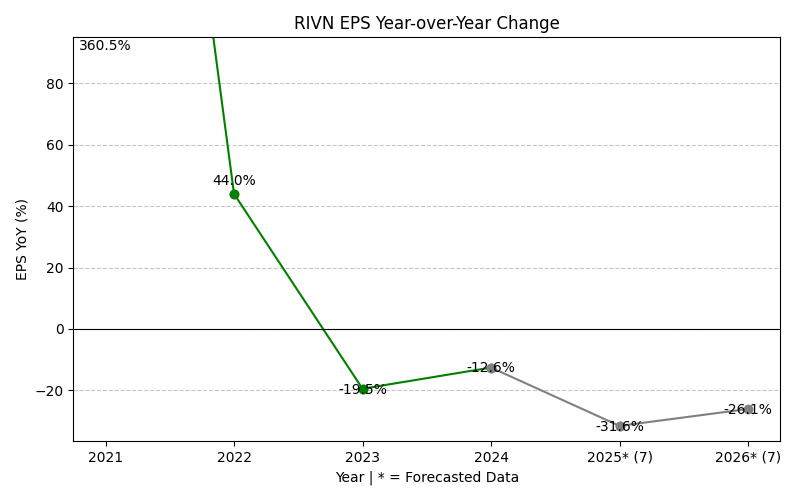
| 1 | 2021-12-31 | $55M | $-4,688M | $-5.21 | 2026-02-13 08:44:48 | inf% | 360.5% | 269.6% |
| 2 | 2022-12-31 | $1,658M | $-6,752M | $-7.40 | 2026-05-29 09:14:11 | 2914.5% | 44.0% | 42.1% |
| 3 | 2023-12-31 | $4,434M | $-5,432M | $-5.74 | 2026-05-29 09:14:11 | 167.4% | -19.5% | -22.4% |
| 4 | 2024-12-31 | $4,970M | $-4,747M | $-4.69 | 2026-05-29 09:14:11 | 12.1% | -12.6% | -18.3% |
| 5 | 2025-12-31 | $5,387M | $-3,646M | $-3.07 | 2026-05-29 09:14:11 | 8.4% | -23.2% | -34.5% |
| 6 | TTM 2026-03-31 | $5,528M | $-3,517M | $-2.92 | 2026-05-04 08:59:23 | 2.6% | -3.5% | -4.9% |
EPS
Forecasts
Y/Y % Change
RIVN Year-over-Year Growth
| 2020 | 2021 | 2022 | 2023 | 2024 | 2025 | 2026 | 2027 | Average | |
|---|---|---|---|---|---|---|---|---|---|
| Revenue Growth (%) | inf% | 2914.5% | 167.4% | 12.1% | 8.4% | 31.2% | 64.5% | inf% | |
| Revenue Analysts (#) | 0 | 0 | 0 | 0 | 0 | 0 | 23 | 24 | |
| EPS Growth (%) | 360.5% | 44.0% | -19.5% | -12.6% | -23.2% | -0.6% | -11.9% | 48.1% | |
| EPS Analysts (#) | 0 | 0 | 0 | 0 | 0 | 0 | 14 | 16 |
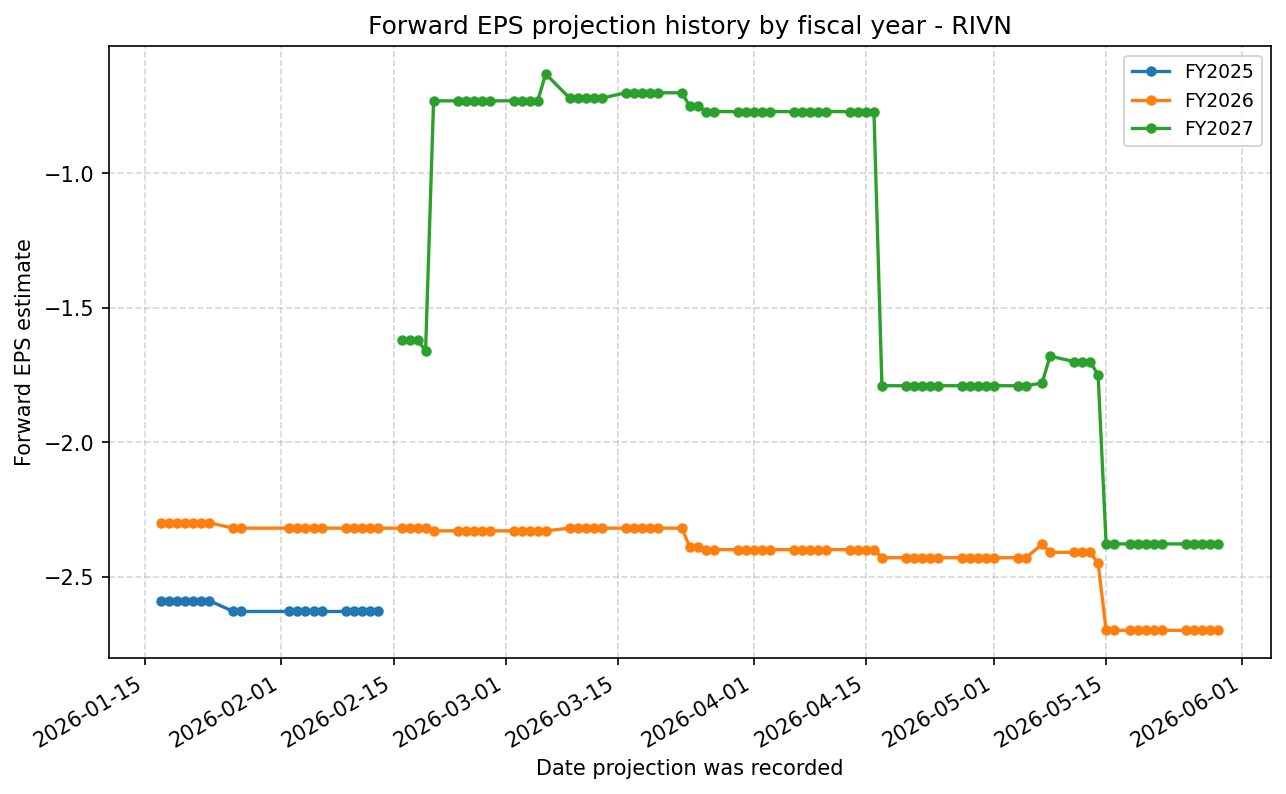
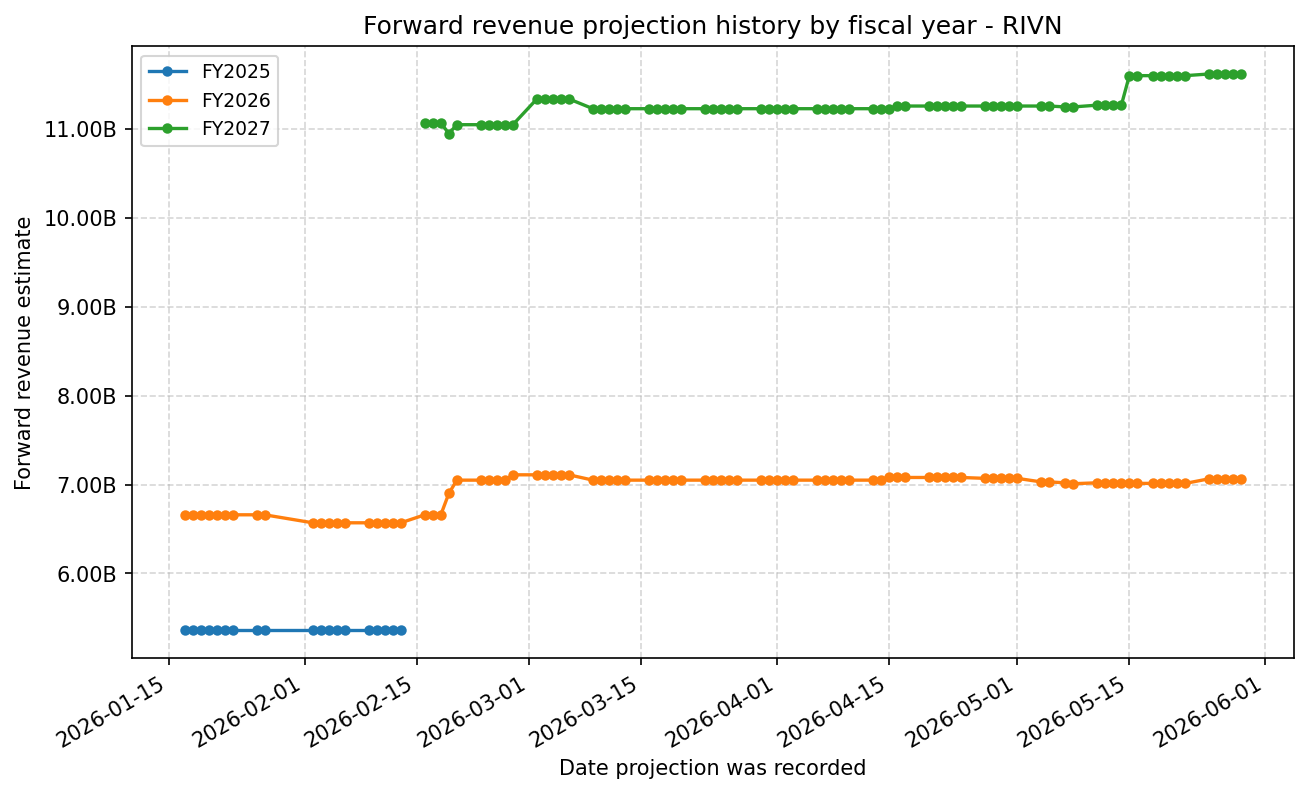
Forward Estimate History
How the next-FY EPS and revenue estimates have drifted over time. One line per fiscal year – past lines end when that FY became current.
Expenses
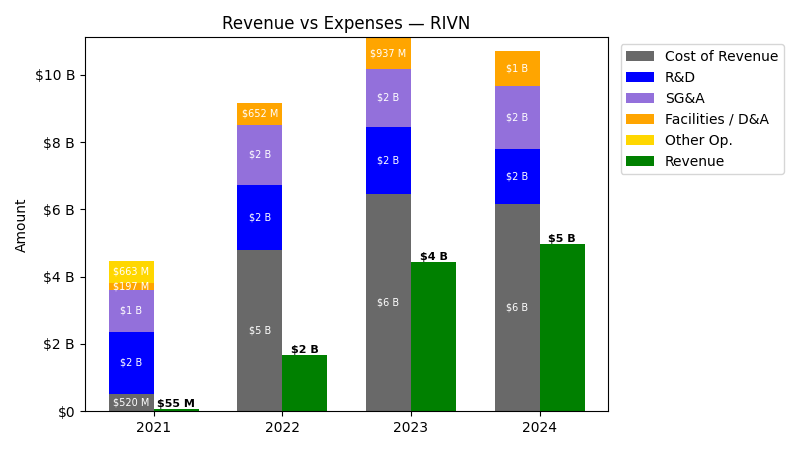
| Year | Revenue ($) | Cost of Revenue ($) | R&D ($) | G&A ($) | SG&A ($) | Facilities / D&A ($) | Personnel ($) |
|---|---|---|---|---|---|---|---|
| 2022 | $1.7B | $4.1B | $1.9B | $0.0 | $1.8B | $652.0M | $0.0 |
| 2023 | $4.4B | $5.5B | $2.0B | $0.0 | $1.7B | $937.0M | $0.0 |
| 2024 | $5.0B | $5.1B | $1.6B | $0.0 | $1.9B | $1.0B | $0.0 |
| 2025 | $5.4B | $3.9B | $1.7B | $1.8B | $1.8B | $784.0M | $324.0M |
| TTM | $5.5B | $4.4B | $1.7B | $931.0M | $1.8B | $778.0M | $174.0M |
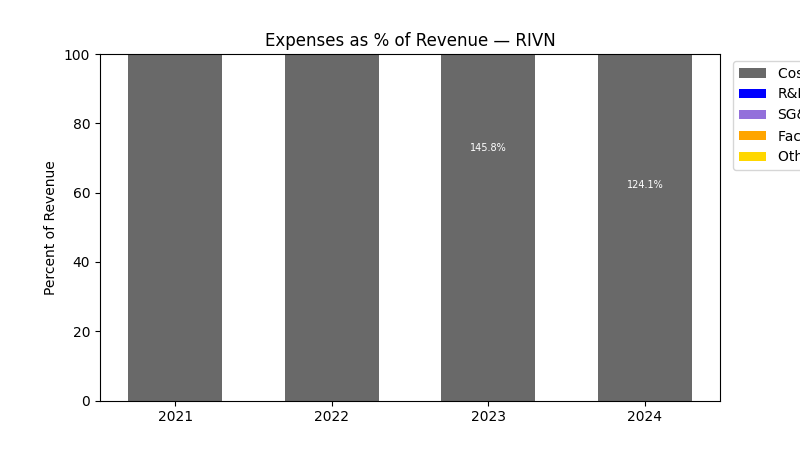
| Year | Revenue Change (%) | Cost of Revenue Change (%) | R&D Change (%) | G&A Change (%) | SG&A Change (%) | Facilities / D&A Change (%) | Personnel Change (%) |
|---|---|---|---|---|---|---|---|
| 2023 | 167.43 | 33.86 | 2.62 | NaN | -4.19 | 43.71 | NaN |
| 2024 | 12.09 | -7.02 | -19.15 | NaN | 9.45 | 10.03 | NaN |
| 2025 | 8.39 | -24.19 | 3.41 | inf | -1.92 | -23.96 | inf |
| TTM | 2.62 | 13.24 | 4.62 | -49.4 | -2.55 | -0.77 | -46.3 |
No unmapped expenses.
Segment Performance
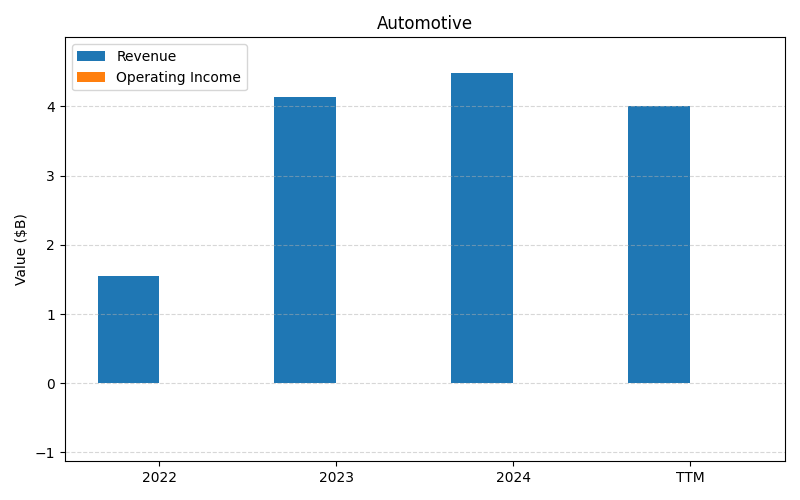
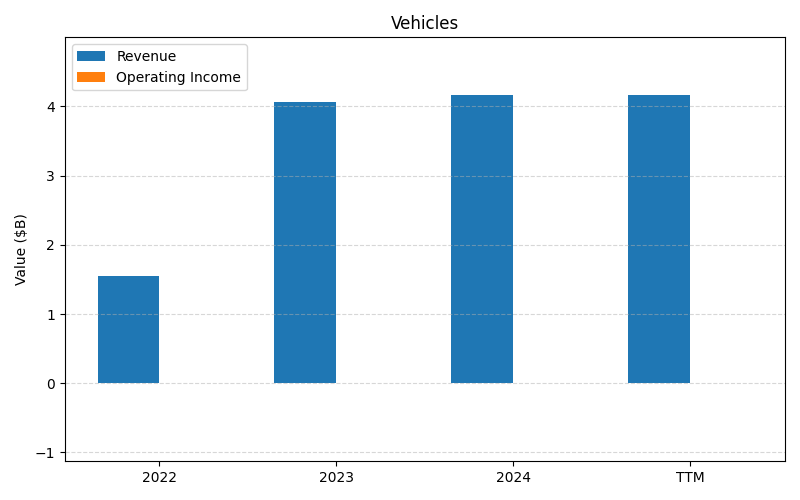
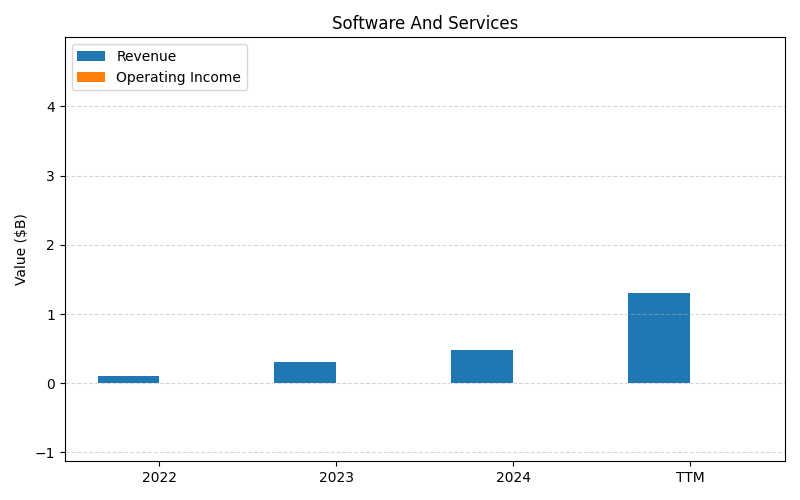
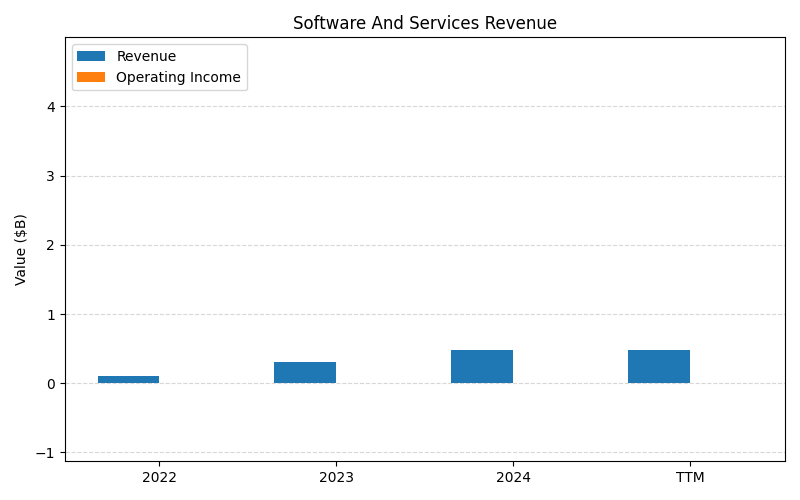
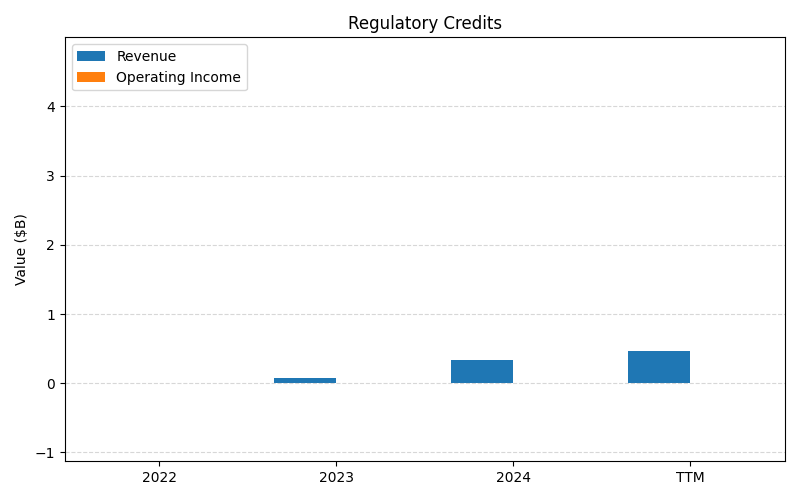
SEGMENTS v2025-09-09 · 2026-05-29 09:14 UTC — Units: $B. Rows list fiscal years (last 3 + TTM) with revenue for each segment; the final row shows the TTM revenue mix (operating income columns display “—” where mix is not applicable).
| Year | Automotive Rev | Vehicles Rev | Software And Services Rev | Software And Services Revenue Rev | Regulatory Credits Rev | Total Rev |
|---|---|---|---|---|---|---|
| 2023 | 4.13B | 4.06B | 0.30B | 0.30B | 0.07B | 8.87B |
| 2024 | 4.49B | 4.16B | 0.48B | 0.48B | 0.33B | 9.94B |
| 2025 | 3.83B | 3.64B | 1.56B | 1.55B | 0.20B | 10.8B |
| TTM | 10.1B | 9.41B | 2.83B | 2.82B | 0.75B | 26B |
| % of Total (TTM) | 39.1% | 36.3% | 10.9% | 10.8% | 2.9% | 100% |
Balance Sheet
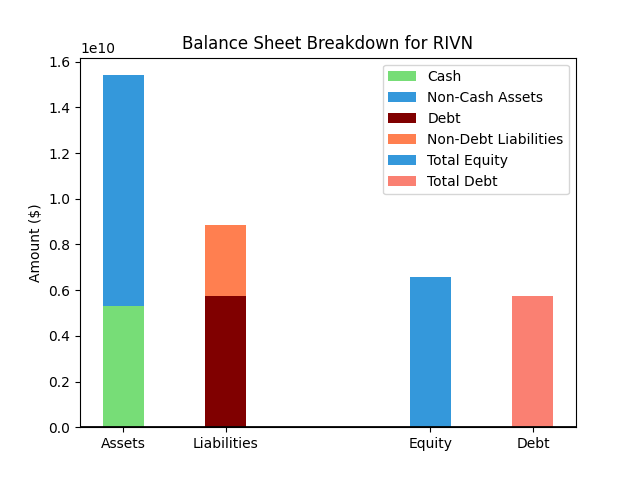
| Metric | Value | |
|---|---|---|
| 0 | Total Assets | $14,233M |
| 1 | Cash | $2,845M |
| 2 | Total Liabilities | $9,804M |
| 3 | Total Debt | $6,576M |
| 4 | Total Equity | $4,403M |
| 5 | Debt to Equity Ratio | 1.49 |
EPS & Dividend

Valuation
| Share Price | Treasury Yield | Estimates | Fair Value (P/E) | Fair Value (P/S) | Current P/S | Current P/E |
|---|---|---|---|---|---|---|
| $16.30 | 4.5% | Nicks Growth: 20% Nick's Expected Margin: 8% FINVIZ Growth: 18% |
Nicks: 42 Finviz: 36 |
Nick's: 3.394 | 4.0 | - |
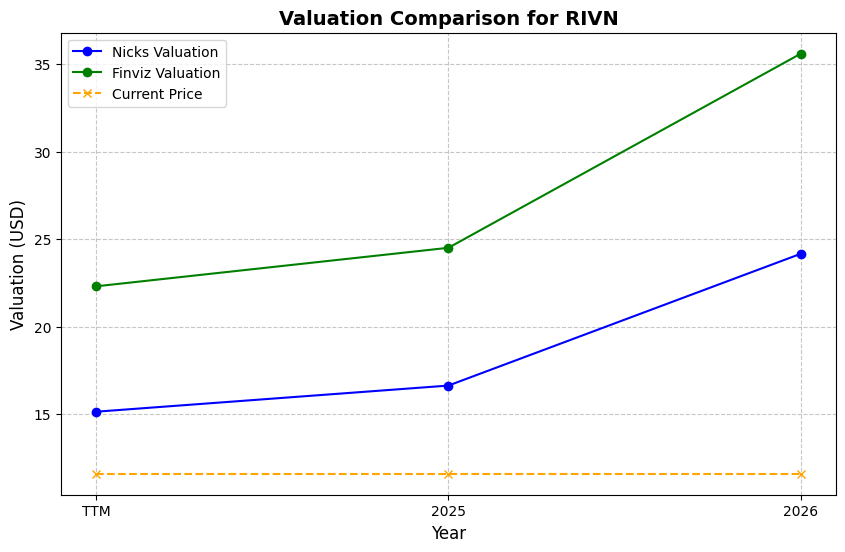
| Basis | Year | Nicks Valuation | Nicks vs Share Price | Finviz Valuation | Finviz vs Share Price |
|---|---|---|---|---|---|
| $4.12 Revenue | TTM | $13.97 | -14.3% | $12.01 | -26.3% |
| $5.26 Revenue | 2026 | $17.86 | 9.6% | $15.36 | -5.8% |
| $8.65 Revenue | 2027 | $29.37 | 80.2% | $25.26 | 54.9% |
Implied Growth

No implied growth data available.