Reddit, Inc. — RDDT
| Close Price | Market Cap | P/E Ratio | Forward P/E Ratio | Implied Growth* | Implied Forward Growth* | Dividend | P/B Ratio |
|---|---|---|---|---|---|---|---|
| $176.00 | $33.88B | 50.3 | 19.9 | 22.0% | 11.6% | - | 10.6 |
Latest Headlines
- · 'Volatility equals opportunity' in options trades as tech soars
- · Reddit integration with Shopify seen driving ad growth, adoption
- · Reddit Inc. (RDDT) Recently Broke Out Above the 20-Day Moving Average
- · They're Finally Considering Credit Card Consolidation After Getting Trapped By Minimum Payments. One Fear Keeps Holding Them Back
- · Paid-Off House, Not in Debt, $911K Net Worth — Can This 59-Year-Old Woman Retire?
- · Futures Trader Says They Have 'Zero Strategy,' Yet They're Still Profitable: I Have A 63% Win Rate On 44 Trades Per Day
Revenue & Net Income
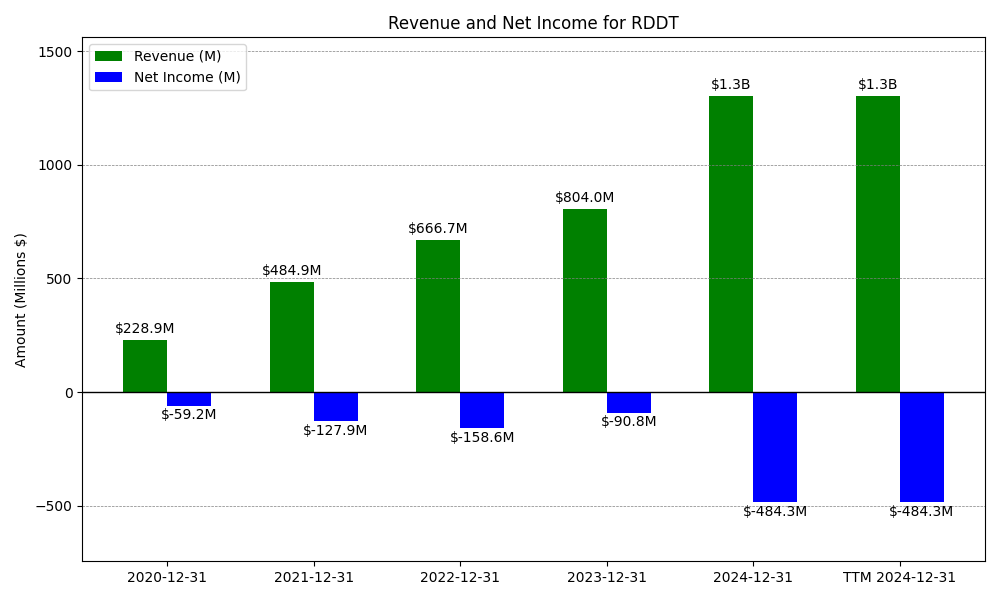
| Date | Revenue | Net_Income | EPS | Last_Updated | Revenue_Change | Net_Income_Change | EPS_Change | |
|---|---|---|---|---|---|---|---|---|
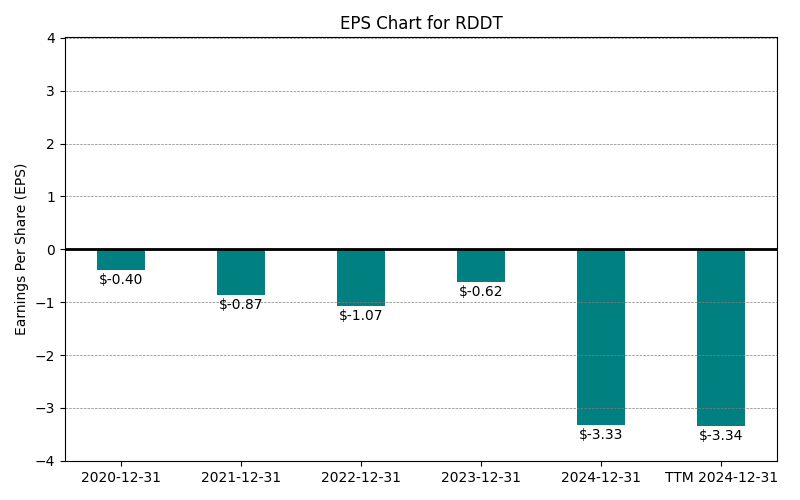
| 0 | 2020-12-31 | $229M | $-59M | $-0.40 | 2024-05-16 18:41:07 | N/A | N/A | N/A |
| 1 | 2021-12-31 | $485M | $-128M | $-1.07 | 2026-02-09 08:50:07 | 111.8% | 116.1% | 167.9% |
| 2 | 2022-12-31 | $667M | $-159M | $-1.07 | 2026-05-29 09:14:05 | 37.5% | 24.0% | 0.0% |
| 3 | 2023-12-31 | $804M | $-91M | $-0.57 | 2026-05-29 09:14:05 | 20.6% | -42.7% | -46.8% |
| 4 | 2024-12-31 | $1,300M | $-484M | $-3.33 | 2026-05-29 09:14:05 | 61.7% | 433.2% | 482.9% |
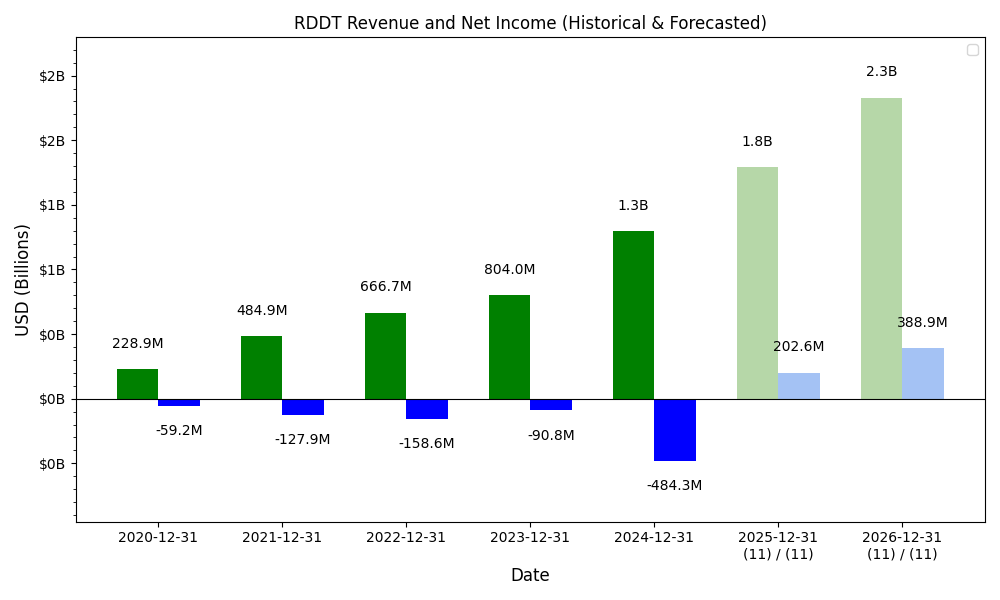
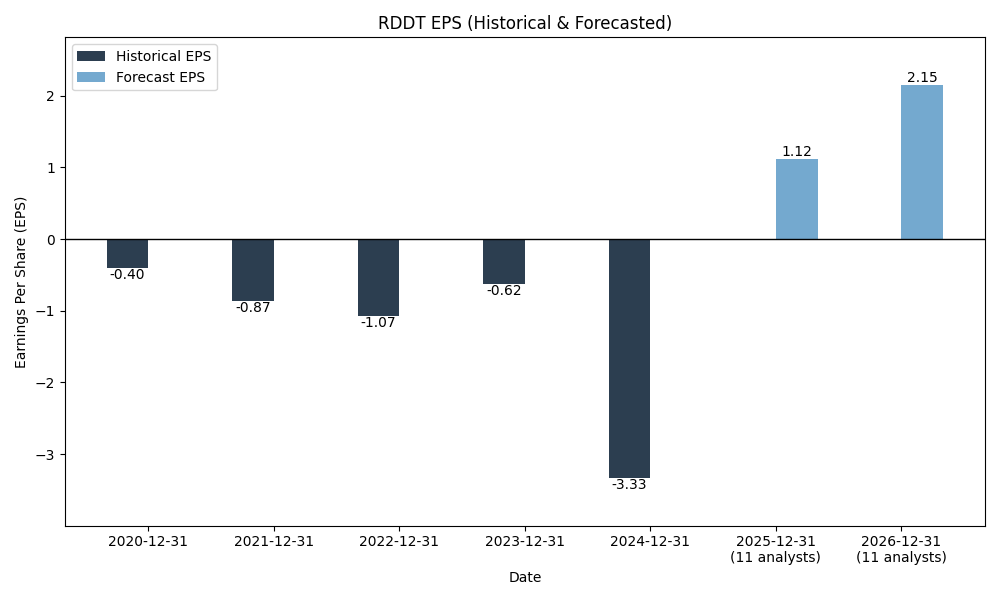
| 5 | 2025-12-31 | $2,203M | $530M | $2.84 | 2026-05-29 09:14:05 | 69.4% | -209.4% | -185.3% |
| 6 | TTM 2026-03-31 | $2,474M | $708M | $3.50 | 2026-05-04 08:59:17 | 12.3% | 33.6% | 23.2% |
EPS
Forecasts
Y/Y % Change
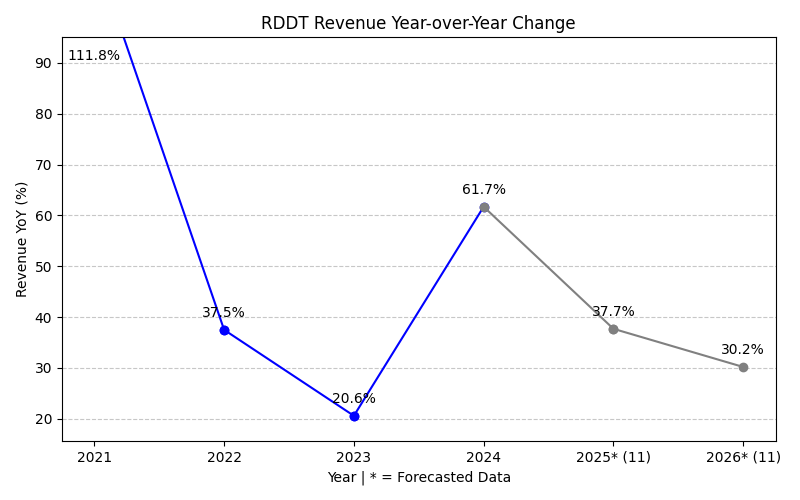
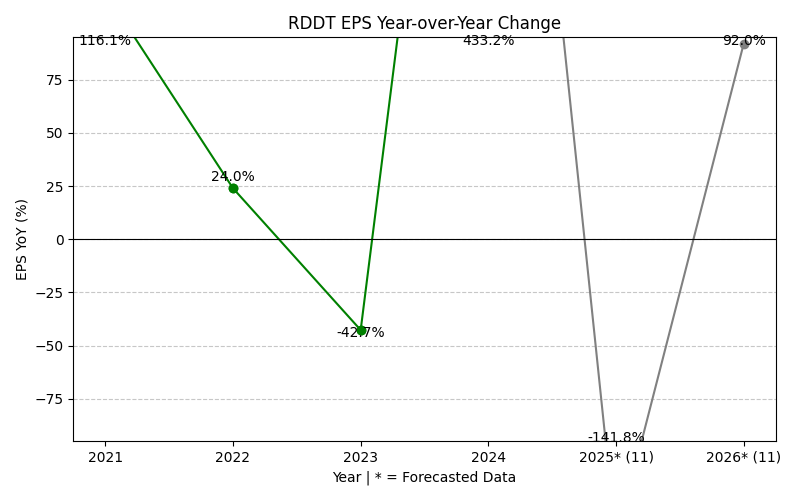
RDDT Year-over-Year Growth
| 2020 | 2021 | 2022 | 2023 | 2024 | 2025 | 2026 | 2027 | Average | |
|---|---|---|---|---|---|---|---|---|---|
| Revenue Growth (%) | 111.8% | 37.5% | 20.6% | 61.7% | 69.4% | 46.6% | 31.6% | 54.2% | |
| Revenue Analysts (#) | 0 | 0 | 0 | 0 | 0 | 0 | 29 | 31 | |
| EPS Growth (%) | 116.1% | 24.0% | -42.7% | 433.2% | -209.4% | 80.3% | 29.9% | 61.6% | |
| EPS Analysts (#) | 0 | 0 | 0 | 0 | 0 | 0 | 26 | 28 |
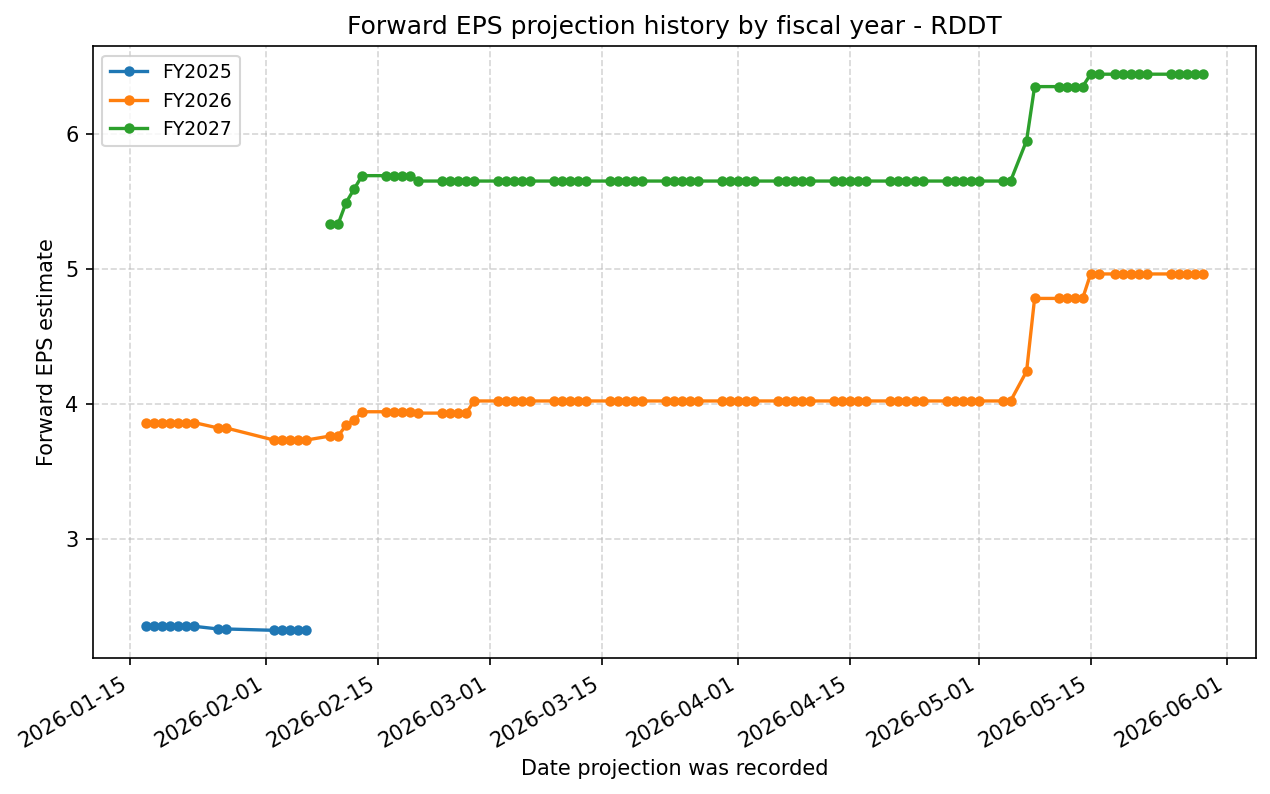
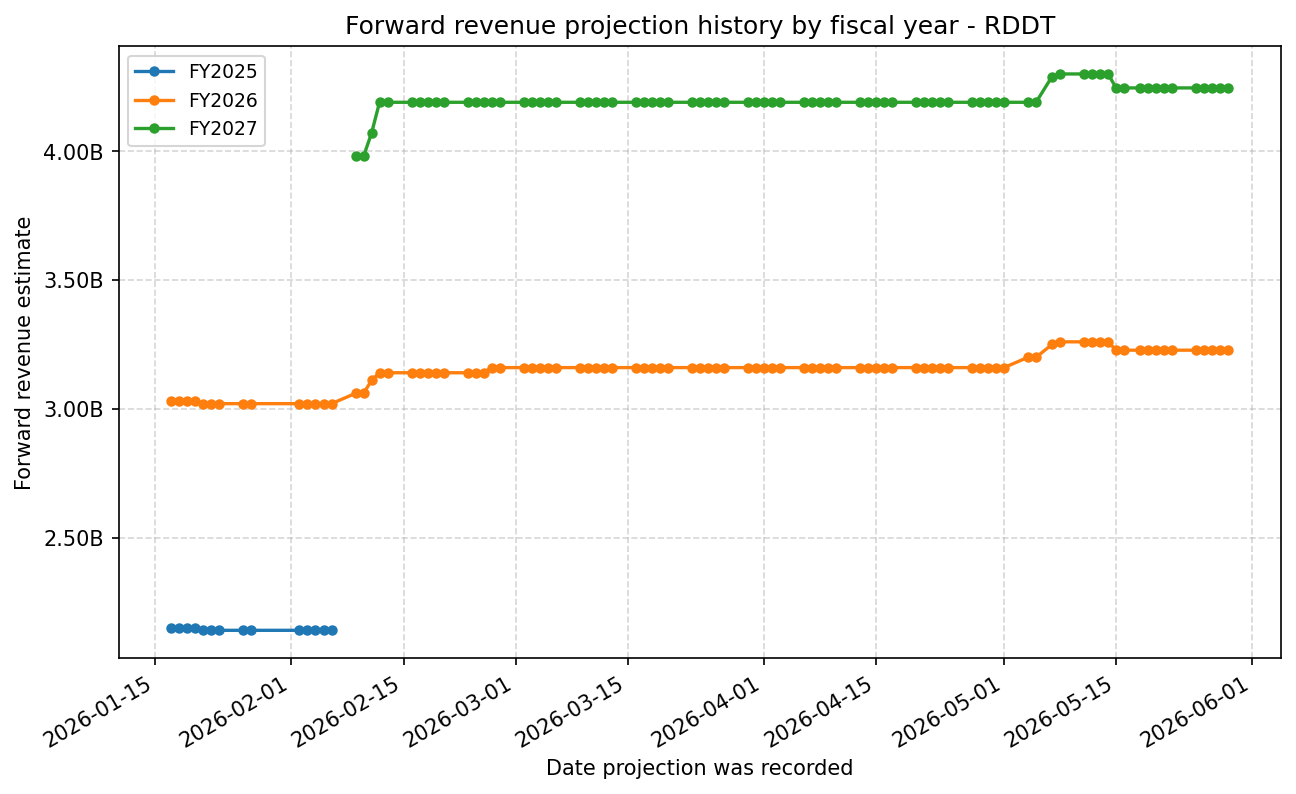
Forward Estimate History
How the next-FY EPS and revenue estimates have drifted over time. One line per fiscal year – past lines end when that FY became current.
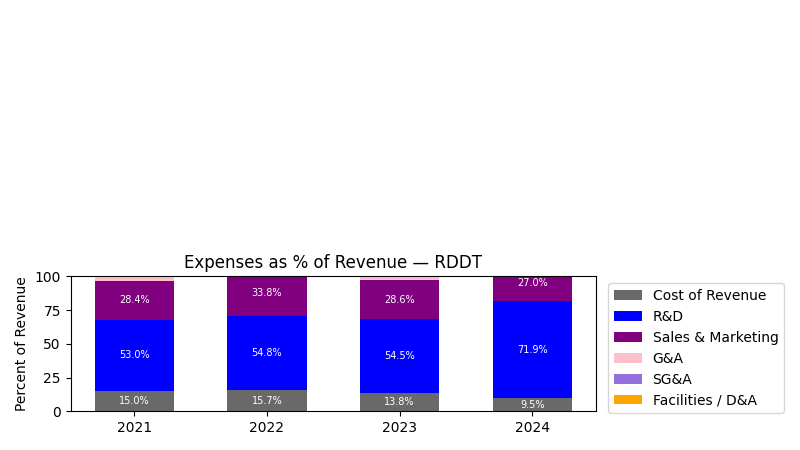
Expenses
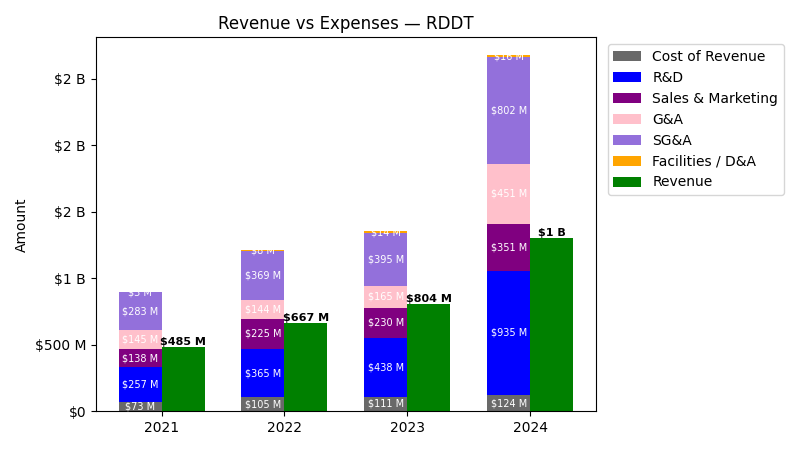
| Year | Revenue ($) | Cost of Revenue ($) | R&D ($) | Sales & Marketing ($) | G&A ($) | SG&A ($) | Facilities / D&A ($) |
|---|---|---|---|---|---|---|---|
| 2021 | $484.9M | $69.8M | $257.0M | $137.9M | $144.7M | $282.6M | $2.8M |
| 2022 | $666.7M | $96.8M | $365.2M | $225.1M | $143.8M | $368.9M | $8.0M |
| 2023 | $804.0M | $97.3M | $438.3M | $230.2M | $164.7M | $394.8M | $13.7M |
| 2024 | $1.3B | $108.0M | $935.2M | $350.6M | $451.4M | $802.0M | $15.6M |
| 2025 | $2.2B | $178.3M | $783.1M | $503.9M | $279.3M | $783.2M | $15.9M |
| TTM | $2.5B | $197.2M | $799.1M | $564.6M | $275.4M | $840.0M | $16.2M |
| Year | Revenue Change (%) | Cost of Revenue Change (%) | R&D Change (%) | Sales & Marketing Change (%) | G&A Change (%) | SG&A Change (%) | Facilities / D&A Change (%) |
|---|---|---|---|---|---|---|---|
| 2022 | 37.49 | 38.78 | 42.10 | 63.26 | -0.62 | 30.54 | 184.39 |
| 2023 | 20.60 | 0.53 | 20.04 | 2.26 | 14.49 | 7.03 | 71.28 |
| 2024 | 61.71 | 10.94 | 113.34 | 52.31 | 174.17 | 103.13 | 14.17 |
| 2025 | 69.40 | 65.14 | -16.25 | 43.72 | -38.13 | -2.35 | 1.95 |
| TTM | 12.31 | 10.62 | 2.04 | 12.06 | -1.40 | 7.26 | 1.55 |
No unmapped expenses.
Segment Performance
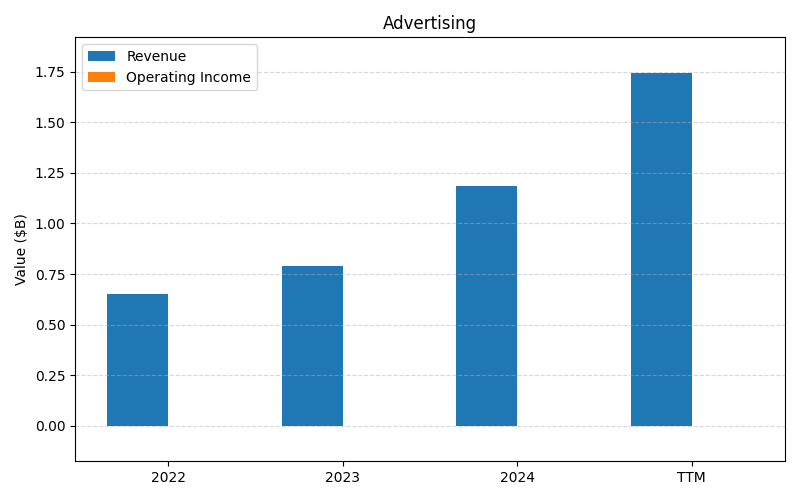
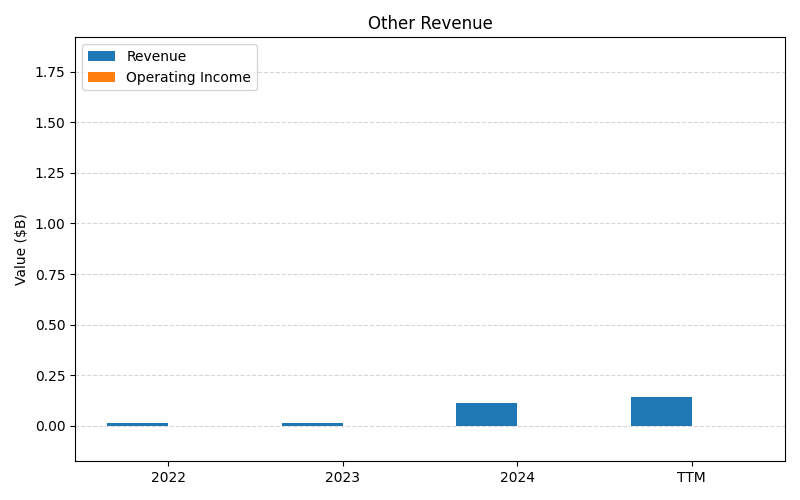
SEGMENTS v2025-09-09 · 2026-05-29 09:14 UTC — Units: $B. Rows list fiscal years (last 3 + TTM) with revenue for each segment; the final row shows the TTM revenue mix (operating income columns display “—” where mix is not applicable).
| Year | Advertising Rev | Other Revenue Rev | Total Rev |
|---|---|---|---|
| 2023 | 0.79B | 0.02B | 0.80B |
| 2024 | 1.19B | 0.11B | 1.30B |
| 2025 | 2.06B | 0.14B | 2.20B |
| TTM | 4.23B | 0.33B | 4.56B |
| % of Total (TTM) | 92.8% | 7.2% | 100% |
Balance Sheet
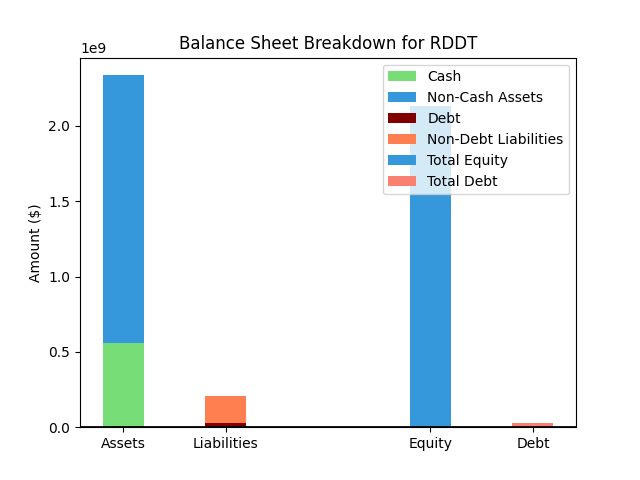
| Metric | Value | |
|---|---|---|
| 0 | Total Assets | $3,484M |
| 1 | Cash | $1,374M |
| 2 | Total Liabilities | $305M |
| 3 | Total Debt | $21M |
| 4 | Total Equity | $3,180M |
| 5 | Debt to Equity Ratio | 0.01 |
EPS & Dividend

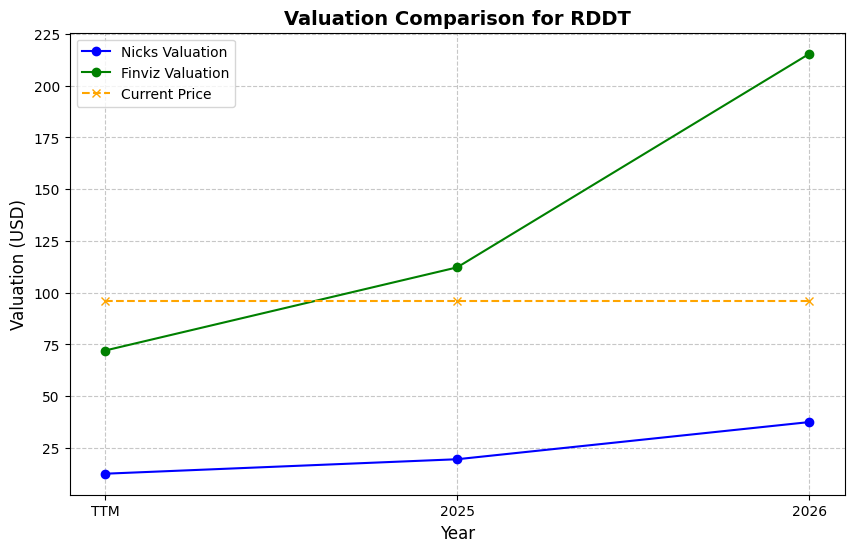
Valuation
| Share Price | Treasury Yield | Estimates | Fair Value (P/E) | Fair Value (P/S) | Current P/S | Current P/E |
|---|---|---|---|---|---|---|
| $176.00 | 4.5% | Nicks Growth: 10% Nick's Expected Margin: 10% FINVIZ Growth: 47% |
Nicks: 17 Finviz: 357 |
Nick's: 1.716 | 13.7 | 50.3 |
| Basis | Year | Nicks Valuation | Nicks vs Share Price | Finviz Valuation | Finviz vs Share Price |
|---|---|---|---|---|---|
| $3.50 EPS | TTM | $60.05 | -65.9% | $1248.61 | 609.4% |
| $4.96 EPS | 2026 | $85.14 | -51.6% | $1770.23 | 905.8% |
| $6.44 EPS | 2027 | $110.56 | -37.2% | $2298.77 | 1206.1% |
Implied Growth
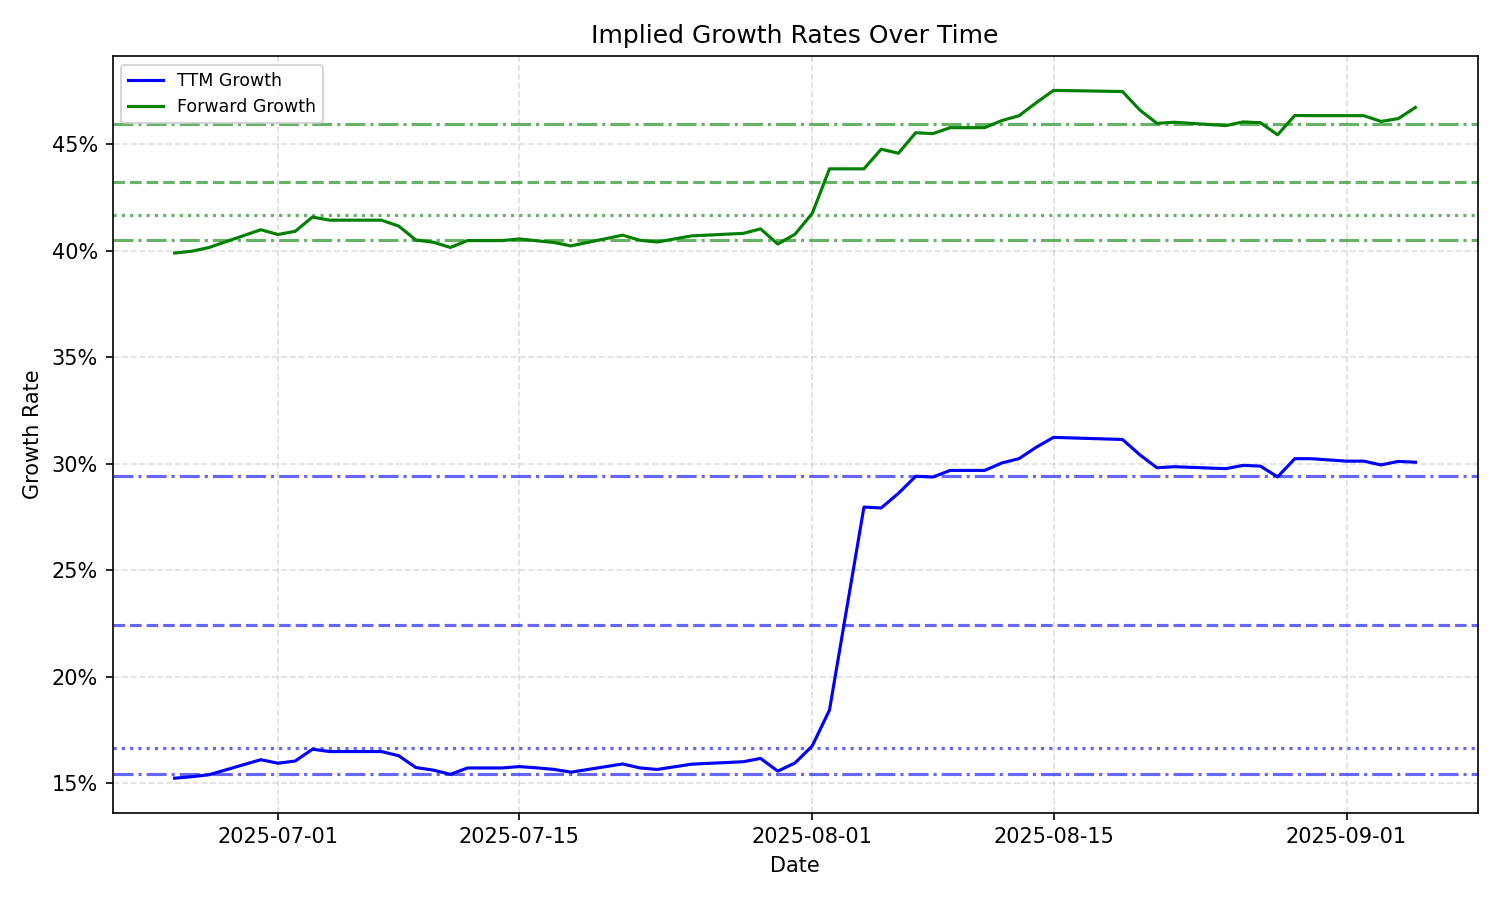
| Average | Median | Std Dev | Current | Percentile | ||||||
|---|---|---|---|---|---|---|---|---|---|---|
| TTM | Forward | TTM | Forward | TTM | Forward | TTM | Forward | TTM | Forward | |
| Timeframe | ||||||||||
| 1 Year | 25.61% | 29.78% | 28.16% | 40.47% | 5.27% | 16.38% | 21.42% | 11.08% | 22.3% | 30.6% |
| 3 Years | 25.61% | 29.78% | 28.16% | 40.47% | 5.27% | 16.38% | 21.42% | 11.08% | 22.3% | 30.6% |
| 5 Years | 25.61% | 29.78% | 28.16% | 40.47% | 5.27% | 16.38% | 21.42% | 11.08% | 22.3% | 30.6% |
| 10 Years | 25.61% | 29.78% | 28.16% | 40.47% | 5.27% | 16.38% | 21.42% | 11.08% | 22.3% | 30.6% |