Royal Caribbean Cruises Ltd. — RCL
| Close Price | Market Cap | P/E Ratio | Forward P/E Ratio | Implied Growth* | Implied Forward Growth* | Dividend | P/B Ratio |
|---|---|---|---|---|---|---|---|
| $284.63 | $76.34B | 17.4 | 14.2 | 10.1% | 8.0% | $5.00 1.8% | 7.8 |
Latest Headlines
- · Did You Know That Viking Holdings Has Doubled Over the Past Year?
- · Prediction: Royal Caribbean Still Has Room to Run Despite Rally
- · Walmart and 5 More Consumer Stocks to Buy After a Solid Retail Earnings Season
- · Stocks Settle Mixed on Conflicting US-Iran Signals
- · Forget the K-Shaped Recovery. Ed Yardeni Says It’s Now a ‘G’ Thang.
- · Cruise stocks surge as oil slides 3% on U.S.-Iran deal hopes
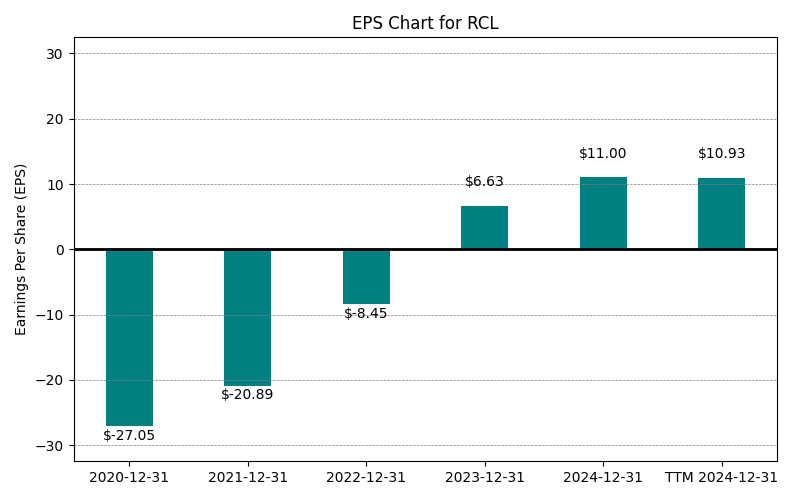
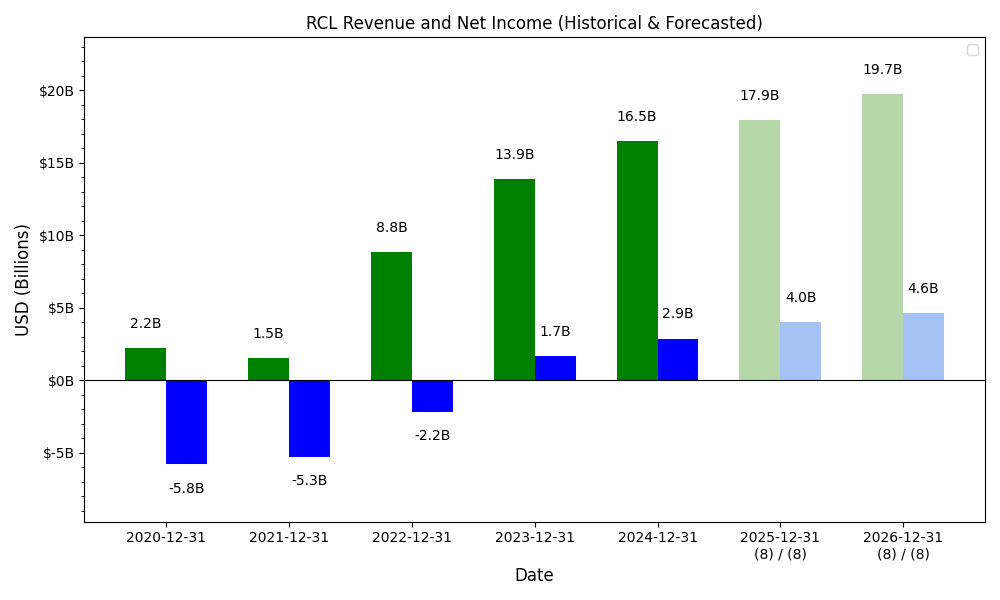
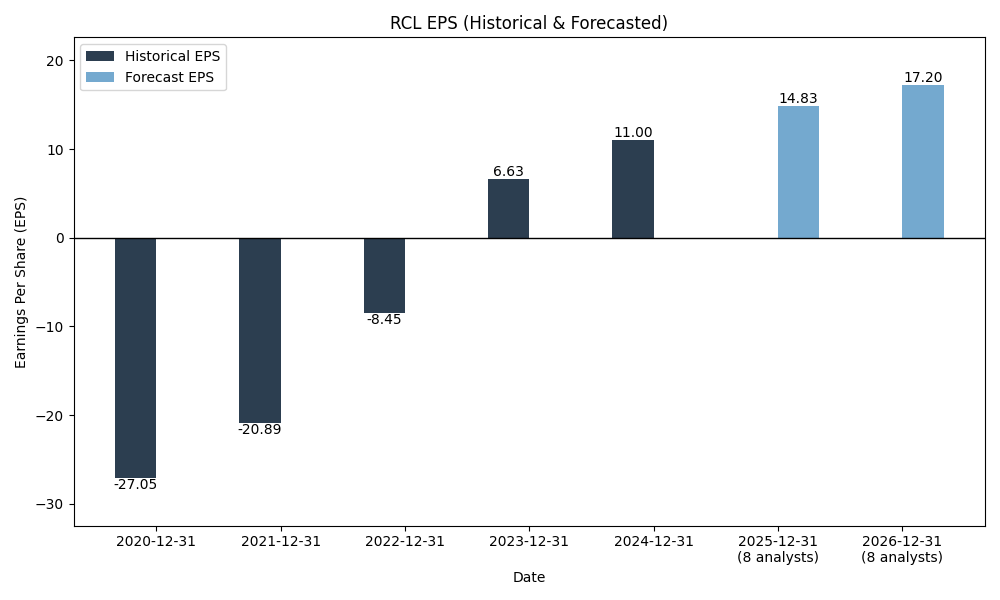
Revenue & Net Income
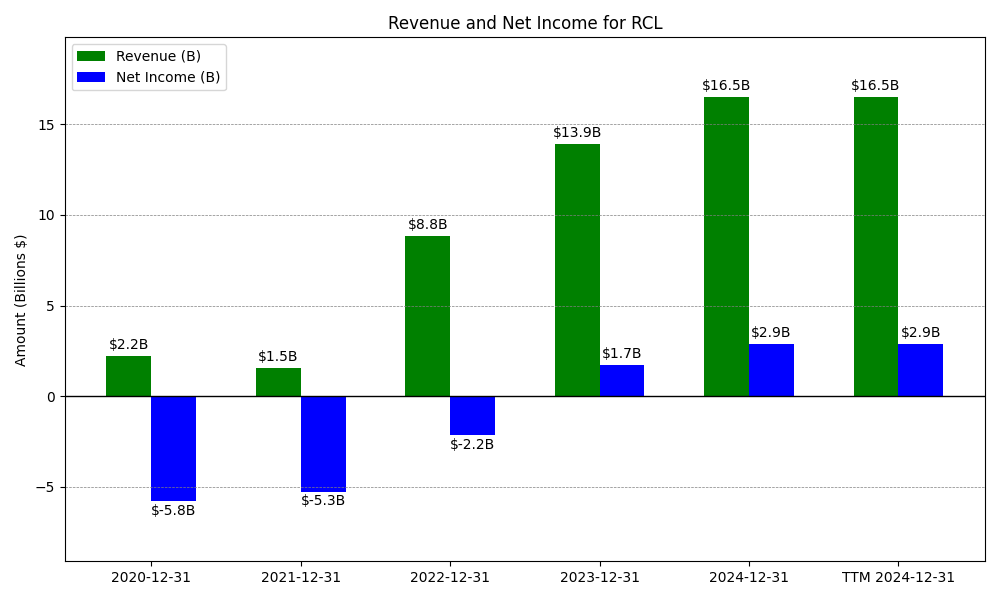
| Date | Revenue | Net_Income | EPS | Last_Updated | Revenue_Change | Net_Income_Change | EPS_Change | |
|---|---|---|---|---|---|---|---|---|
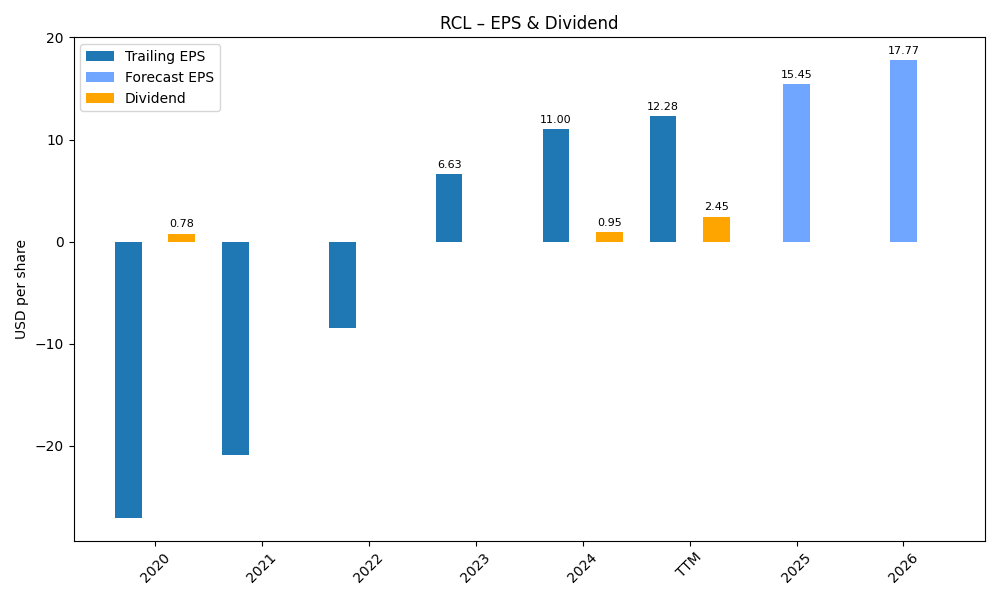
| 0 | 2020-12-31 | $2,209M | $-5,797M | $-27.05 | 2024-02-03 03:17:10 | N/A | N/A | N/A |
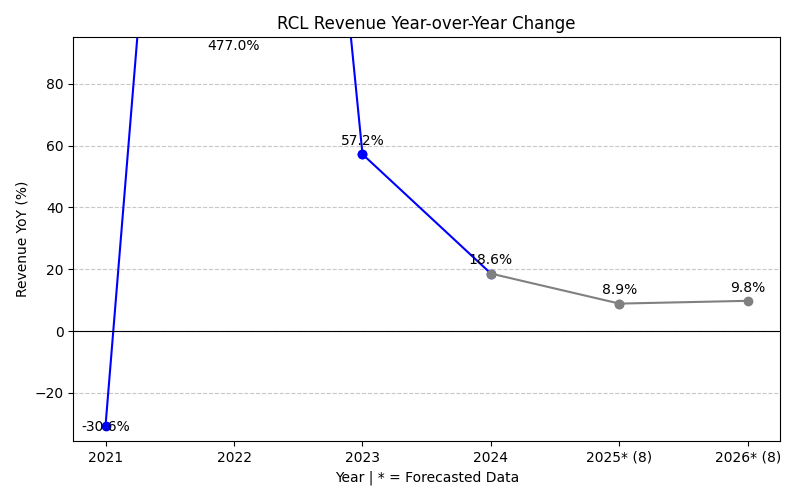
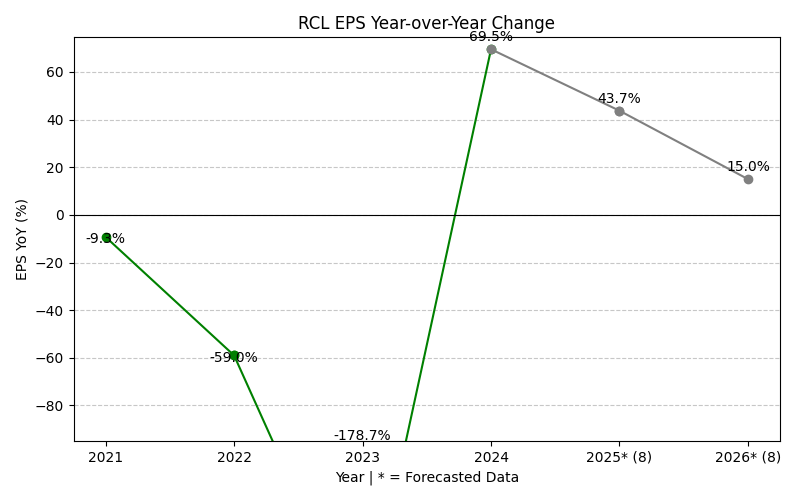
| 1 | 2021-12-31 | $1,532M | $-5,260M | $-20.89 | 2026-02-13 08:44:33 | -30.6% | -9.3% | -22.8% |
| 2 | 2022-12-31 | $8,840M | $-2,156M | $-8.45 | 2026-05-29 09:13:59 | 477.0% | -59.0% | -59.6% |
| 3 | 2023-12-31 | $13,900M | $1,697M | $6.63 | 2026-05-29 09:13:59 | 57.2% | -178.7% | -178.5% |
| 4 | 2024-12-31 | $16,485M | $2,877M | $11.00 | 2026-05-29 09:13:59 | 18.6% | 69.5% | 65.9% |
| 5 | 2025-12-31 | $17,934M | $4,268M | $15.75 | 2026-05-29 09:13:59 | 8.8% | 48.3% | 43.2% |
| 6 | TTM 2026-03-31 | $18,387M | $4,480M | $16.40 | 2026-05-01 08:47:32 | 2.5% | 5.0% | 4.1% |
EPS
Forecasts
Y/Y % Change
RCL Year-over-Year Growth
| 2020 | 2021 | 2022 | 2023 | 2024 | 2025 | 2026 | 2027 | Average | |
|---|---|---|---|---|---|---|---|---|---|
| Revenue Growth (%) | -30.6% | 477.0% | 57.2% | 18.6% | 8.8% | 9.5% | 7.4% | 78.3% | |
| Revenue Analysts (#) | 0 | 0 | 0 | 0 | 0 | 0 | 24 | 24 | |
| EPS Growth (%) | -9.3% | -59.0% | -178.7% | 69.5% | 48.3% | 8.9% | 15.5% | -15.0% | |
| EPS Analysts (#) | 0 | 0 | 0 | 0 | 0 | 0 | 24 | 26 |
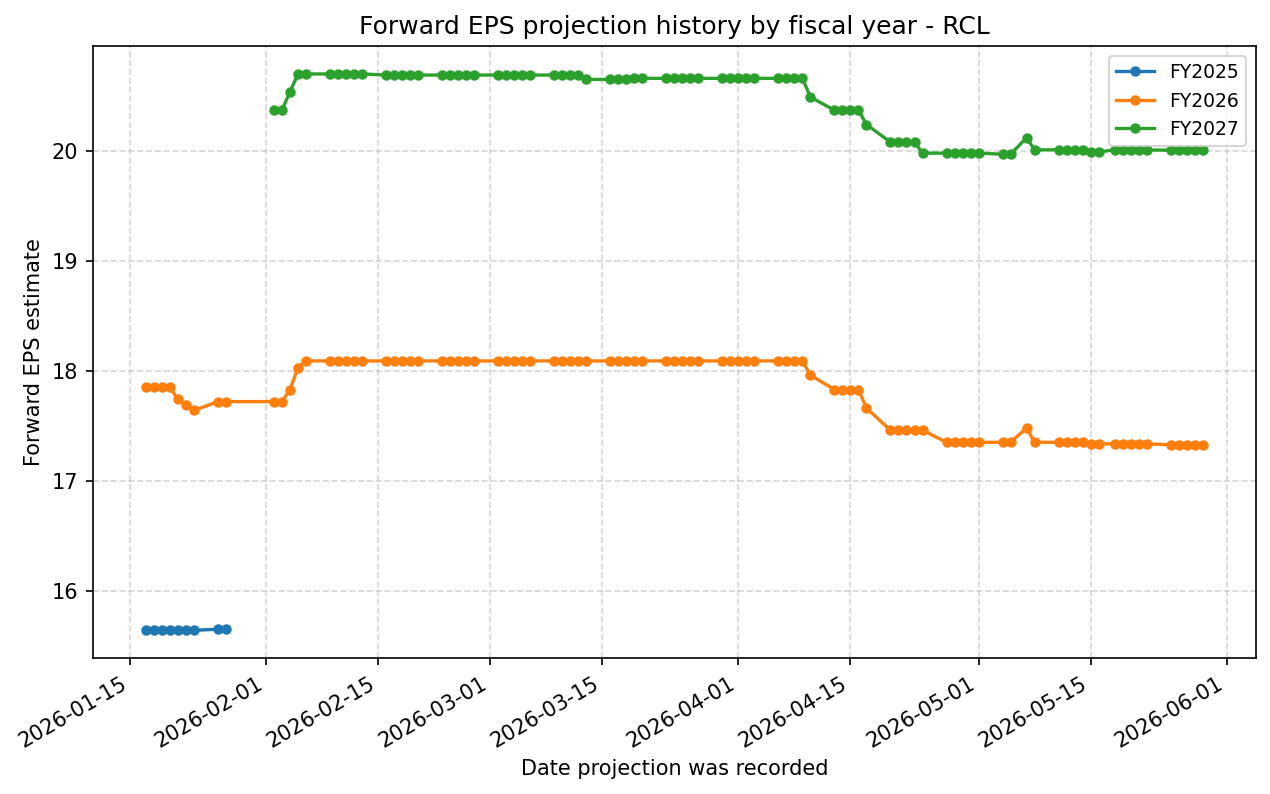
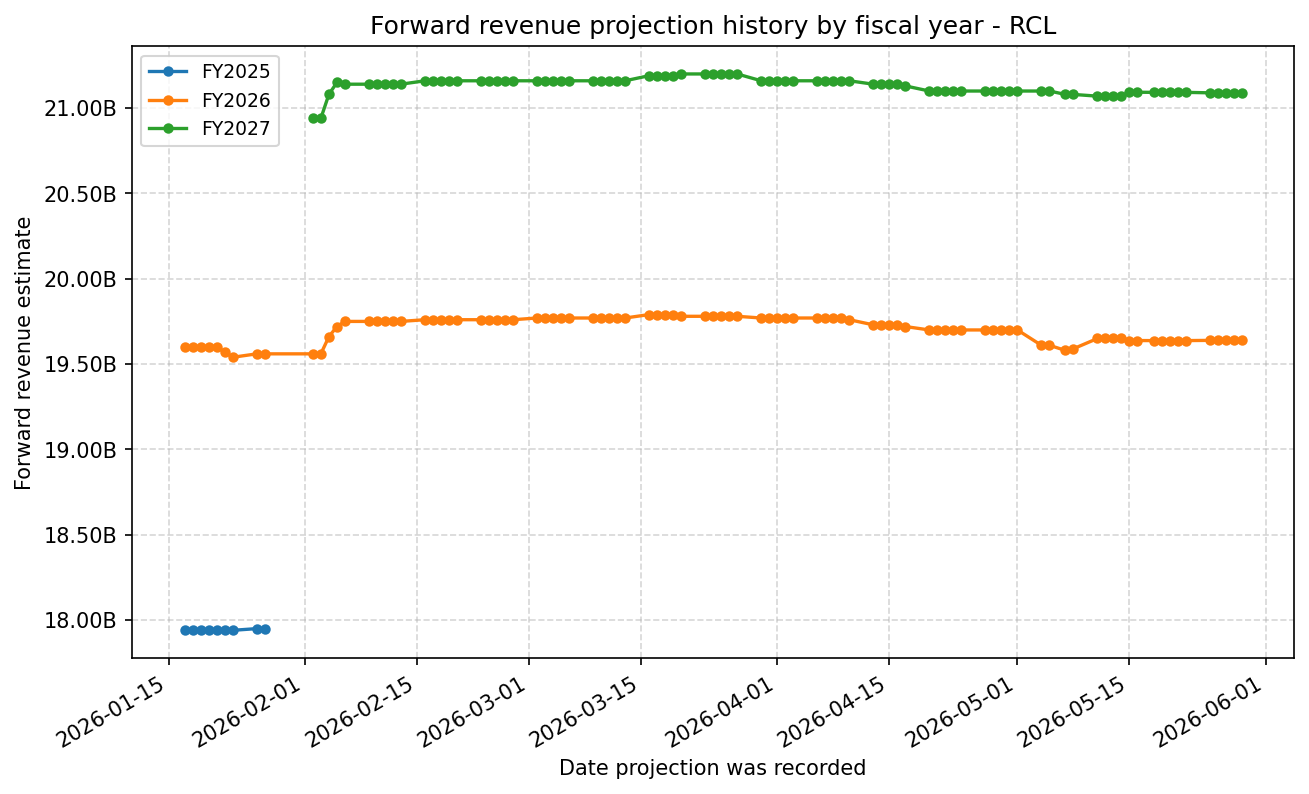
Forward Estimate History
How the next-FY EPS and revenue estimates have drifted over time. One line per fiscal year – past lines end when that FY became current.
Expenses
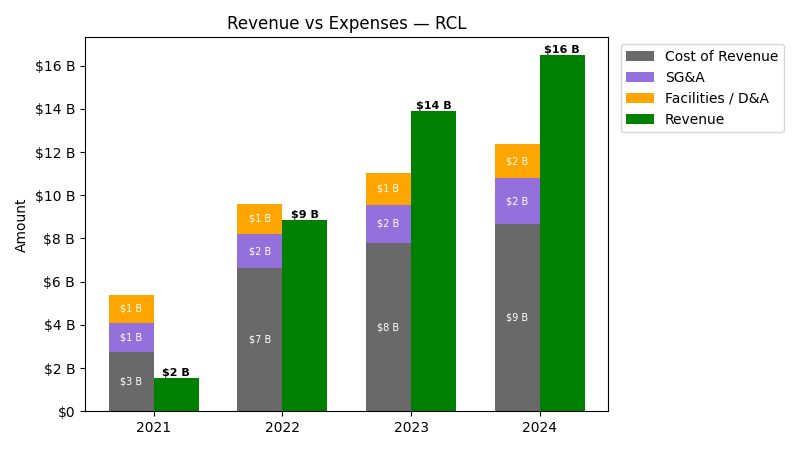
| Year | Revenue ($) | Cost of Revenue ($) | SG&A ($) | Facilities / D&A ($) |
|---|---|---|---|---|
| 2022 | $8.8B | $5.2B | $1.6B | $1.4B |
| 2023 | $13.9B | $6.3B | $1.8B | $1.5B |
| 2024 | $16.5B | $7.1B | $2.1B | $1.6B |
| 2025 | $17.9B | $7.4B | $2.2B | $1.7B |
| TTM | $18.4B | $7.5B | $2.2B | $1.8B |
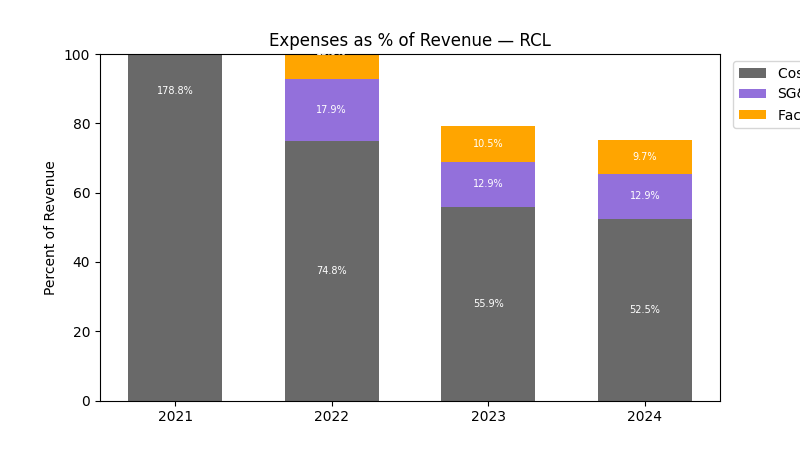
| Year | Revenue Change (%) | Cost of Revenue Change (%) | SG&A Change (%) | Facilities / D&A Change (%) |
|---|---|---|---|---|
| 2023 | 57.24 | 21.33 | 13.20 | 3.41 |
| 2024 | 18.60 | 11.58 | 18.58 | 9.97 |
| 2025 | 8.79 | 4.44 | 4.61 | 7.37 |
| TTM | 2.53 | 1.60 | 0.85 | 2.85 |
No unmapped expenses.
Segment Performance
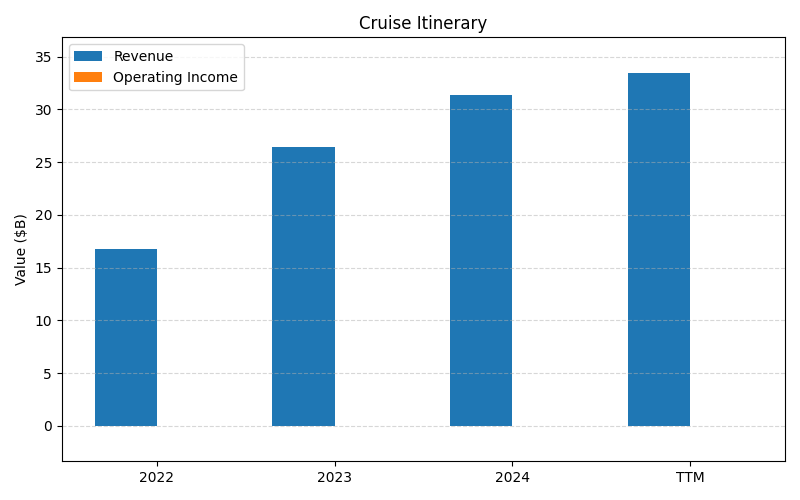
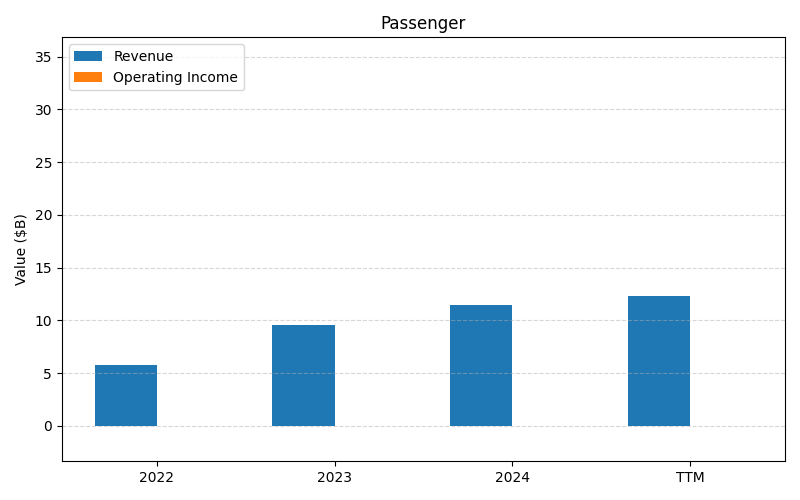
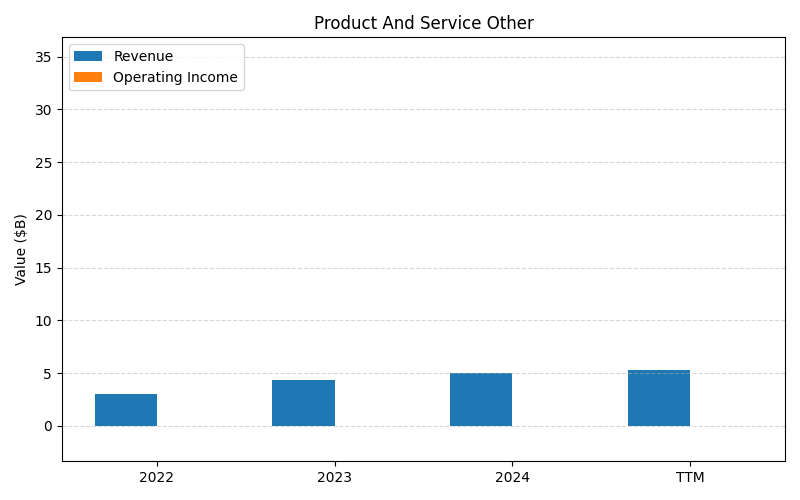
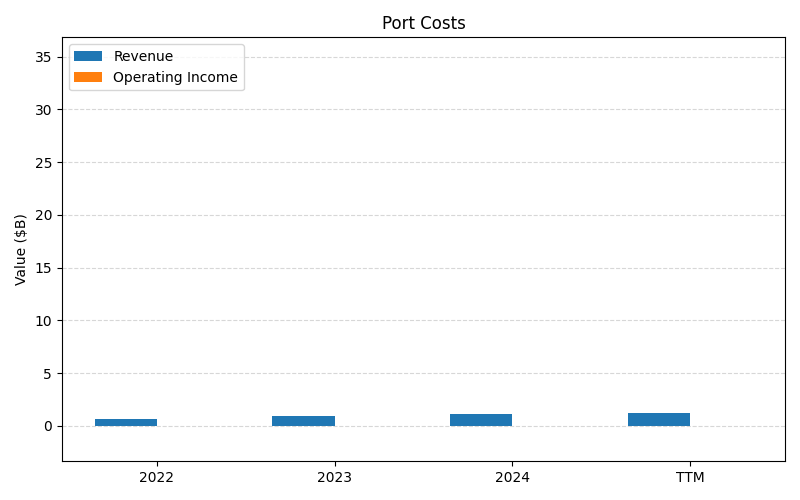
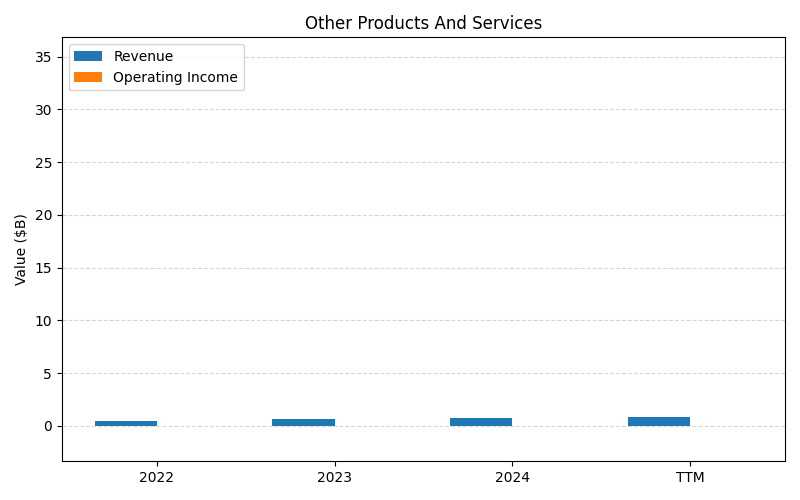
SEGMENTS v2025-09-09 · 2026-05-29 09:14 UTC — Units: $B. Rows list fiscal years (last 3 + TTM) with revenue for each segment; the final row shows the TTM revenue mix (operating income columns display “—” where mix is not applicable).
| Year | Cruise Itinerary Rev | Passenger Rev | Product And Service Other Rev | Port Costs Rev | Other Products And Services Rev | Total Rev |
|---|---|---|---|---|---|---|
| 2023 | 26.5B | 9.57B | 4.33B | 0.90B | 0.67B | 41.9B |
| 2024 | 31.4B | 11.5B | 4.99B | 1.10B | 0.79B | 49.8B |
| 2025 | 34.1B | 12.5B | 5.42B | 1.30B | 0.86B | 54.2B |
| TTM | 81.5B | 29.8B | 13.1B | 3.00B | 2.10B | 129.5B |
| % of Total (TTM) | 63.0% | 23.0% | 10.1% | 2.3% | 1.6% | 100% |
Balance Sheet
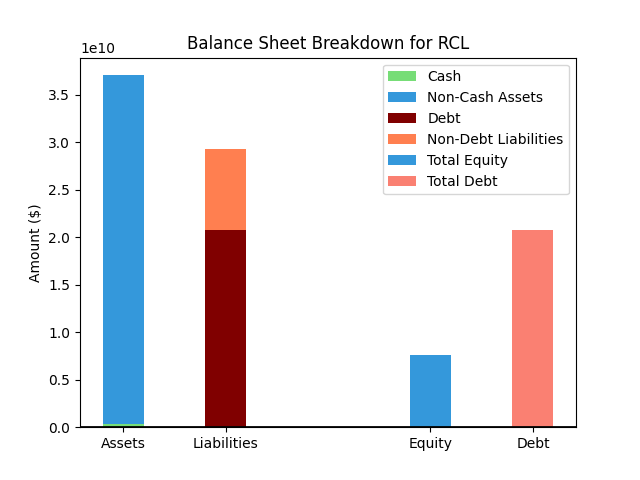
| Metric | Value | |
|---|---|---|
| 0 | Total Assets | $41,990M |
| 1 | Cash | $512M |
| 2 | Total Liabilities | $31,962M |
| 3 | Total Debt | $21,792M |
| 4 | Total Equity | $9,810M |
| 5 | Debt to Equity Ratio | 2.22 |
EPS & Dividend
Valuation
| Share Price | Treasury Yield | Estimates | Fair Value (P/E) | Fair Value (P/S) | Current P/S | Current P/E |
|---|---|---|---|---|---|---|
| $284.63 | 4.5% | Nicks Growth: 10% Nick's Expected Margin: 12% FINVIZ Growth: 13% |
Nicks: 17 Finviz: 24 |
Nick's: 2.059 | 4.2 | 17.4 |
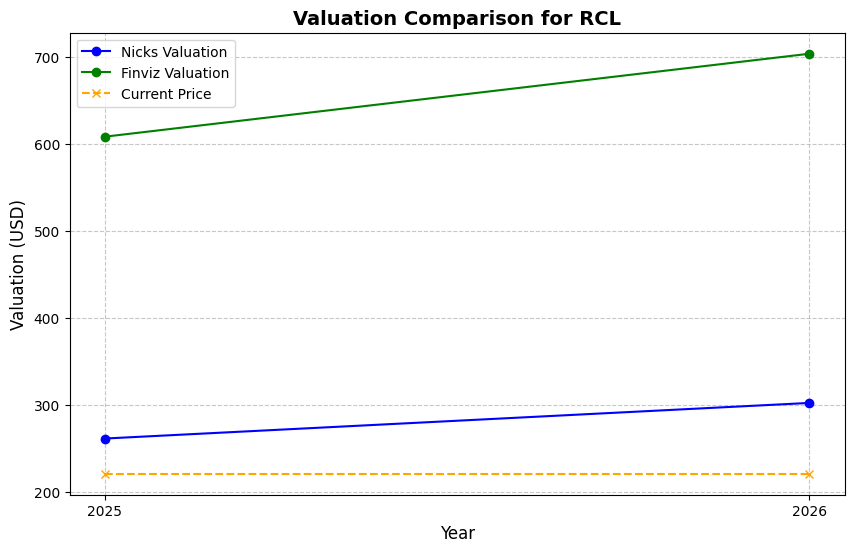
| Basis | Year | Nicks Valuation | Nicks vs Share Price | Finviz Valuation | Finviz vs Share Price |
|---|---|---|---|---|---|
| $16.40 EPS | TTM | $281.39 | -1.1% | $388.85 | 36.6% |
| $17.33 EPS | 2026 | $297.30 | 4.5% | $410.85 | 44.3% |
| $20.01 EPS | 2027 | $343.26 | 20.6% | $474.36 | 66.7% |
Implied Growth
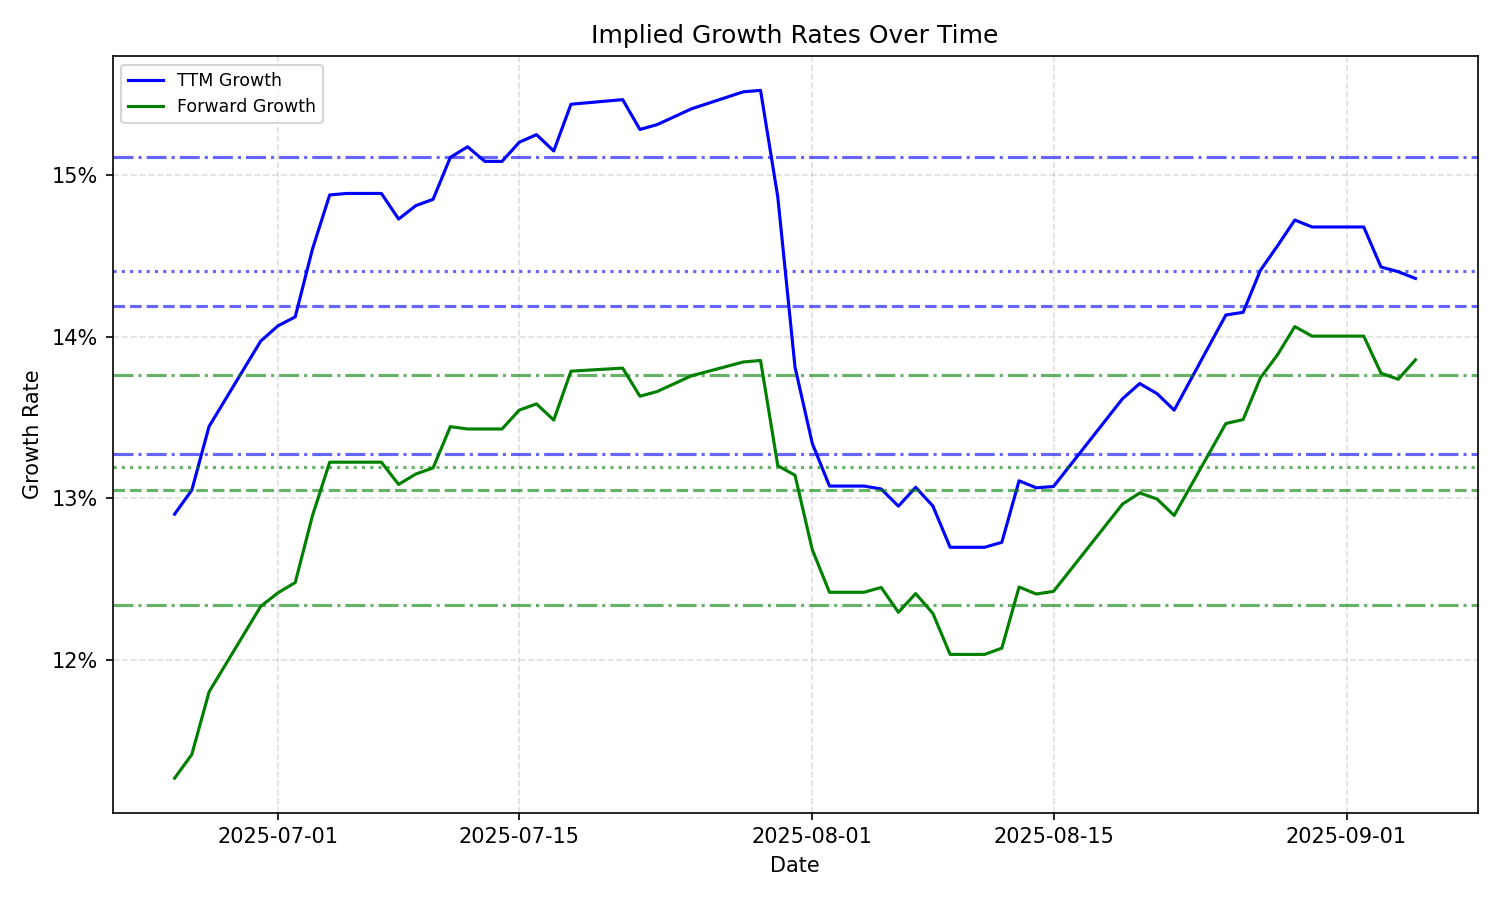
| Average | Median | Std Dev | Current | Percentile | ||||||
|---|---|---|---|---|---|---|---|---|---|---|
| TTM | Forward | TTM | Forward | TTM | Forward | TTM | Forward | TTM | Forward | |
| Timeframe | ||||||||||
| 1 Year | 11.77% | 10.32% | 11.24% | 10.15% | 1.91% | 2.39% | 10.00% | 7.92% | 23.0% | 25.5% |
| 3 Years | 11.77% | 10.32% | 11.24% | 10.15% | 1.91% | 2.39% | 10.00% | 7.92% | 23.0% | 25.5% |
| 5 Years | 11.77% | 10.32% | 11.24% | 10.15% | 1.91% | 2.39% | 10.00% | 7.92% | 23.0% | 25.5% |
| 10 Years | 11.77% | 10.32% | 11.24% | 10.15% | 1.91% | 2.39% | 10.00% | 7.92% | 23.0% | 25.5% |