PayPal Holdings, Inc. — PYPL
| Close Price | Market Cap | P/E Ratio | Forward P/E Ratio | Implied Growth* | Implied Forward Growth* | Dividend | P/B Ratio |
|---|---|---|---|---|---|---|---|
| $44.75 | $39.47B | 8.4 | 7.7 | 2.7% | 1.9% | $0.56 1.3% | 2.0 |
Latest Headlines
- · Cash and Gift Cards Dominate Consumer Reward Preferences: Kashkick Survey of 224,000+ Aligns With $507B U.S. Gift Card Market
- · Payments Stocks in the Stablecoin Era: 3 to Buy and 1 to Avoid
- · Intuit vs. PayPal: Which Fintech Stock Is the Better Buy Now?
- · Tencent rolls out inbound payments upgrades, adds PayPal QR support
- · Paxos Wins SEC Clearing Agency Approval for Blockchain Settlement Business
- · In a tourist-friendly move, China's Tencent to allow PayPal payments through its WeChat networks
Revenue & Net Income
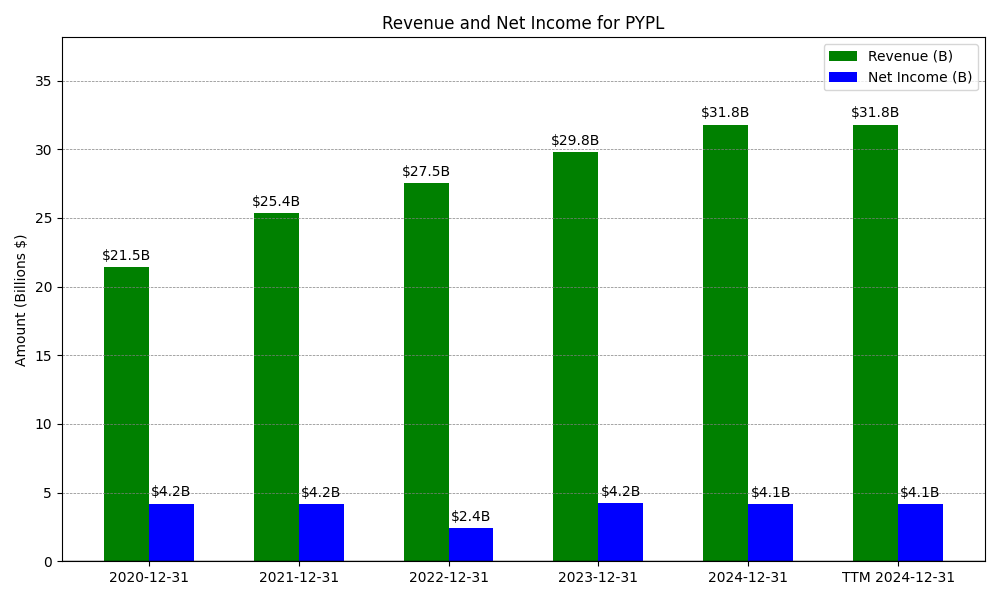
| Date | Revenue | Net_Income | EPS | Last_Updated | Revenue_Change | Net_Income_Change | EPS_Change | |
|---|---|---|---|---|---|---|---|---|
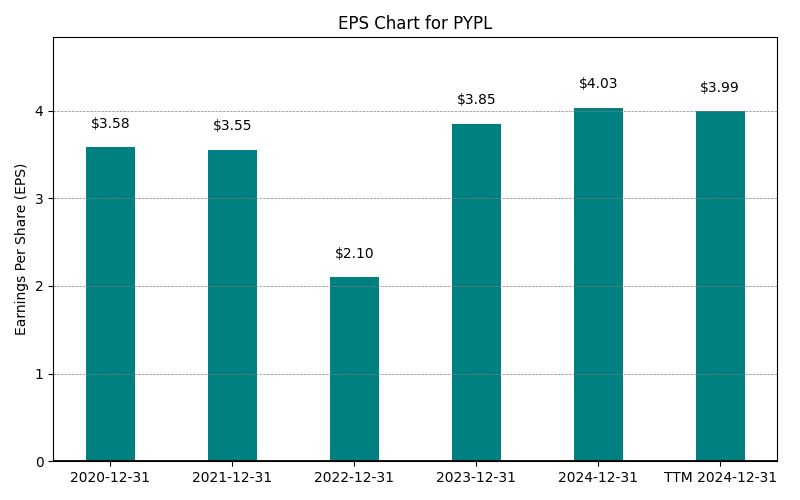
| 0 | 2020-12-31 | $21,454M | $4,202M | $3.58 | 2024-02-03 03:17:10 | N/A | N/A | N/A |
| 1 | 2021-12-31 | $25,371M | $4,169M | $3.55 | 2026-02-06 08:41:12 | 18.3% | -0.8% | -0.8% |
| 2 | 2022-12-31 | $27,518M | $2,419M | $2.10 | 2026-05-29 09:13:51 | 8.5% | -42.0% | -40.8% |
| 3 | 2023-12-31 | $29,771M | $4,246M | $3.85 | 2026-05-29 09:13:51 | 8.2% | 75.5% | 83.3% |
| 4 | 2024-12-31 | $31,797M | $4,147M | $4.03 | 2026-05-29 09:13:51 | 6.8% | -2.3% | 4.7% |
| 5 | 2025-12-31 | $33,172M | $5,233M | $5.46 | 2026-05-29 09:13:51 | 4.3% | 26.2% | 35.5% |
| 6 | TTM 2026-03-31 | $33,734M | $5,059M | $5.33 | 2026-05-11 09:14:32 | 1.7% | -3.3% | -2.4% |
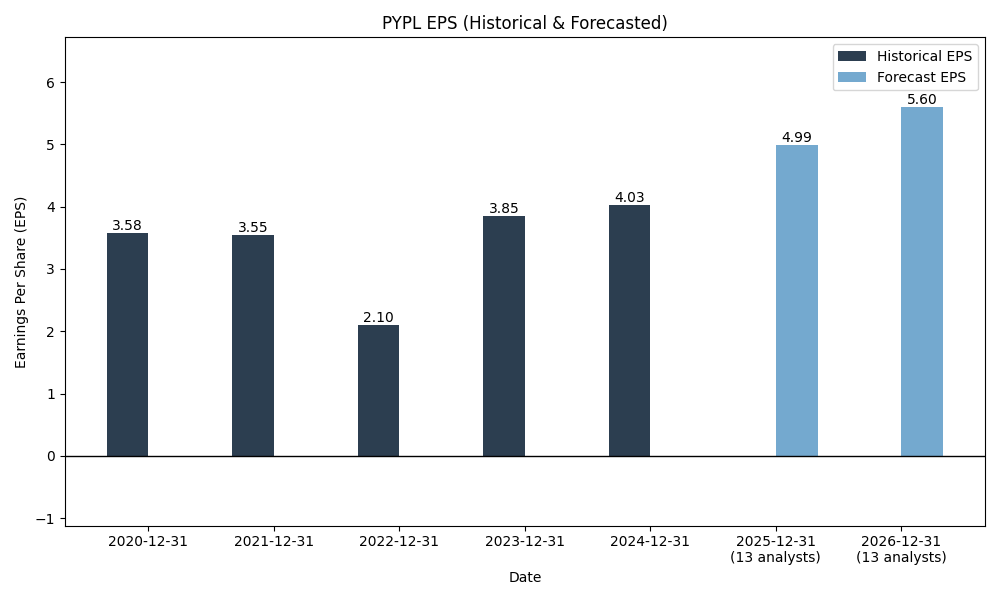
EPS
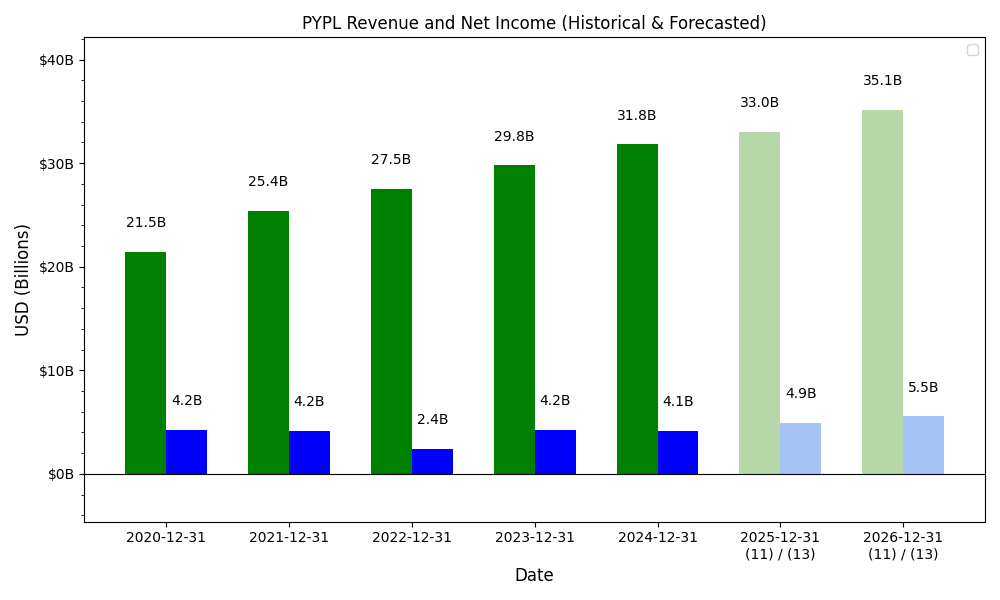
Forecasts
Y/Y % Change
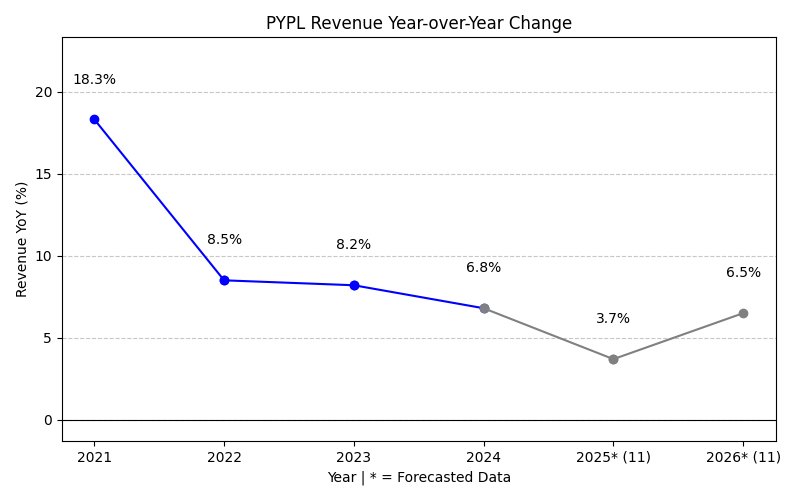
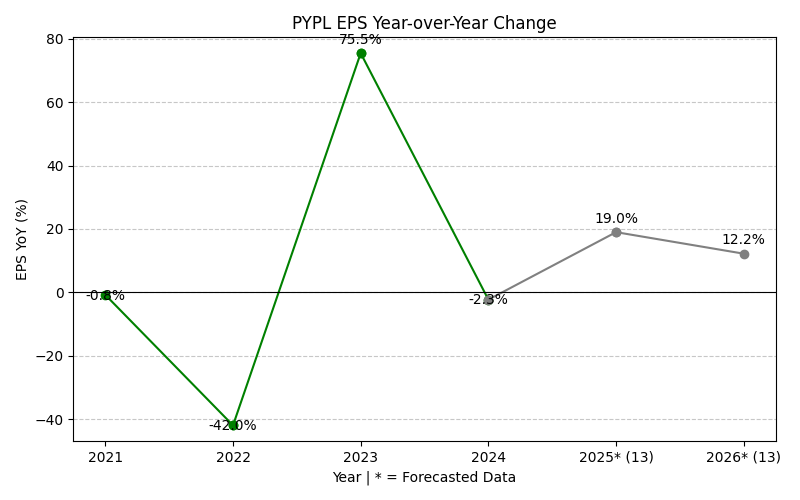
PYPL Year-over-Year Growth
| 2020 | 2021 | 2022 | 2023 | 2024 | 2025 | 2026 | 2027 | Average | |
|---|---|---|---|---|---|---|---|---|---|
| Revenue Growth (%) | 18.3% | 8.5% | 8.2% | 6.8% | 4.3% | 3.5% | 4.3% | 7.7% | |
| Revenue Analysts (#) | 0 | 0 | 0 | 0 | 0 | 0 | 41 | 43 | |
| EPS Growth (%) | -0.8% | -42.0% | 75.5% | -2.3% | 26.2% | -10.6% | 8.9% | 7.8% | |
| EPS Analysts (#) | 0 | 0 | 0 | 0 | 0 | 0 | 42 | 42 |
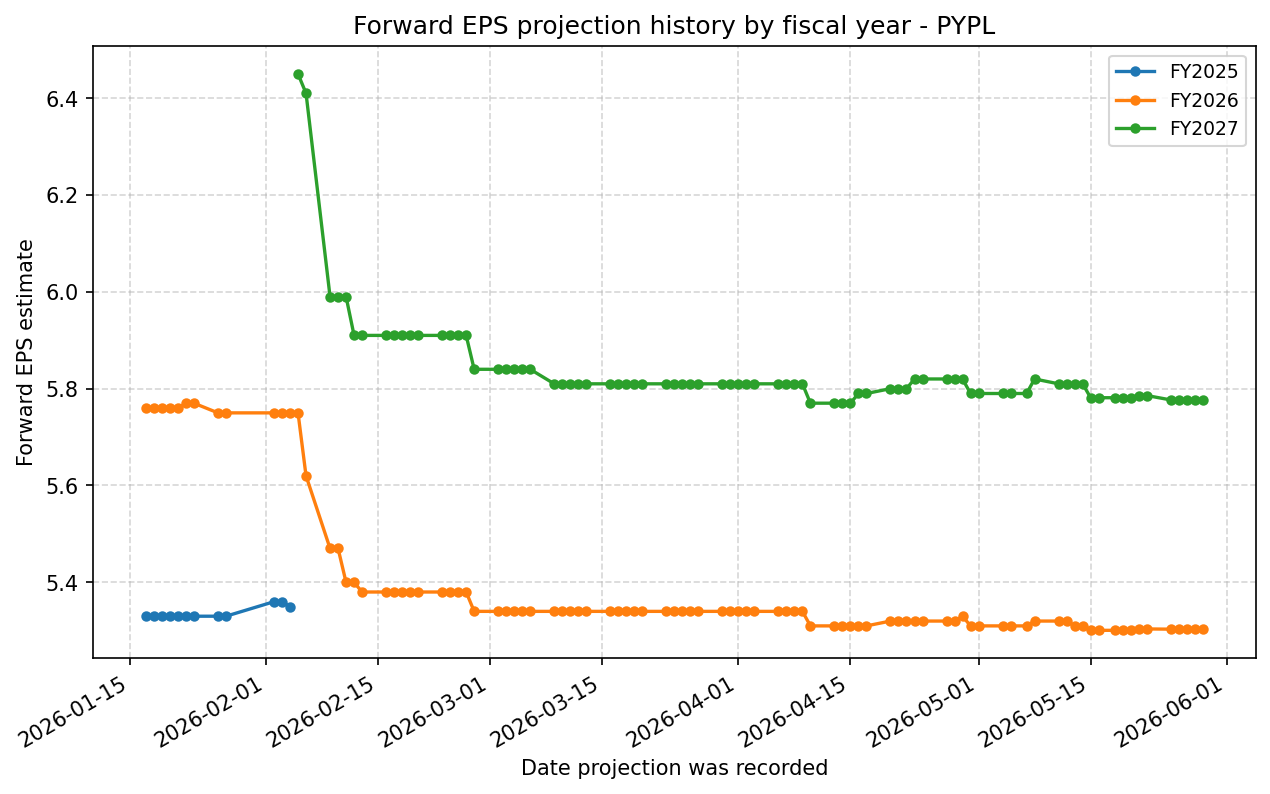
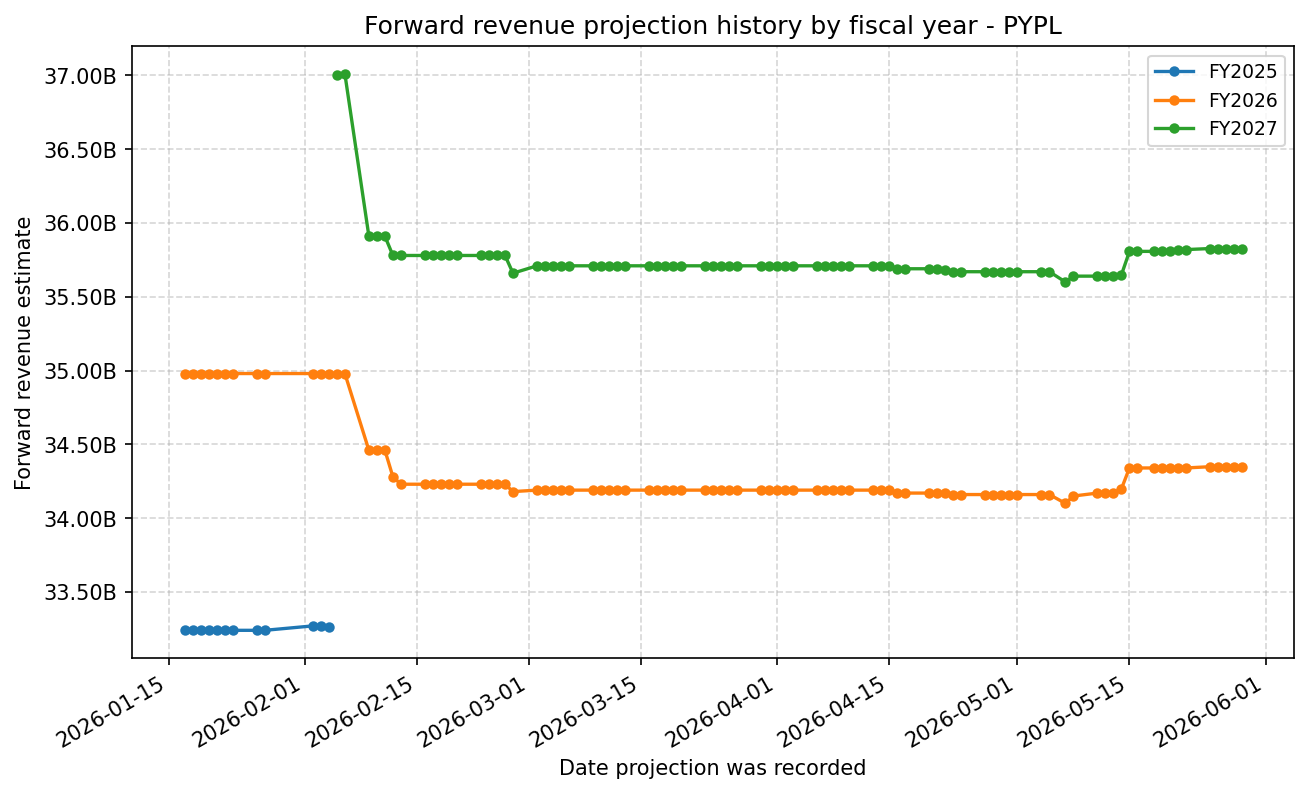
Forward Estimate History
How the next-FY EPS and revenue estimates have drifted over time. One line per fiscal year – past lines end when that FY became current.
Expenses
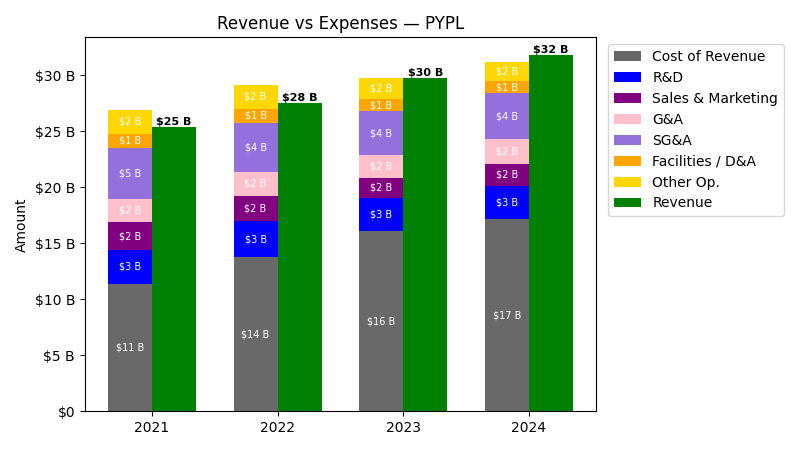
| Year | Revenue ($) | Cost of Revenue ($) | R&D ($) | Sales & Marketing ($) | G&A ($) | SG&A ($) | Facilities / D&A ($) |
|---|---|---|---|---|---|---|---|
| 2021 | $25.4B | $10.1B | $3.0B | $2.4B | $2.1B | $4.6B | $1.3B |
| 2022 | $27.5B | $12.4B | $3.3B | $2.3B | $2.1B | $4.4B | $1.3B |
| 2023 | $29.8B | $15.0B | $3.0B | $1.8B | $2.1B | $3.9B | $1.1B |
| 2024 | $31.8B | $16.1B | $3.0B | $2.0B | $2.1B | $4.1B | $1.0B |
| 2025 | $33.2B | $16.7B | $3.1B | $2.3B | $2.0B | $4.3B | $963.0M |
| TTM | $33.7B | $17.2B | $3.2B | $2.3B | $2.0B | $4.3B | $956.0M |
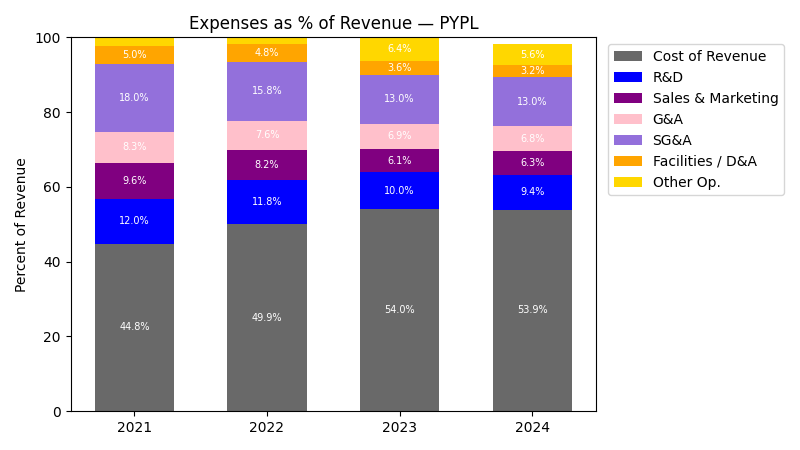
| Year | Revenue Change (%) | Cost of Revenue Change (%) | R&D Change (%) | Sales & Marketing Change (%) | G&A Change (%) | SG&A Change (%) | Facilities / D&A Change (%) |
|---|---|---|---|---|---|---|---|
| 2022 | 8.46 | 22.93 | 7.08 | -7.69 | -0.71 | -4.45 | 4.11 |
| 2023 | 8.19 | 20.65 | -8.61 | -19.85 | -1.91 | -11.20 | -18.60 |
| 2024 | 6.81 | 7.42 | 0.20 | 10.61 | 4.27 | 7.24 | -3.73 |
| 2025 | 4.32 | 3.95 | 4.16 | 14.09 | -7.82 | 2.75 | -6.69 |
| TTM | 1.69 | 2.84 | 2.00 | 1.31 | -0.61 | 0.42 | -0.73 |
No unmapped expenses.
Segment Performance
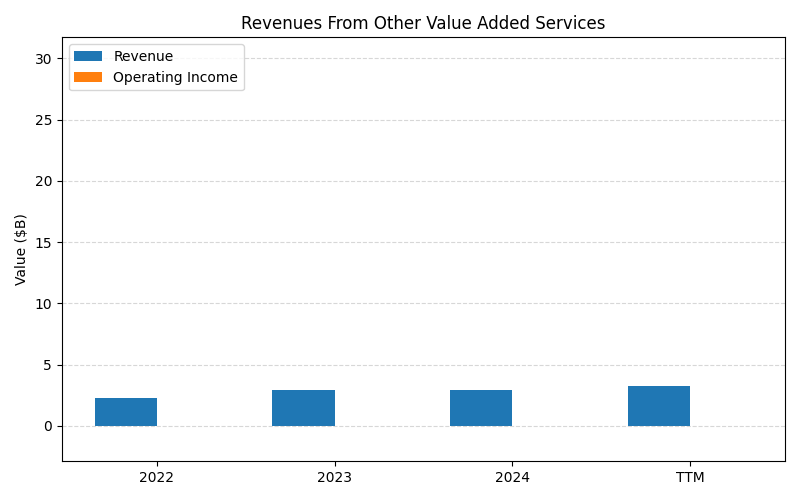
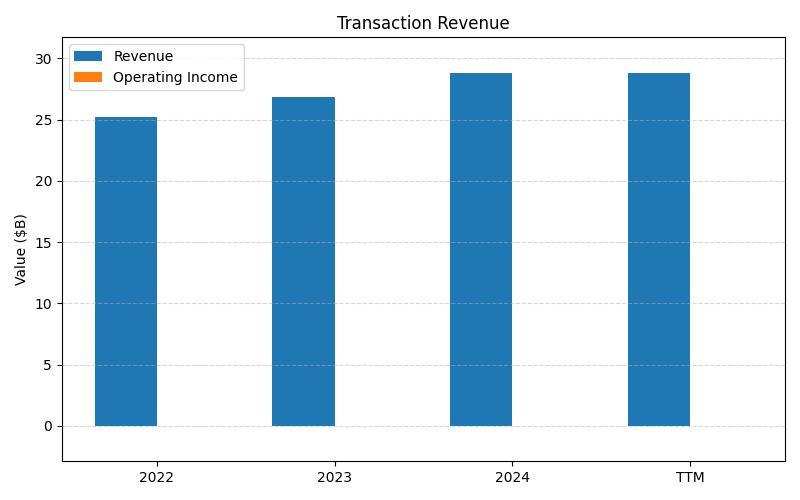
SEGMENTS v2025-09-09 · 2026-05-29 09:13 UTC — Units: $B. Rows list fiscal years (last 3 + TTM) with revenue for each segment; the final row shows the TTM revenue mix (operating income columns display “—” where mix is not applicable).
| Year | Revenues From Other Value Added Services Rev | Transaction Revenue Rev | Total Rev |
|---|---|---|---|
| 2023 | 2.91B | 26.9B | 29.8B |
| 2024 | 2.96B | 28.8B | 31.8B |
| 2025 | 3.37B | 29.8B | 33.2B |
| TTM | 7.96B | – | 7.96B |
| % of Total (TTM) | 100.0% | – | 100% |
Balance Sheet
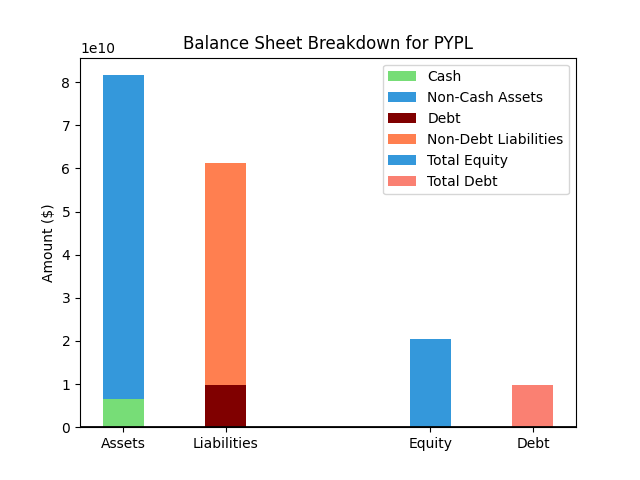
| Metric | Value | |
|---|---|---|
| 0 | Total Assets | $80,546M |
| 1 | Cash | $6,977M |
| 2 | Total Liabilities | $60,522M |
| 3 | Total Debt | $9,409M |
| 4 | Total Equity | $20,024M |
| 5 | Debt to Equity Ratio | 0.47 |
EPS & Dividend

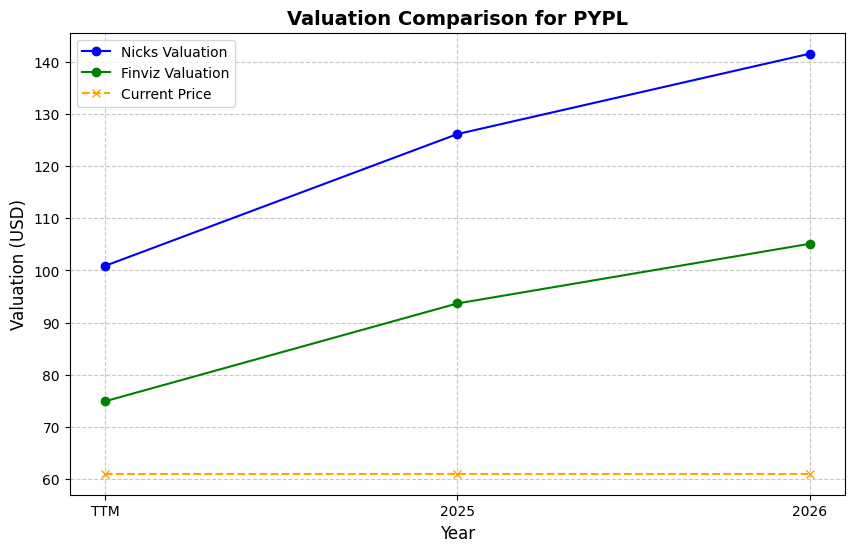
Valuation
| Share Price | Treasury Yield | Estimates | Fair Value (P/E) | Fair Value (P/S) | Current P/S | Current P/E |
|---|---|---|---|---|---|---|
| $44.75 | 4.5% | Nicks Growth: 14% Nick's Expected Margin: 14% FINVIZ Growth: 6% |
Nicks: 25 Finviz: 12 |
Nick's: 3.484 | 1.2 | 8.4 |
| Basis | Year | Nicks Valuation | Nicks vs Share Price | Finviz Valuation | Finviz vs Share Price |
|---|---|---|---|---|---|
| $5.33 EPS | TTM | $132.66 | 196.4% | $61.96 | 38.5% |
| $5.30 EPS | 2026 | $131.99 | 195.0% | $61.65 | 37.8% |
| $5.78 EPS | 2027 | $143.78 | 221.3% | $67.15 | 50.1% |
Implied Growth
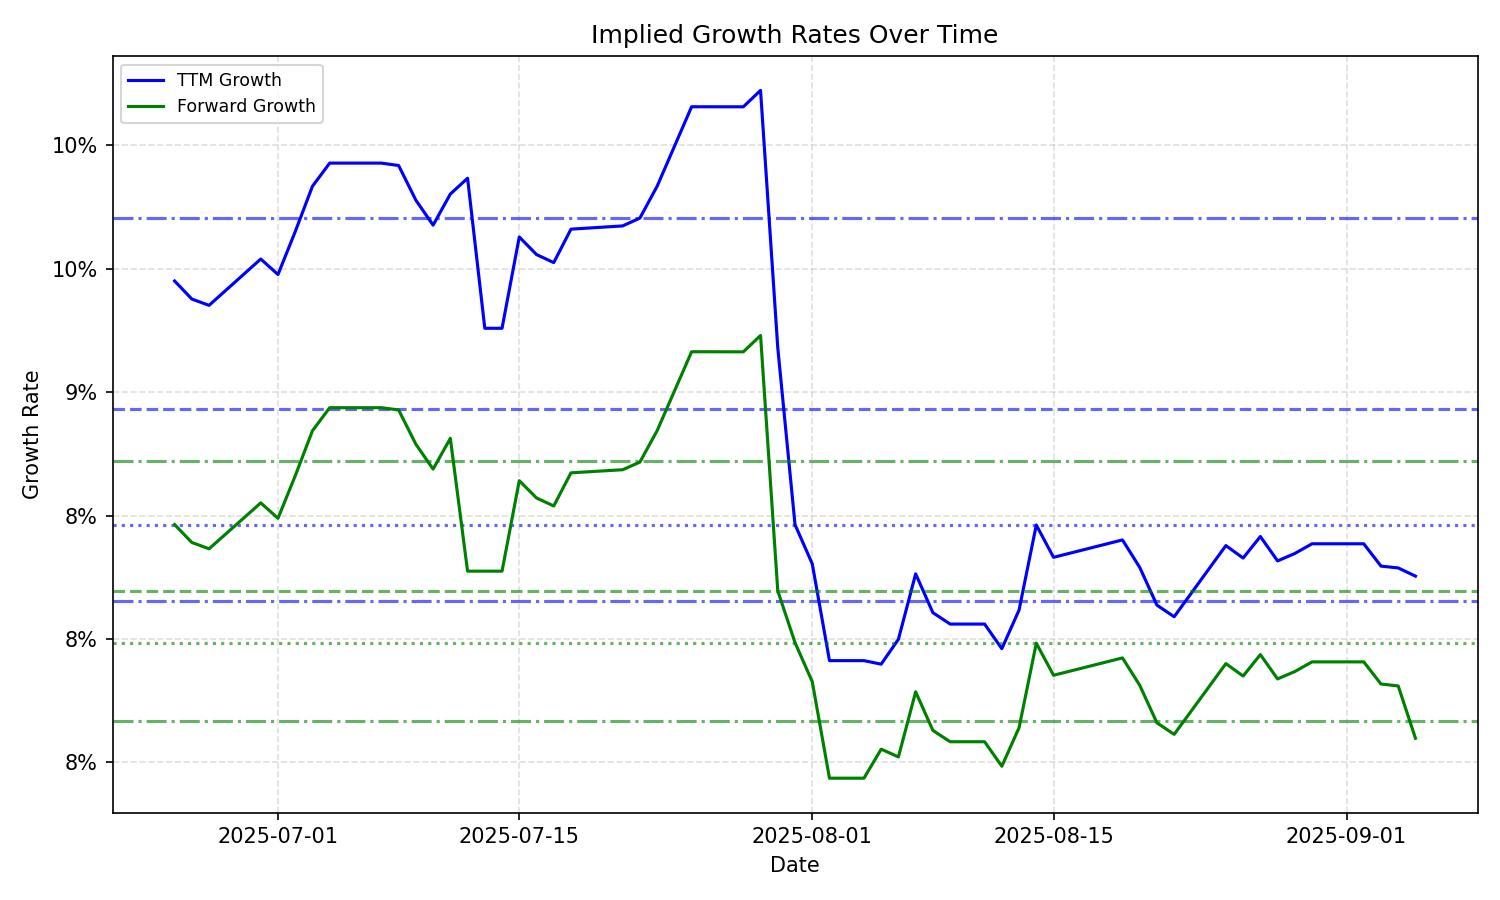
| Average | Median | Std Dev | Current | Percentile | ||||||
|---|---|---|---|---|---|---|---|---|---|---|
| TTM | Forward | TTM | Forward | TTM | Forward | TTM | Forward | TTM | Forward | |
| Timeframe | ||||||||||
| 1 Year | 5.95% | 5.29% | 6.22% | 6.38% | 2.66% | 2.75% | 2.66% | 1.87% | 19.0% | 14.9% |
| 3 Years | 5.95% | 5.29% | 6.22% | 6.38% | 2.66% | 2.75% | 2.66% | 1.87% | 19.0% | 14.9% |
| 5 Years | 5.95% | 5.29% | 6.22% | 6.38% | 2.66% | 2.75% | 2.66% | 1.87% | 19.0% | 14.9% |
| 10 Years | 5.95% | 5.29% | 6.22% | 6.38% | 2.66% | 2.75% | 2.66% | 1.87% | 19.0% | 14.9% |