Palantir Technologies Inc. — PLTR
| Close Price | Market Cap | P/E Ratio | Forward P/E Ratio | Implied Growth* | Implied Forward Growth* | Dividend | P/B Ratio |
|---|---|---|---|---|---|---|---|
| $156.54 | $375.28B | 175.9 | 75.5 | 37.7% | 26.9% | - | 44.4 |
Latest Headlines
- · Dell, Rocket Lab, Palantir, and More Stocks That Explain the Market Today
- · Palantir Stock Is Having Its Best Day in a Year. Software Looks Like a Buy Again.
- · High Growth Tech Stocks in US for May 2026
- · Stocks Supported by Middle East Peace Hopes and AI Spending
- · Palantir Soars 10% as Dell Earnings Beat Validates Their AI Factory Partnership, Snowflake Lifts Software Rally
- · Does Palantir Technologies (PLTR) Have the Potential to Rally 35.91% as Wall Street Analysts Expect?
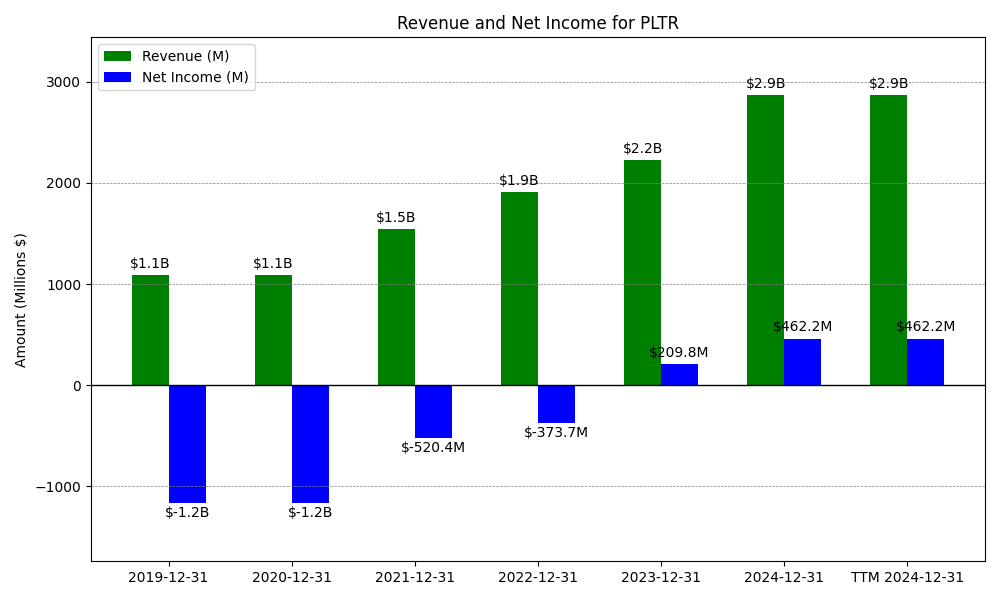
Revenue & Net Income
| Date | Revenue | Net_Income | EPS | Last_Updated | Revenue_Change | Net_Income_Change | EPS_Change | |
|---|---|---|---|---|---|---|---|---|
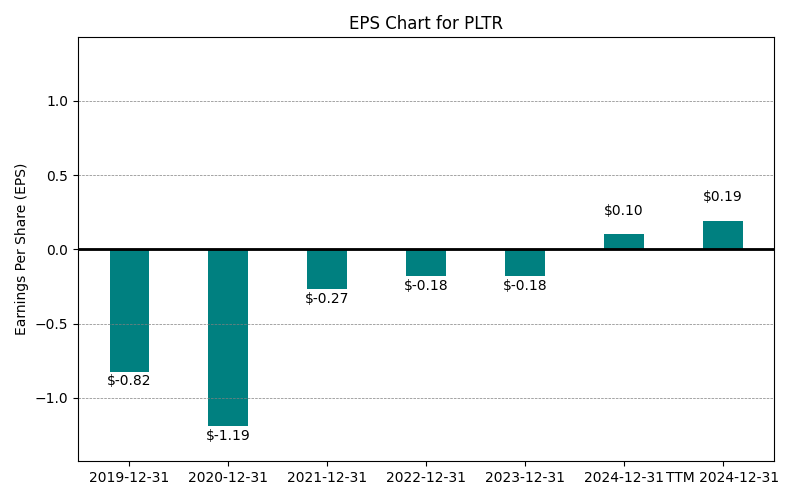
| 0 | 2019-12-31 | $1,093M | $-1,166M | $-0.82 | 2024-05-25 13:12:00 | N/A | N/A | N/A |
| 1 | 2020-12-31 | $1,093M | $-1,166M | $-1.19 | 2024-02-03 03:17:10 | 0.0% | 0.0% | 44.4% |
| 2 | 2021-12-31 | $1,542M | $-520M | $-0.27 | 2026-02-27 08:41:22 | 41.1% | -55.4% | -77.3% |
| 3 | 2022-12-31 | $1,906M | $-374M | $-0.18 | 2026-05-29 09:13:46 | 23.6% | -28.2% | -33.3% |
| 4 | 2023-12-31 | $2,225M | $210M | $0.10 | 2026-05-29 09:13:46 | 16.7% | -156.1% | -155.6% |
| 5 | 2024-12-31 | $2,866M | $462M | $0.21 | 2026-05-29 09:13:46 | 28.8% | 120.3% | 110.0% |
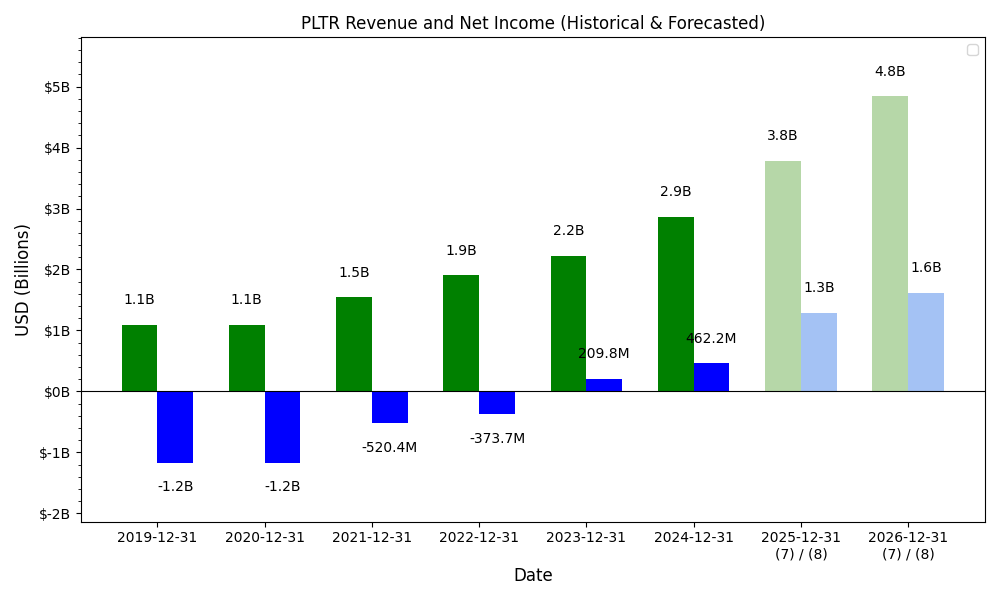
| 6 | 2025-12-31 | $4,475M | $1,625M | $0.69 | 2026-05-29 09:13:46 | 56.2% | 251.6% | 228.1% |
| 7 | TTM 2026-03-31 | $5,224M | $2,282M | $0.89 | 2026-05-11 09:14:26 | 16.7% | 40.4% | 29.0% |
EPS
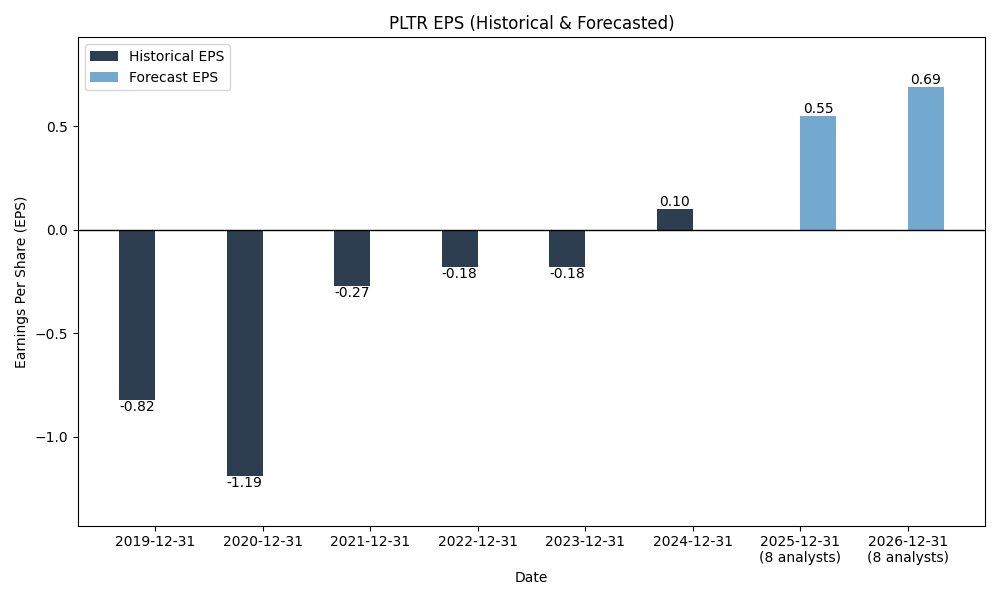
Forecasts
Y/Y % Change
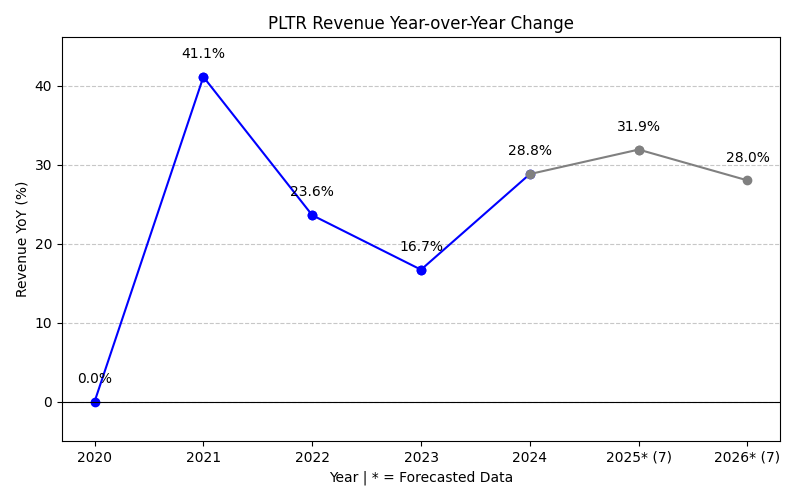
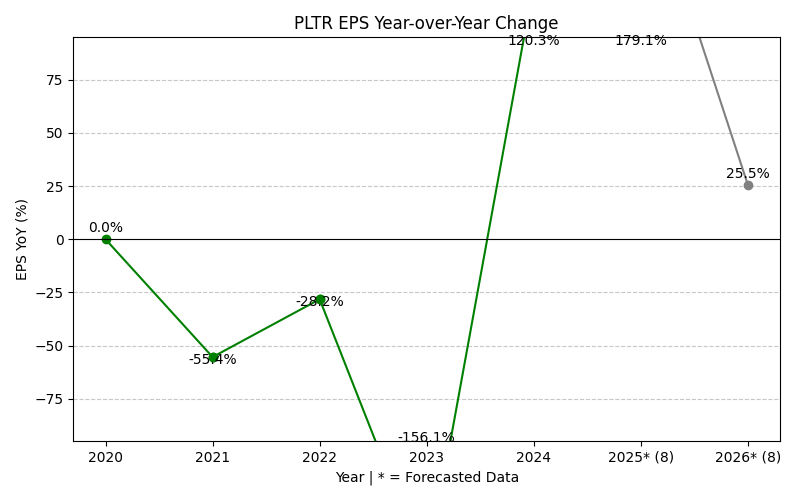
PLTR Year-over-Year Growth
| 2019 | 2020 | 2021 | 2022 | 2023 | 2024 | 2025 | 2026 | 2027 | Average | |
|---|---|---|---|---|---|---|---|---|---|---|
| Revenue Growth (%) | 0.0% | 41.1% | 23.6% | 16.7% | 28.8% | 56.2% | 72.5% | 44.7% | 35.5% | |
| Revenue Analysts (#) | 0 | 0 | 0 | 0 | 0 | 0 | 0 | 28 | 30 | |
| EPS Growth (%) | 0.0% | -55.4% | -28.2% | -156.1% | 120.3% | 251.6% | 115.9% | 41.7% | 36.2% | |
| EPS Analysts (#) | 0 | 0 | 0 | 0 | 0 | 0 | 0 | 28 | 28 |
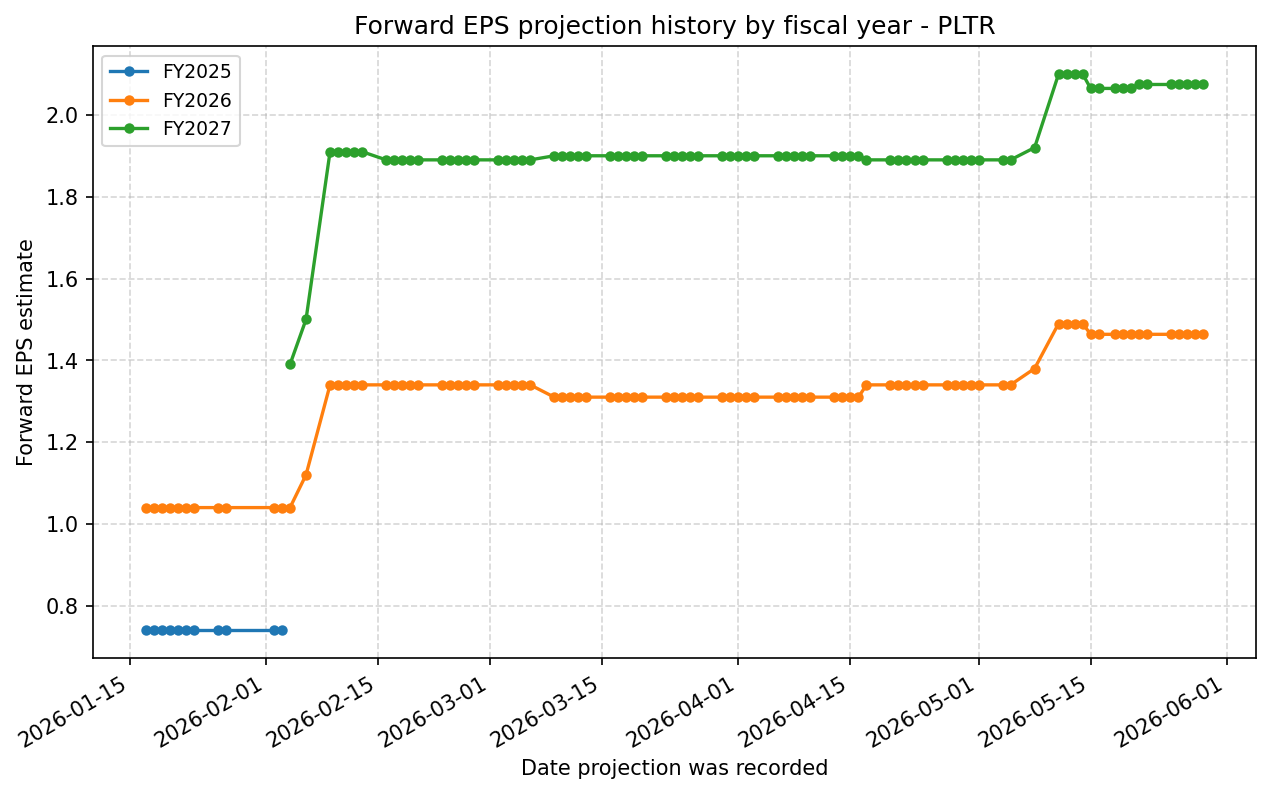
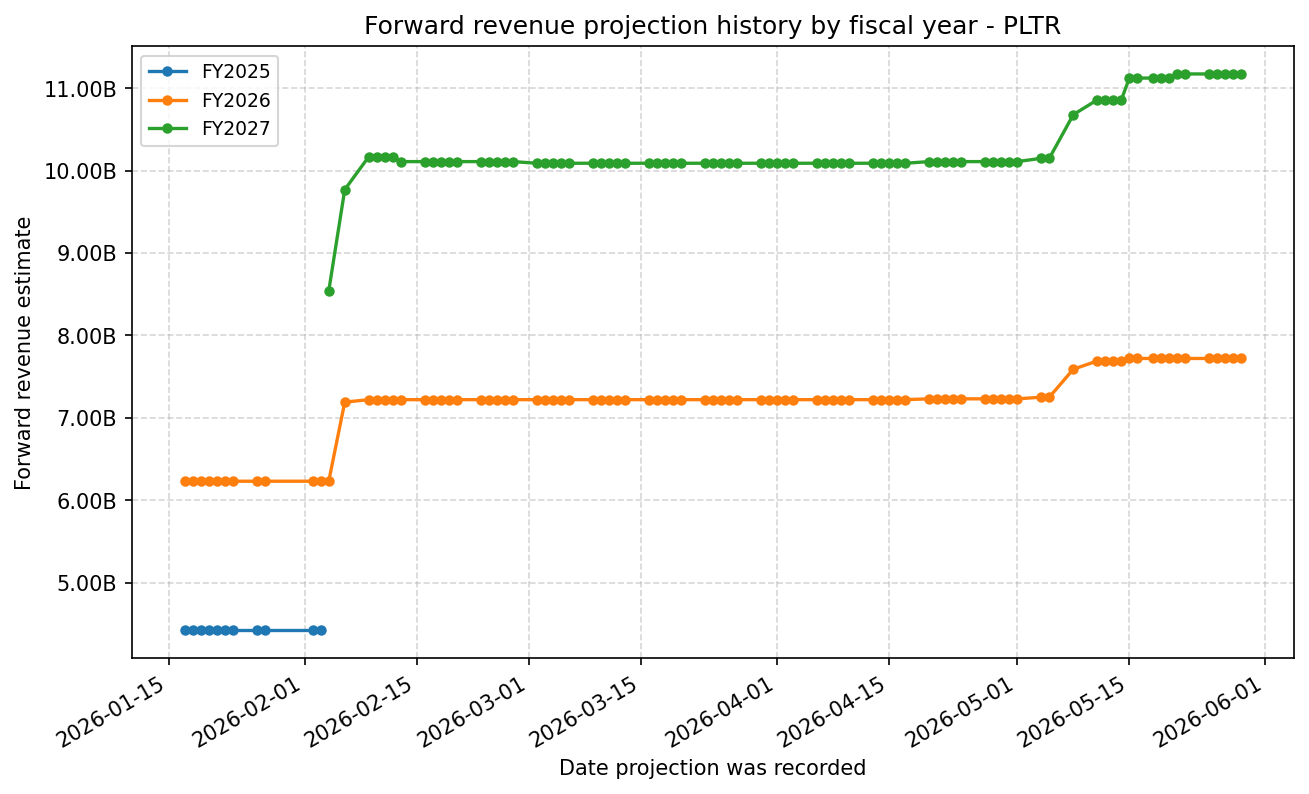
Forward Estimate History
How the next-FY EPS and revenue estimates have drifted over time. One line per fiscal year – past lines end when that FY became current.
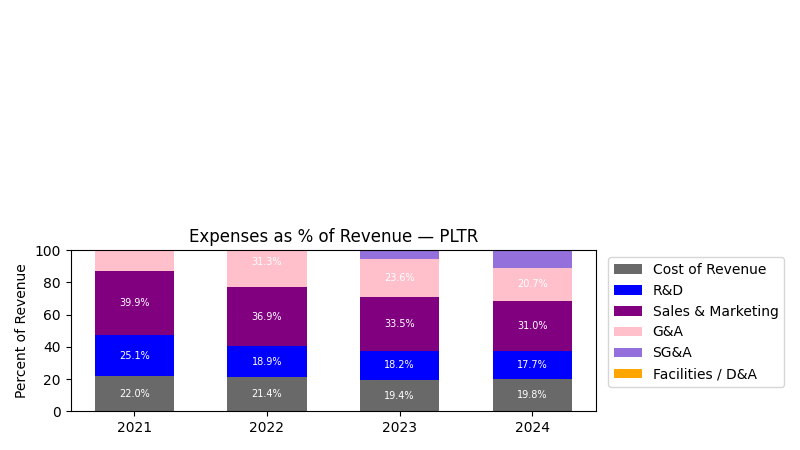
Expenses
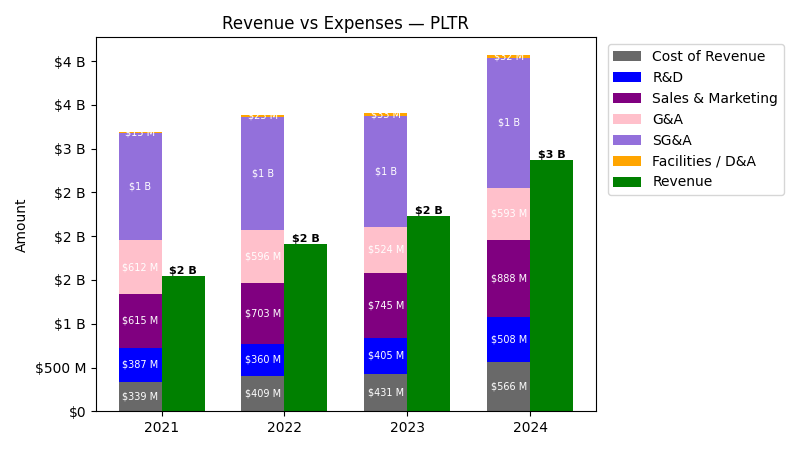
| Year | Revenue ($) | Cost of Revenue ($) | R&D ($) | Sales & Marketing ($) | G&A ($) | SG&A ($) | Facilities / D&A ($) |
|---|---|---|---|---|---|---|---|
| 2022 | $1.9B | $386.0M | $359.7M | $702.5M | $596.3M | $1.3B | $22.5M |
| 2023 | $2.2B | $397.8M | $404.6M | $745.0M | $524.3M | $1.3B | $33.4M |
| 2024 | $2.9B | $534.4M | $507.9M | $887.8M | $593.5M | $1.5B | $31.6M |
| 2025 | $4.5B | $763.0M | $557.7M | $1.1B | $657.7M | $1.7B | $26.1M |
| TTM | $5.2B | $805.7M | $583.8M | $1.1B | $676.7M | $1.8B | $26.3M |
| Year | Revenue Change (%) | Cost of Revenue Change (%) | R&D Change (%) | Sales & Marketing Change (%) | G&A Change (%) | SG&A Change (%) | Facilities / D&A Change (%) |
|---|---|---|---|---|---|---|---|
| 2023 | 16.75 | 3.04 | 12.50 | 6.05 | -12.08 | -2.27 | 48.10 |
| 2024 | 28.79 | 34.36 | 25.52 | 19.16 | 13.19 | 16.70 | -5.30 |
| 2025 | 56.18 | 42.78 | 9.81 | 19.05 | 10.82 | 15.75 | -17.23 |
| TTM | 16.73 | 5.59 | 4.68 | 7.85 | 2.88 | 5.94 | 0.55 |
No unmapped expenses.
Segment Performance
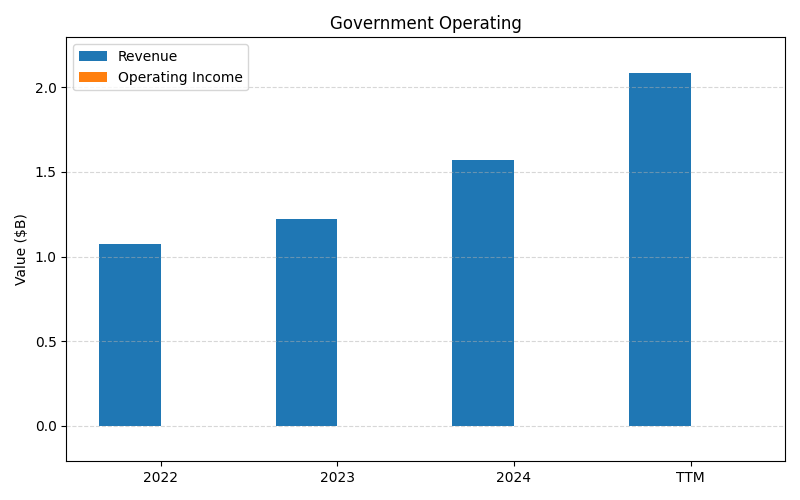
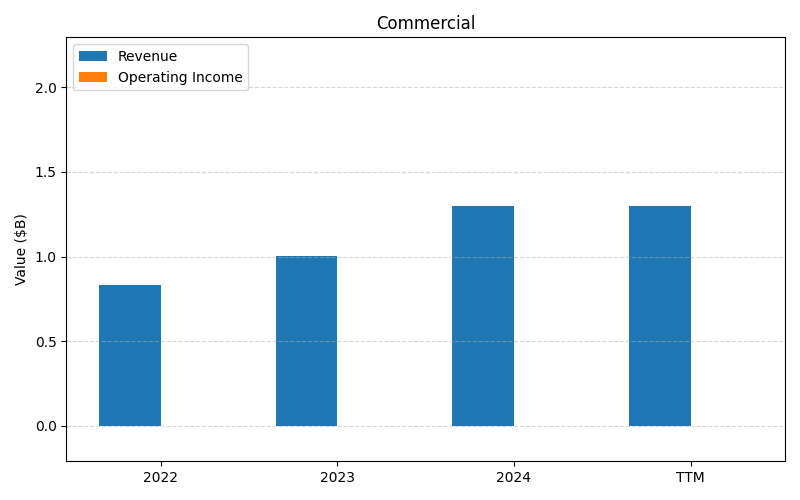
SEGMENTS v2025-09-09 · 2026-05-29 09:13 UTC — Units: $B. Rows list fiscal years (last 3 + TTM) with revenue for each segment; the final row shows the TTM revenue mix (operating income columns display “—” where mix is not applicable).
| Year | Government Operating Rev | Commercial Rev | Total Rev |
|---|---|---|---|
| 2023 | 1.22B | 1.00B | 2.23B |
| 2024 | 1.57B | 1.30B | 2.87B |
| 2025 | 2.40B | 2.07B | 4.48B |
| TTM | 5.32B | – | 5.32B |
| % of Total (TTM) | 100.0% | – | 100% |
Balance Sheet
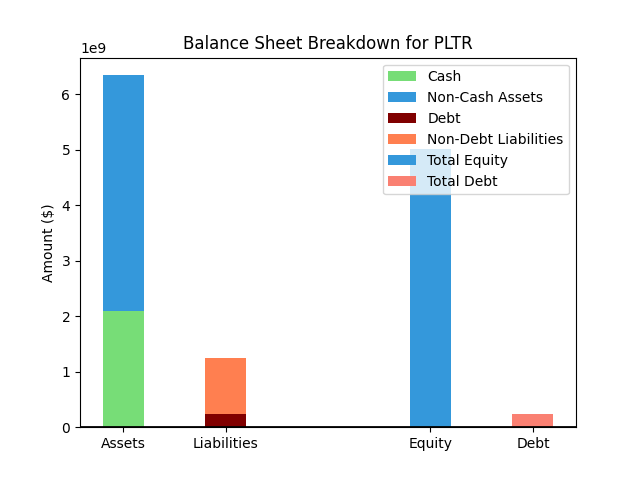
| Metric | Value | |
|---|---|---|
| 0 | Total Assets | $10,199M |
| 1 | Cash | $2,292M |
| 2 | Total Liabilities | $1,643M |
| 3 | Total Debt | $212M |
| 4 | Total Equity | $8,450M |
| 5 | Debt to Equity Ratio | 0.03 |
EPS & Dividend

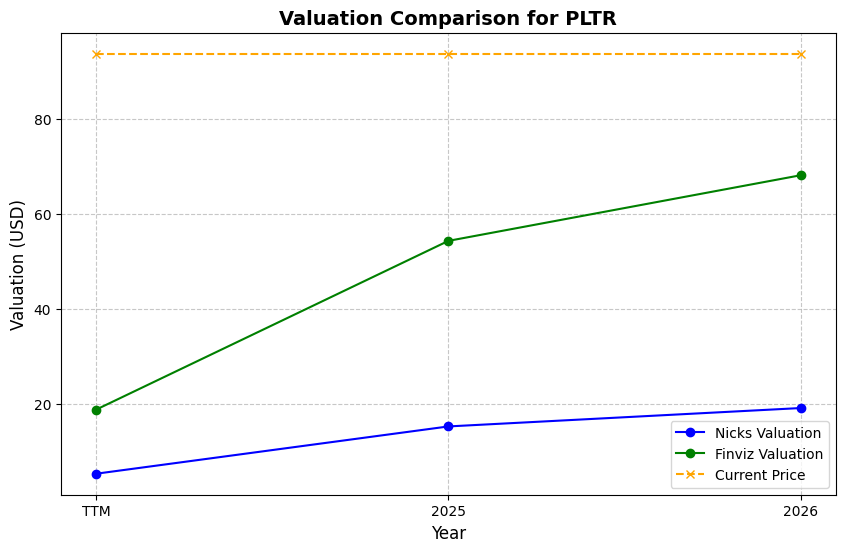
Valuation
| Share Price | Treasury Yield | Estimates | Fair Value (P/E) | Fair Value (P/S) | Current P/S | Current P/E |
|---|---|---|---|---|---|---|
| $156.54 | 4.5% | Nicks Growth: 15% Nick's Expected Margin: 10% FINVIZ Growth: 60% |
Nicks: 27 Finviz: 816 |
Nick's: 2.726 | 71.8 | 175.9 |
| Basis | Year | Nicks Valuation | Nicks vs Share Price | Finviz Valuation | Finviz vs Share Price |
|---|---|---|---|---|---|
| $0.89 EPS | TTM | $24.26 | -84.5% | $726.14 | 363.9% |
| $1.46 EPS | 2026 | $39.89 | -74.5% | $1194.12 | 662.8% |
| $2.07 EPS | 2027 | $56.54 | -63.9% | $1692.38 | 981.1% |
Implied Growth
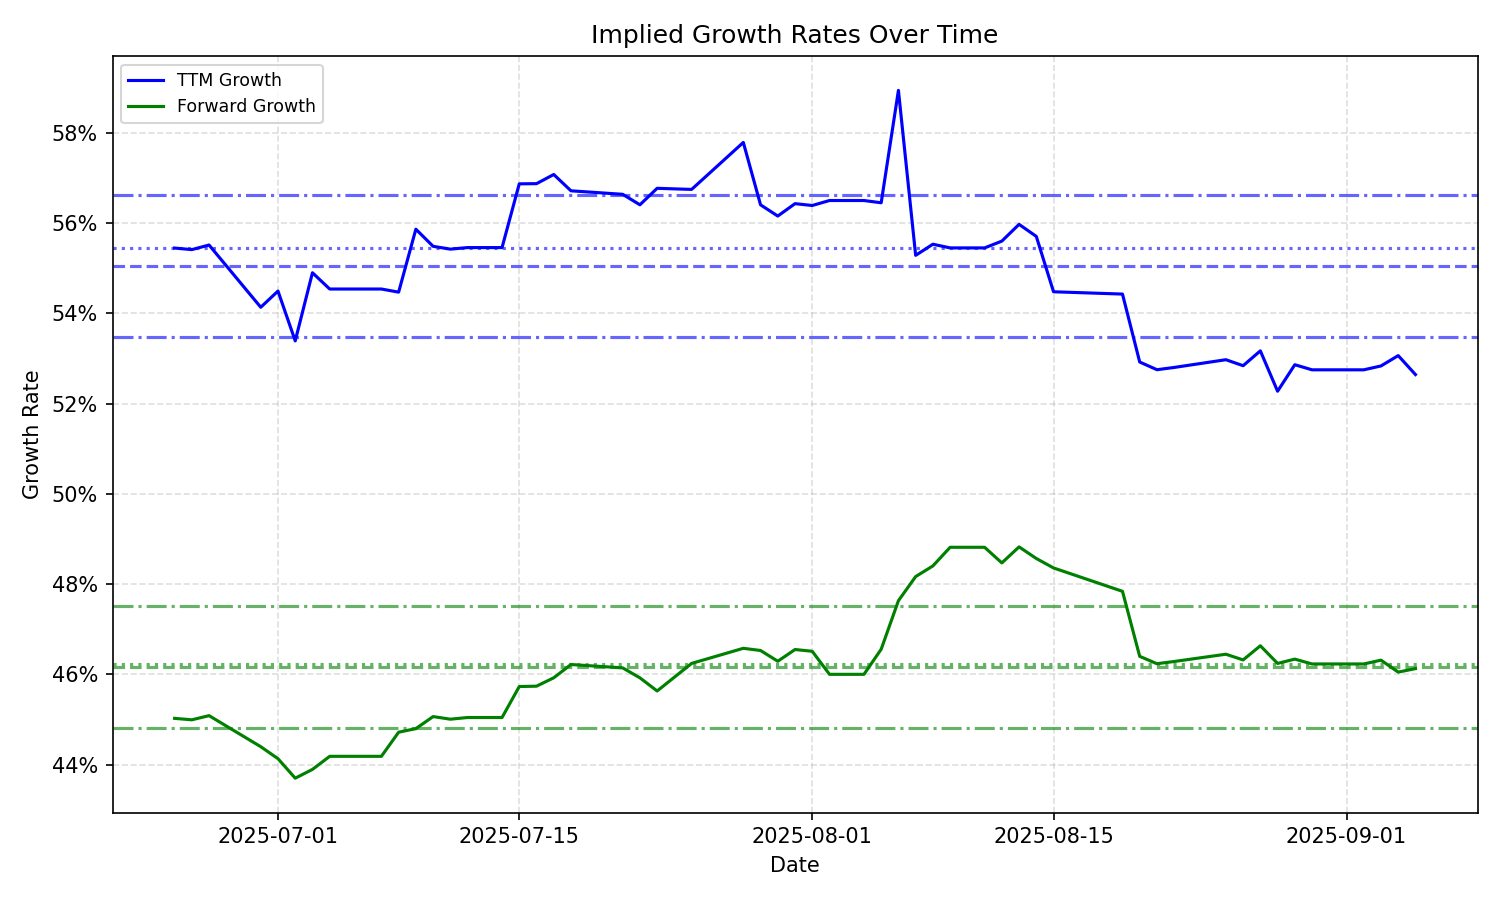
| Average | Median | Std Dev | Current | Percentile | ||||||
|---|---|---|---|---|---|---|---|---|---|---|
| TTM | Forward | TTM | Forward | TTM | Forward | TTM | Forward | TTM | Forward | |
| Timeframe | ||||||||||
| 1 Year | 48.72% | 38.97% | 49.42% | 45.00% | 7.32% | 9.43% | 36.49% | 25.78% | 7.4% | 8.7% |
| 3 Years | 48.72% | 38.97% | 49.42% | 45.00% | 7.32% | 9.43% | 36.49% | 25.78% | 7.4% | 8.7% |
| 5 Years | 48.72% | 38.97% | 49.42% | 45.00% | 7.32% | 9.43% | 36.49% | 25.78% | 7.4% | 8.7% |
| 10 Years | 48.72% | 38.97% | 49.42% | 45.00% | 7.32% | 9.43% | 36.49% | 25.78% | 7.4% | 8.7% |