Pinterest, Inc. — PINS
| Close Price | Market Cap | P/E Ratio | Forward P/E Ratio | Implied Growth* | Implied Forward Growth* | Dividend | P/B Ratio |
|---|---|---|---|---|---|---|---|
| $20.05 | $11.23B | 41.8 | 8.9 | 19.8% | 3.3% | - | 2.8 |
Latest Headlines
- · 3 Cash-Heavy Stocks Worth Your Attention
- · Pinterest, Inc. (PINS) is Attracting Investor Attention: Here is What You Should Know
- · Stocks making big moves yesterday: Cloudflare, Pinterest, AMD, Agilysys, and Intel
- · Why Pinterest (PINS) Shares Are Plunging Today
- · Reddit Benefits From Solid ARPU Growth: A Sign for More Upside?
- · BMO Capital Sees AI Ad Improvements Supporting Growth at Pinterest (PINS)
Revenue & Net Income
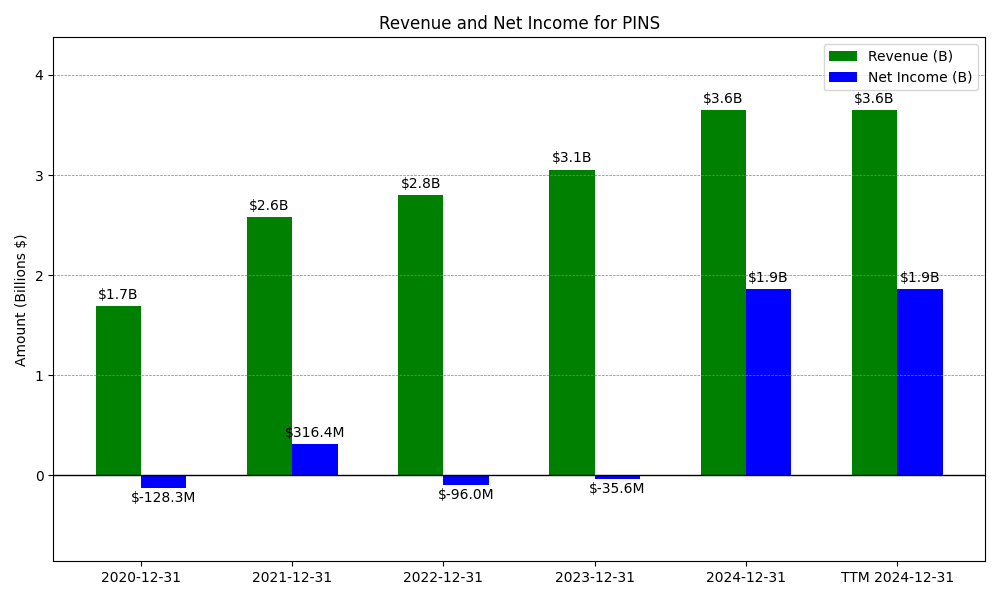
| Date | Revenue | Net_Income | EPS | Last_Updated | Revenue_Change | Net_Income_Change | EPS_Change | |
|---|---|---|---|---|---|---|---|---|
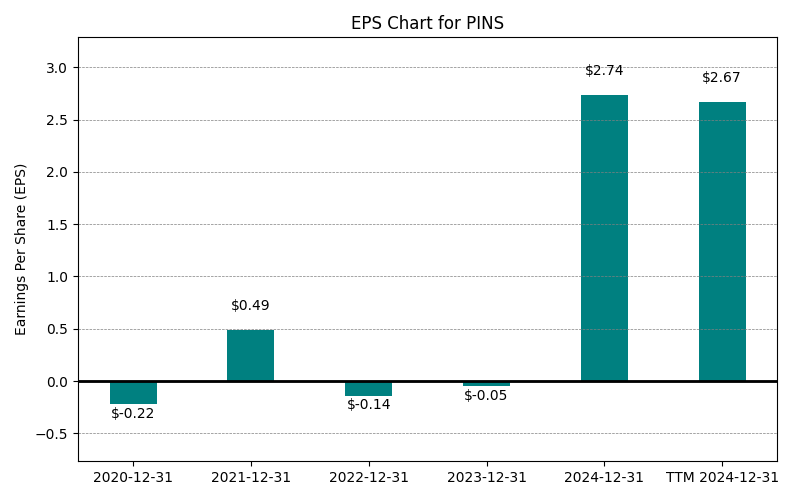
| 0 | 2020-12-31 | $1,693M | $-128M | $-0.22 | 2024-02-08 22:12:20 | N/A | N/A | N/A |
| 1 | 2021-12-31 | $2,803M | $-96M | $0.49 | 2026-05-29 09:13:40 | 65.6% | -25.2% | -322.7% |
| 2 | 2022-12-31 | $2,803M | $-96M | $-0.14 | 2026-05-29 09:13:40 | 0.0% | 0.0% | -128.6% |
| 3 | 2023-12-31 | $3,055M | $-36M | $-0.05 | 2026-05-29 09:13:40 | 9.0% | -62.9% | -64.3% |
| 4 | 2024-12-31 | $3,646M | $1,862M | $2.74 | 2026-05-29 09:13:40 | 19.3% | -5329.2% | -5580.0% |
| 5 | 2025-12-31 | $4,222M | $417M | $2.74 | 2026-05-29 09:13:40 | 15.8% | -77.6% | 0.0% |
| 6 | TTM 2026-03-31 | $4,374M | $334M | $0.48 | 2026-05-11 09:14:20 | 3.6% | -19.8% | -82.5% |
EPS
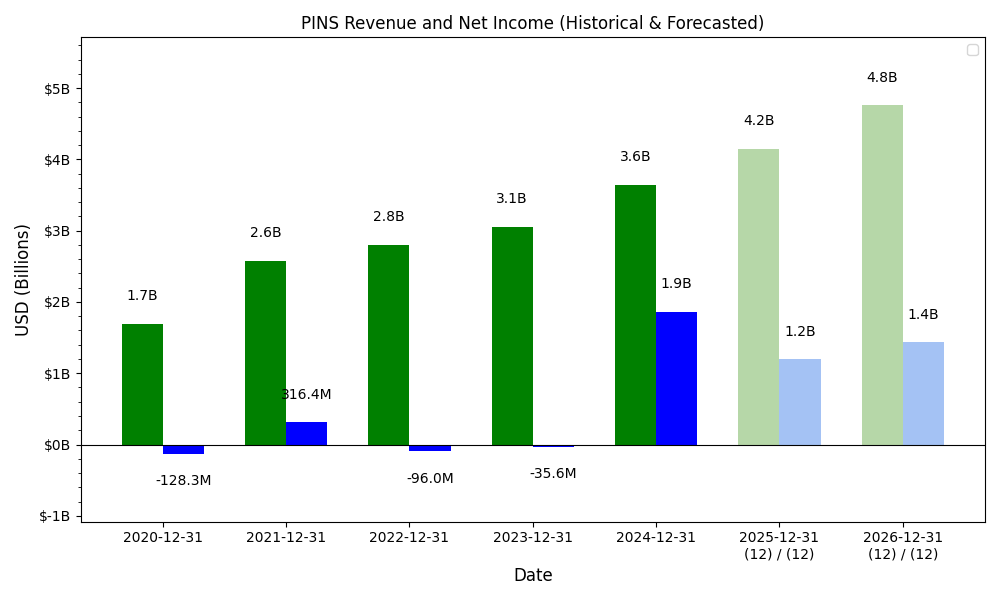
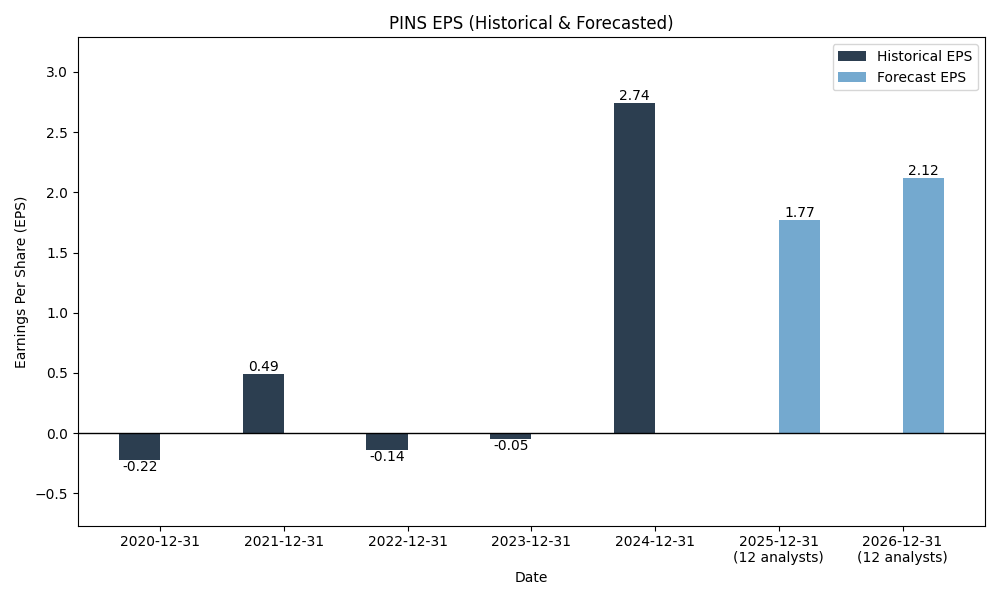
Forecasts
Y/Y % Change
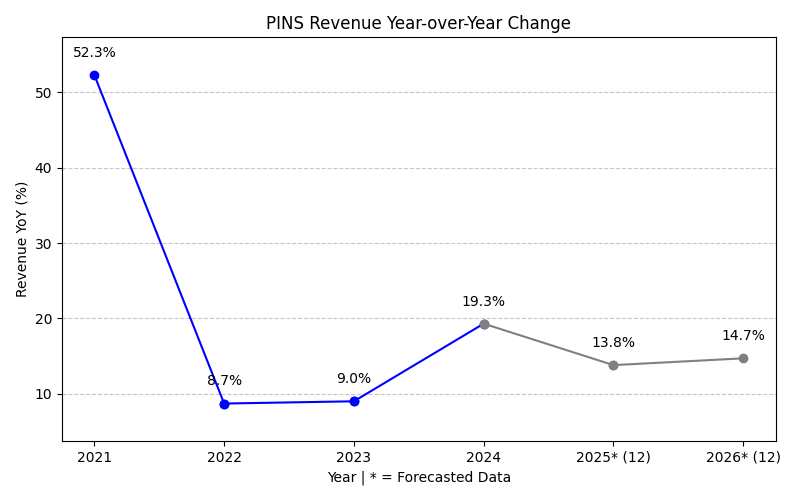
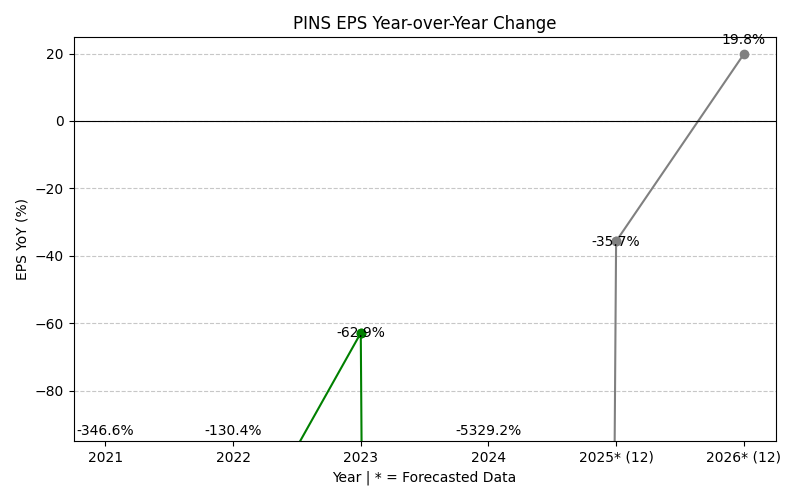
PINS Year-over-Year Growth
| 2020 | 2021 | 2022 | 2023 | 2024 | 2025 | 2026 | 2027 | Average | |
|---|---|---|---|---|---|---|---|---|---|
| Revenue Growth (%) | 65.6% | 0.0% | 9.0% | 19.3% | 15.8% | 15.2% | 12.6% | 19.6% | |
| Revenue Analysts (#) | 0 | 0 | 0 | 0 | 0 | 0 | 34 | 34 | |
| EPS Growth (%) | -25.2% | 0.0% | -62.9% | -5329.2% | -77.6% | 156.0% | 18.0% | -760.1% | |
| EPS Analysts (#) | 0 | 0 | 0 | 0 | 0 | 0 | 24 | 24 |
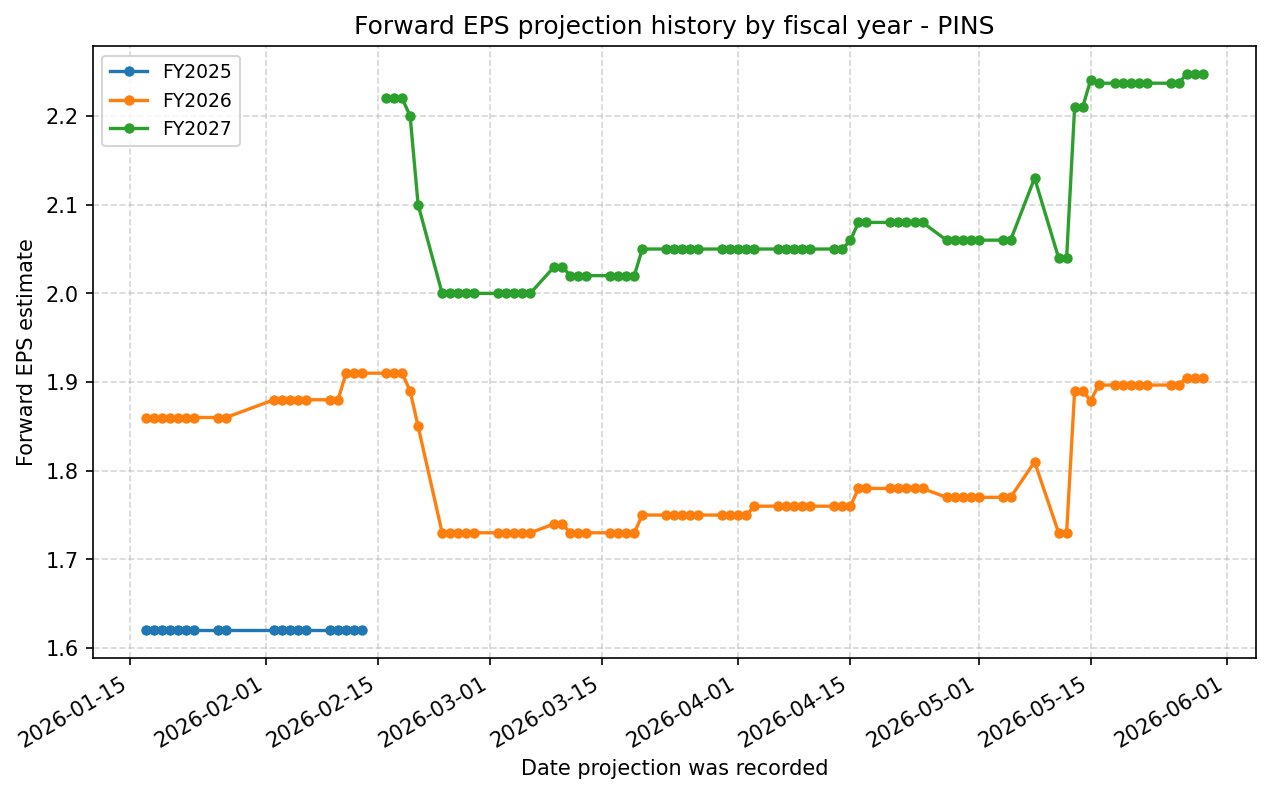
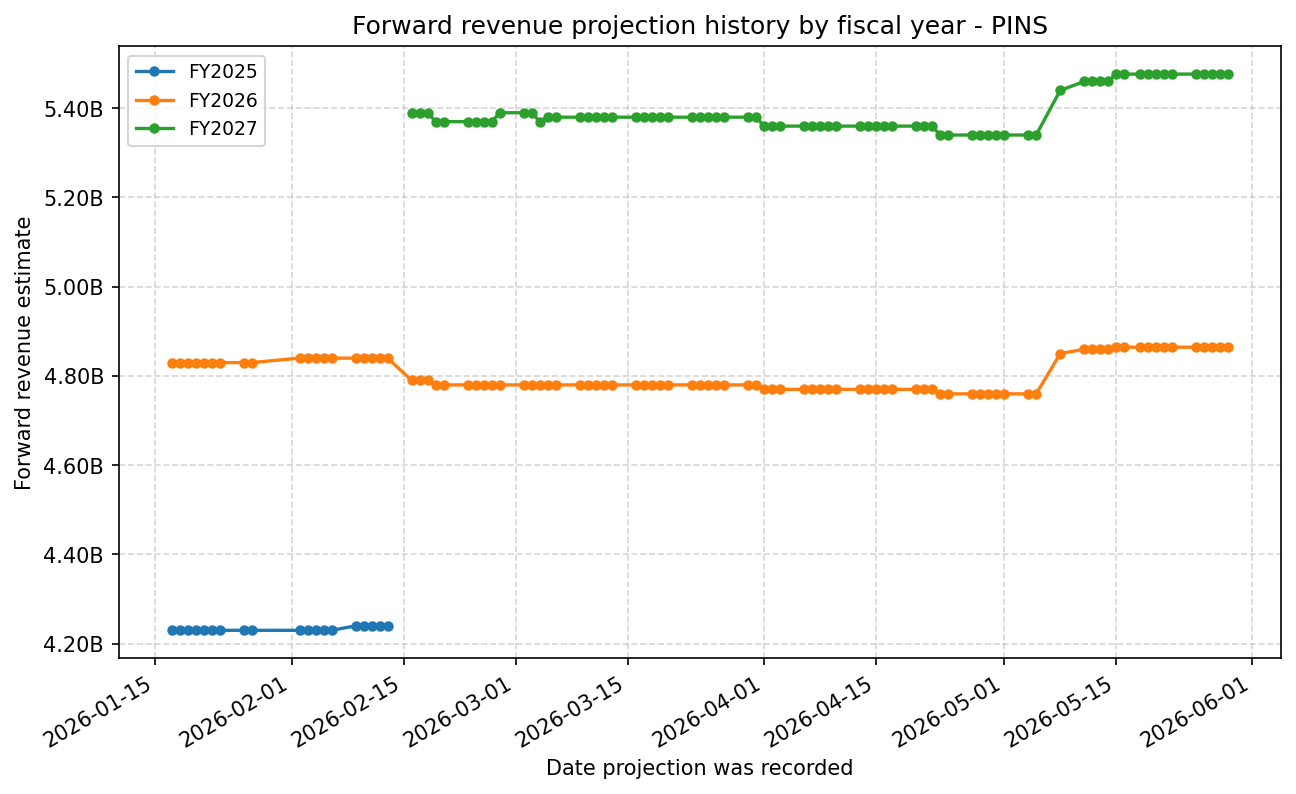
Forward Estimate History
How the next-FY EPS and revenue estimates have drifted over time. One line per fiscal year – past lines end when that FY became current.
Expenses
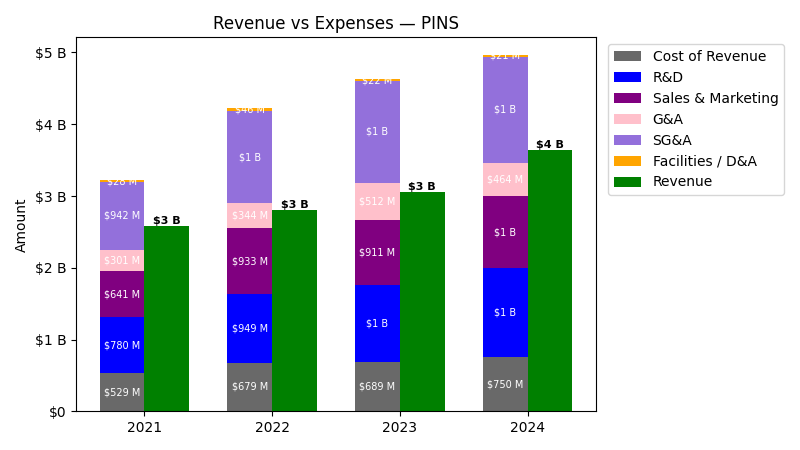
| Year | Revenue ($) | Cost of Revenue ($) | R&D ($) | Sales & Marketing ($) | G&A ($) | SG&A ($) | Facilities / D&A ($) |
|---|---|---|---|---|---|---|---|
| 2022 | $2.8B | $632.1M | $949.0M | $933.1M | $343.5M | $1.3B | $46.5M |
| 2023 | $3.1B | $667.3M | $1.1B | $911.2M | $512.4M | $1.4B | $21.5M |
| 2024 | $3.6B | $729.1M | $1.2B | $1.0B | $463.7M | $1.5B | $21.3M |
| 2025 | $4.2B | $816.4M | $1.4B | $1.2B | $466.2M | $1.6B | $25.2M |
| TTM | $4.4B | $852.7M | $1.5B | $1.2B | $464.1M | $1.7B | $28.1M |
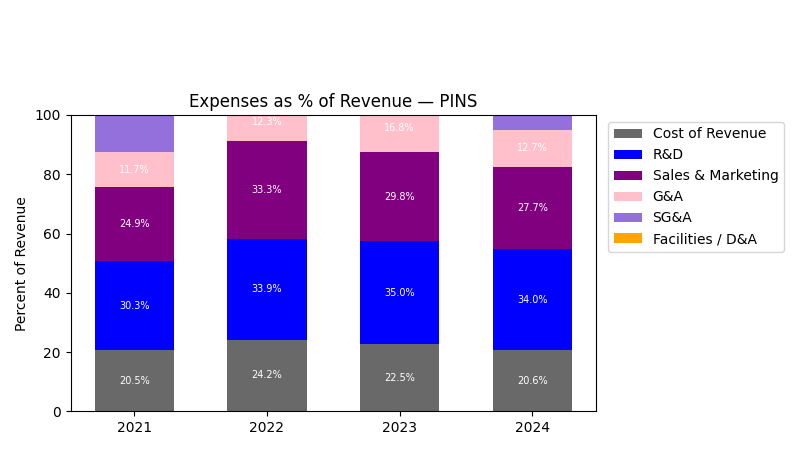
| Year | Revenue Change (%) | Cost of Revenue Change (%) | R&D Change (%) | Sales & Marketing Change (%) | G&A Change (%) | SG&A Change (%) | Facilities / D&A Change (%) |
|---|---|---|---|---|---|---|---|
| 2023 | 9.01 | 5.56 | 12.59 | -2.35 | 49.15 | 11.51 | -53.73 |
| 2024 | 19.35 | 9.27 | 16.11 | 11.04 | -9.51 | 3.64 | -1.13 |
| 2025 | 15.79 | 11.97 | 15.06 | 15.31 | 0.55 | 10.67 | 18.27 |
| TTM | 3.61 | 4.45 | 3.44 | 5.48 | -0.45 | 3.79 | 11.84 |
No unmapped expenses.
Balance Sheet
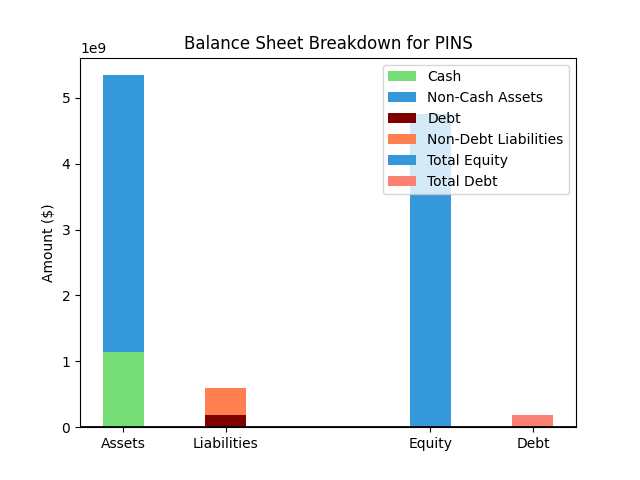
| Metric | Value | |
|---|---|---|
| 0 | Total Assets | $4,645M |
| 1 | Cash | $378M |
| 2 | Total Liabilities | $1,795M |
| 3 | Total Debt | $1,205M |
| 4 | Total Equity | $2,851M |
| 5 | Debt to Equity Ratio | 0.42 |
EPS & Dividend

Valuation
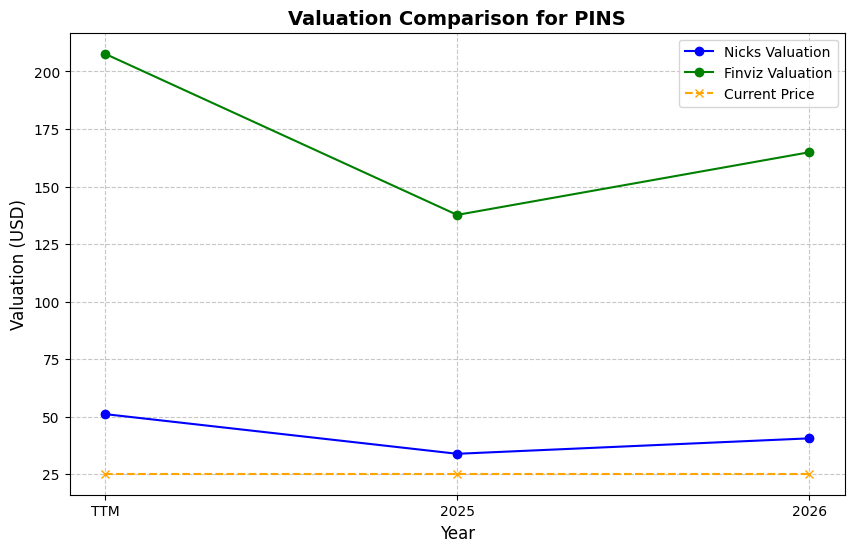
| Share Price | Treasury Yield | Estimates | Fair Value (P/E) | Fair Value (P/S) | Current P/S | Current P/E |
|---|---|---|---|---|---|---|
| $20.05 | 4.5% | Nicks Growth: 11% Nick's Expected Margin: 8% FINVIZ Growth: 16% |
Nicks: 19 Finviz: 30 |
Nick's: 1.508 | 2.6 | 41.8 |
| Basis | Year | Nicks Valuation | Nicks vs Share Price | Finviz Valuation | Finviz vs Share Price |
|---|---|---|---|---|---|
| $0.48 EPS | TTM | $9.05 | -54.9% | $14.60 | -27.2% |
| $1.90 EPS | 2026 | $35.92 | 79.1% | $57.95 | 189.0% |
| $2.25 EPS | 2027 | $42.37 | 111.3% | $68.36 | 241.0% |
Implied Growth
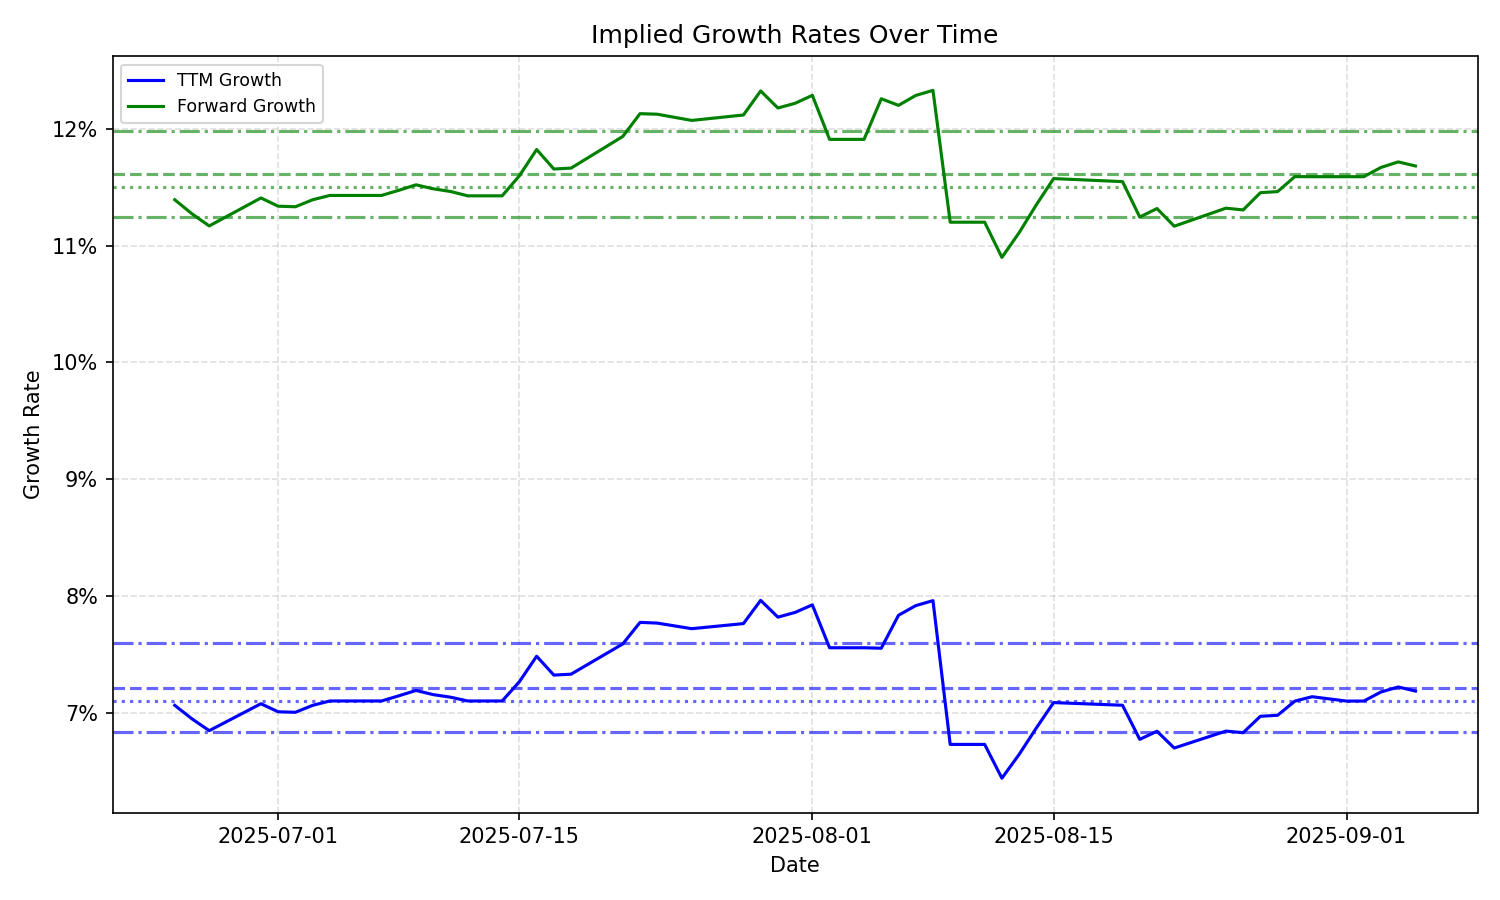
| Average | Median | Std Dev | Current | Percentile | ||||||
|---|---|---|---|---|---|---|---|---|---|---|
| TTM | Forward | TTM | Forward | TTM | Forward | TTM | Forward | TTM | Forward | |
| Timeframe | ||||||||||
| 1 Year | 9.01% | 7.63% | 7.03% | 7.81% | 5.66% | 3.59% | 20.16% | 3.61% | 98.3% | 27.3% |
| 3 Years | 9.01% | 7.63% | 7.03% | 7.81% | 5.66% | 3.59% | 20.16% | 3.61% | 98.3% | 27.3% |
| 5 Years | 9.01% | 7.63% | 7.03% | 7.81% | 5.66% | 3.59% | 20.16% | 3.61% | 98.3% | 27.3% |
| 10 Years | 9.01% | 7.63% | 7.03% | 7.81% | 5.66% | 3.59% | 20.16% | 3.61% | 98.3% | 27.3% |