Procter & Gamble Company (The) — PG
| Close Price | Market Cap | P/E Ratio | Forward P/E Ratio | Implied Growth* | Implied Forward Growth* | Dividend | P/B Ratio |
|---|---|---|---|---|---|---|---|
| $143.56 | $334.29B | 21.0 | 20.2 | 12.1% | 11.8% | $4.26 3.0% | 6.2 |
Latest Headlines
- · VYM Climbs 26% In a Year While Its Core Dividend Payers Extend Their Streaks
- · Is Procter & Gamble Stock Underperforming the S&P 500?
- · AAF 75th Hall of Fame: Former P&G CMO Jim Stengel Honored for Advertising Impact
- · 3 Dividend Kings to Buy Now to Replace the Social Security Income You're About to Lose
- · Procter & Gamble vs. Clorox: Which Consumer Goods Stock Is a Better Buy in 2026?
- · Tyson Foods names Jeff Schomburger CEO to replace Donnie King
Revenue & Net Income
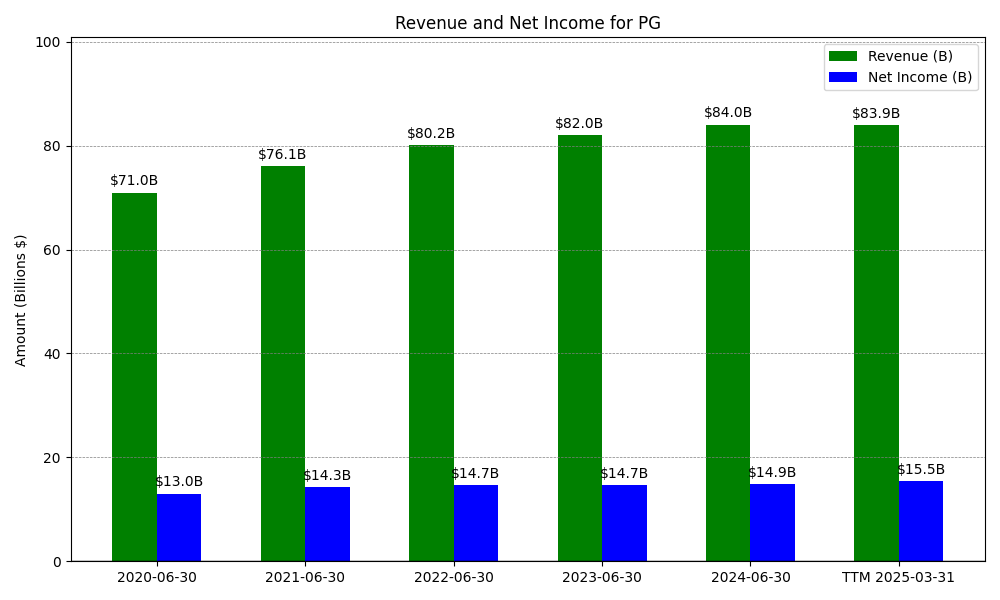
| Date | Revenue | Net_Income | EPS | Last_Updated | Revenue_Change | Net_Income_Change | EPS_Change | |
|---|---|---|---|---|---|---|---|---|
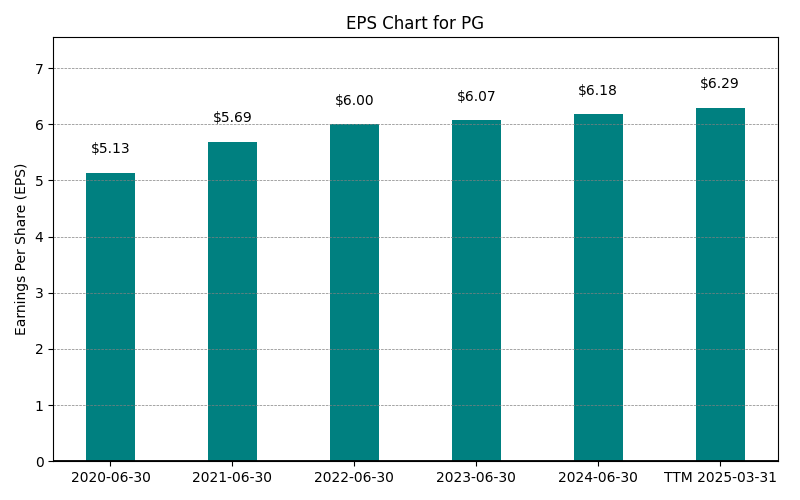
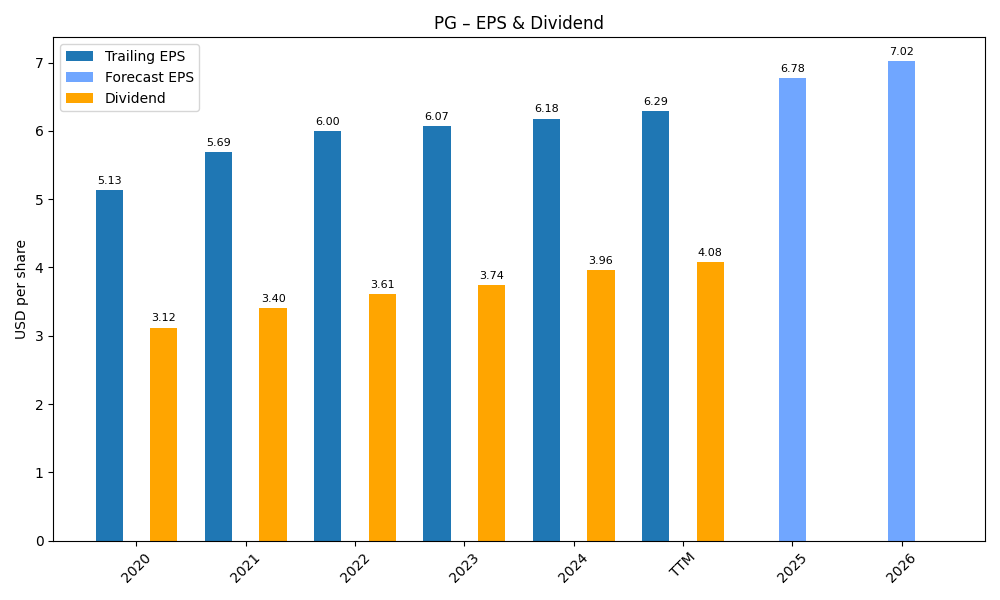
| 0 | 2020-06-30 | $70,950M | $13,027M | $5.13 | 2024-05-25 17:13:42 | N/A | N/A | N/A |
| 1 | 2021-06-30 | $76,118M | $14,306M | $5.69 | 2024-05-25 17:13:42 | 7.3% | 9.8% | 10.9% |
| 2 | 2022-06-30 | $80,187M | $14,742M | $6.00 | 2026-05-29 09:13:34 | 5.3% | 3.0% | 5.4% |
| 3 | 2023-06-30 | $82,006M | $14,653M | $6.07 | 2026-05-29 09:13:34 | 2.3% | -0.6% | 1.2% |
| 4 | 2024-06-30 | $84,039M | $14,879M | $6.18 | 2026-05-29 09:13:34 | 2.5% | 1.5% | 1.8% |
| 5 | 2025-06-30 | $84,284M | $15,974M | $6.67 | 2026-05-29 09:13:34 | 0.3% | 7.4% | 7.9% |
| 6 | TTM 2026-03-31 | $86,718M | $16,616M | $6.84 | 2026-04-28 08:56:12 | 2.9% | 4.0% | 2.5% |
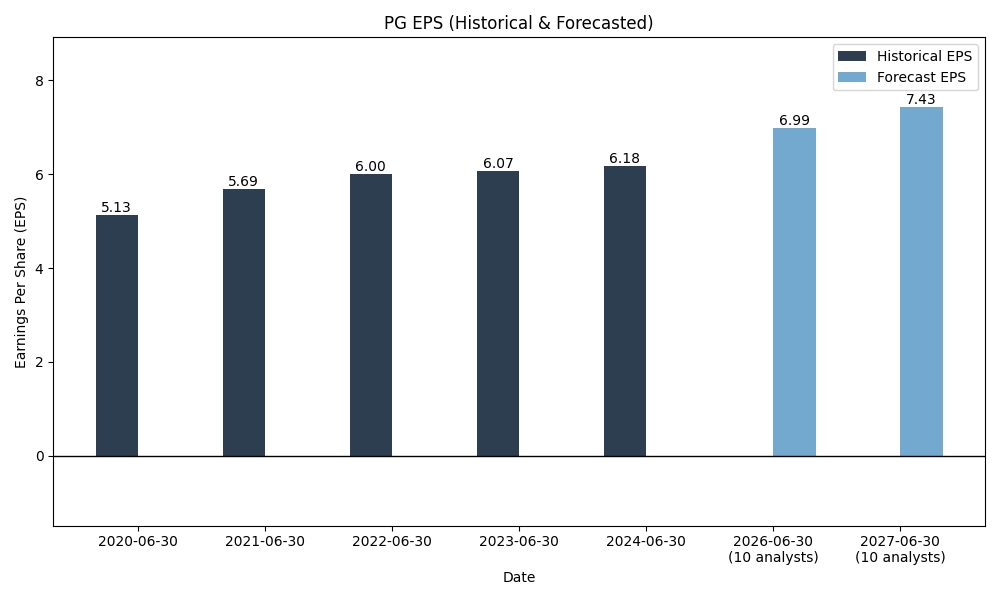
EPS
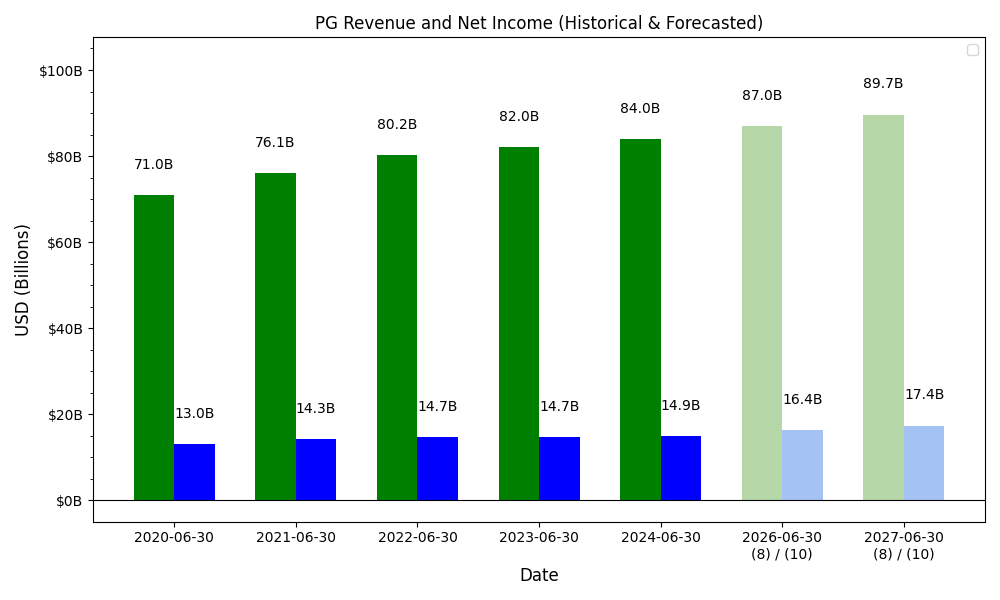
Forecasts
Y/Y % Change
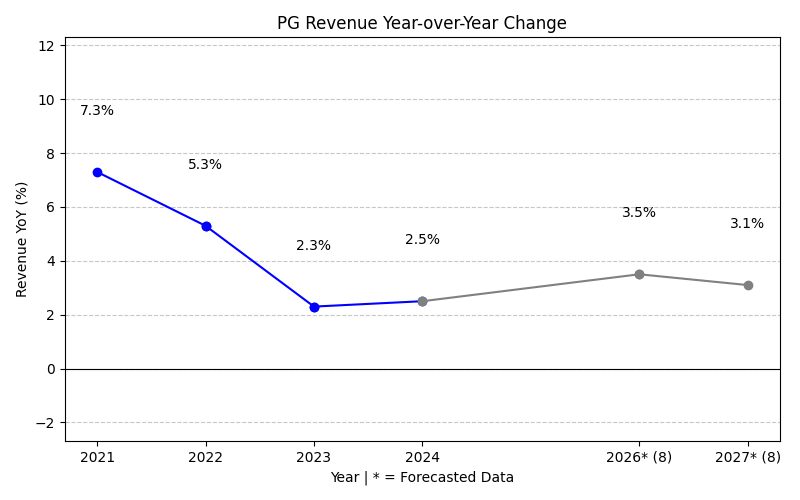
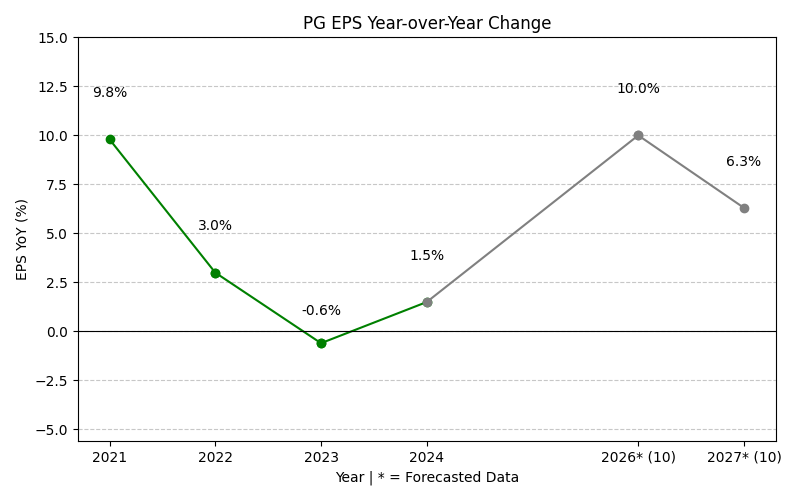
PG Year-over-Year Growth
| 2020 | 2021 | 2022 | 2023 | 2024 | 2025 | 2026 | 2027 | Average | |
|---|---|---|---|---|---|---|---|---|---|
| Revenue Growth (%) | 7.3% | 5.3% | 2.3% | 2.5% | 0.3% | 3.3% | 2.8% | 3.4% | |
| Revenue Analysts (#) | 0 | 0 | 0 | 0 | 0 | 0 | 21 | 21 | |
| EPS Growth (%) | 9.8% | 3.0% | -0.6% | 1.5% | 7.4% | 0.6% | 2.8% | 3.5% | |
| EPS Analysts (#) | 0 | 0 | 0 | 0 | 0 | 0 | 22 | 22 |
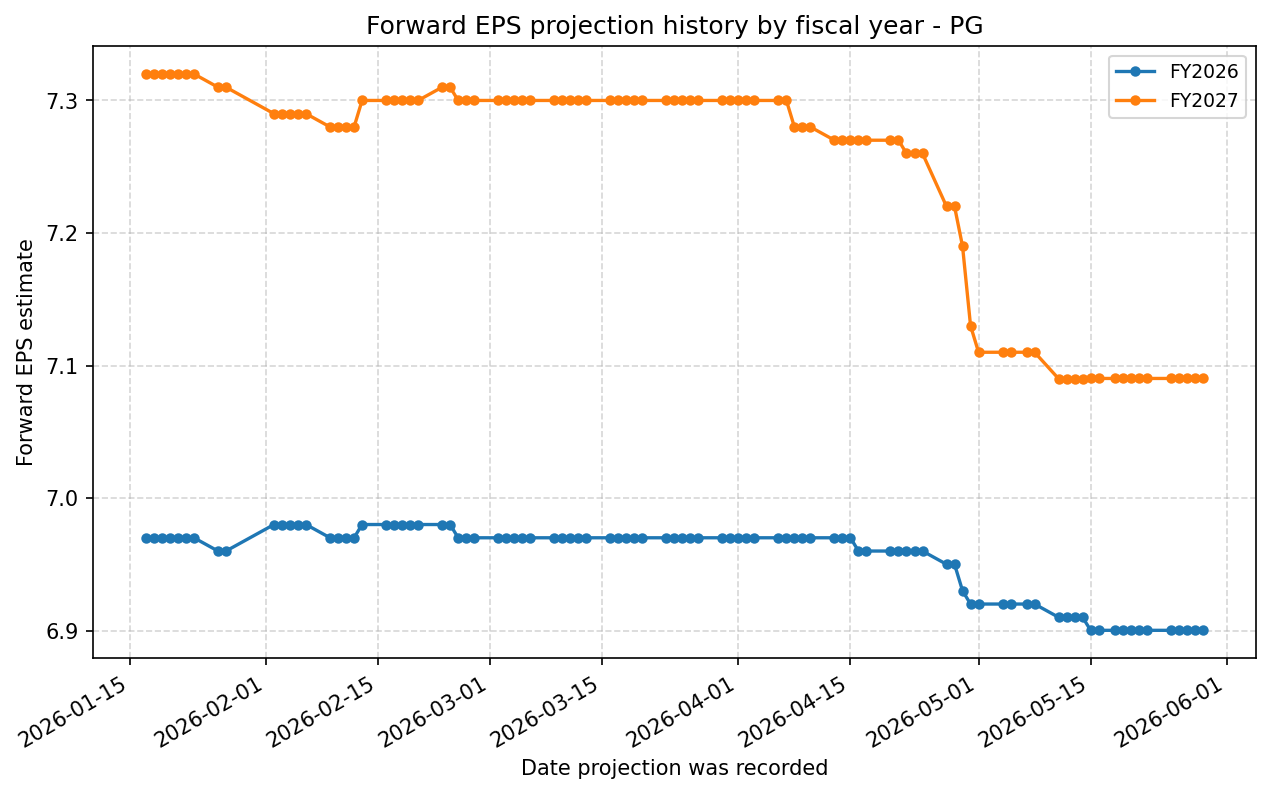
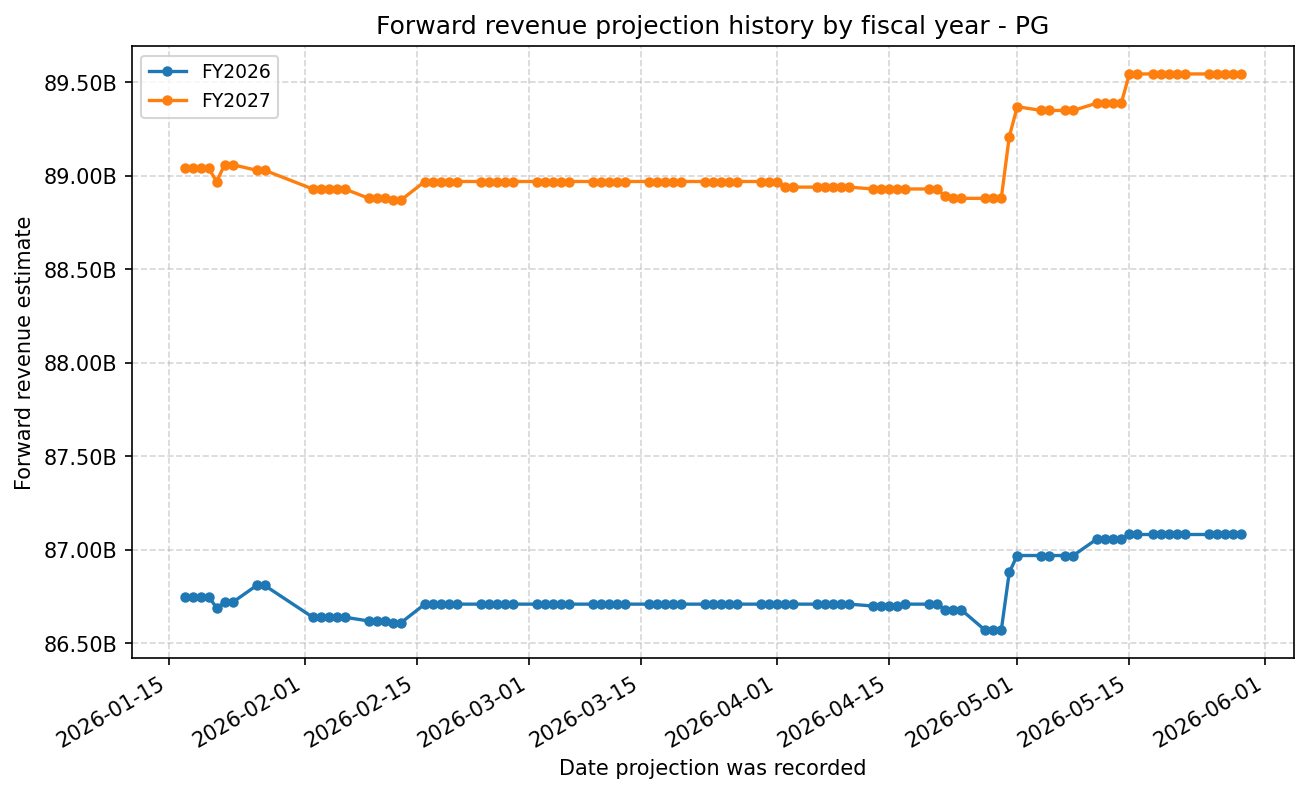
Forward Estimate History
How the next-FY EPS and revenue estimates have drifted over time. One line per fiscal year – past lines end when that FY became current.
Expenses
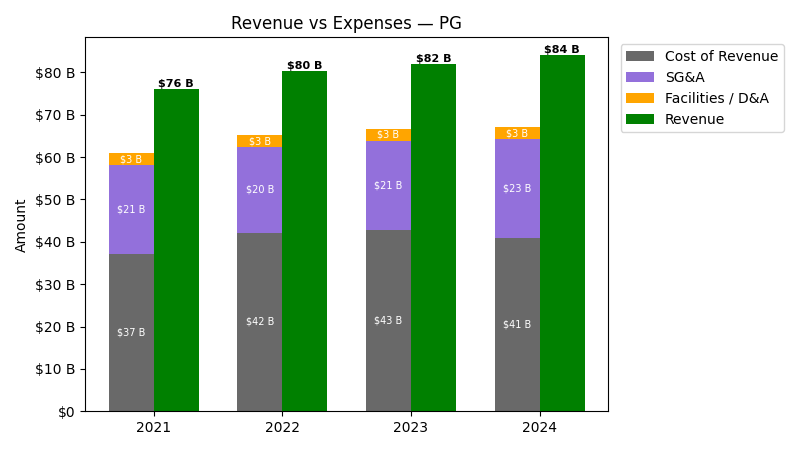
| Year | Revenue ($) | Cost of Revenue ($) | SG&A ($) | Facilities / D&A ($) |
|---|---|---|---|---|
| 2021 | $76.1B | $34.4B | $21.0B | $2.7B |
| 2022 | $80.2B | $39.4B | $20.2B | $2.8B |
| 2023 | $82.0B | $40.0B | $21.1B | $2.7B |
| 2024 | $84.0B | $38.0B | $23.3B | $2.9B |
| 2025 | $84.3B | $38.3B | $22.7B | $2.8B |
| TTM | $86.7B | $40.0B | $23.5B | $3.1B |
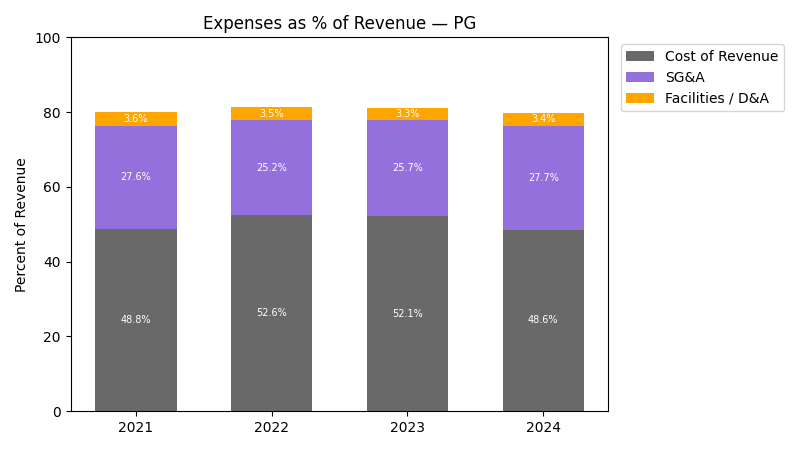
| Year | Revenue Change (%) | Cost of Revenue Change (%) | SG&A Change (%) | Facilities / D&A Change (%) |
|---|---|---|---|---|
| 2022 | 5.35 | 14.48 | -3.84 | 2.63 |
| 2023 | 2.27 | 1.77 | 4.43 | -3.31 |
| 2024 | 2.48 | -5.23 | 10.39 | 6.71 |
| 2025 | 0.29 | 0.96 | -2.73 | -1.69 |
| TTM | 2.89 | 4.40 | 3.63 | 7.87 |
No unmapped expenses.
Segment Performance
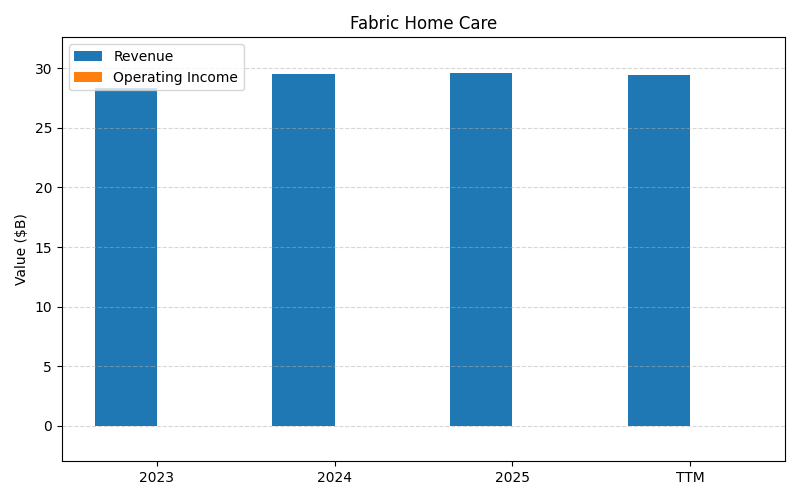
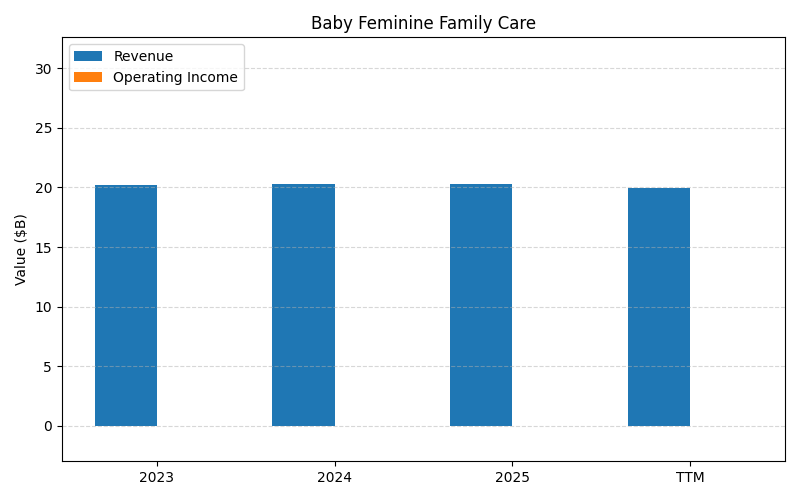
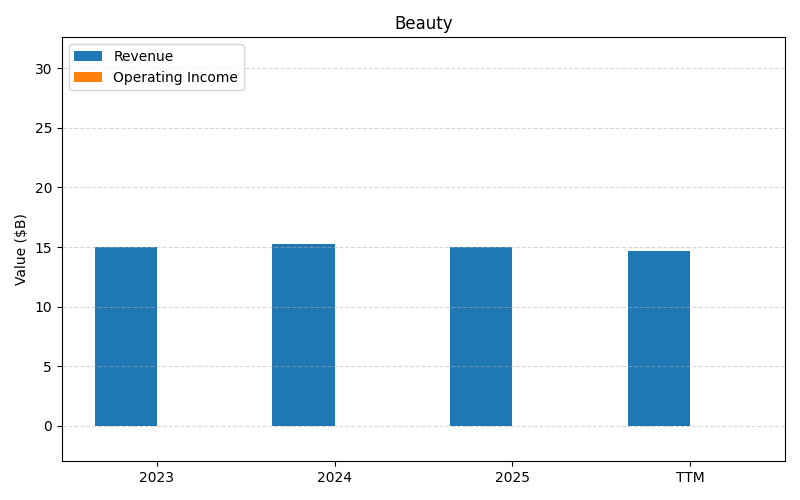
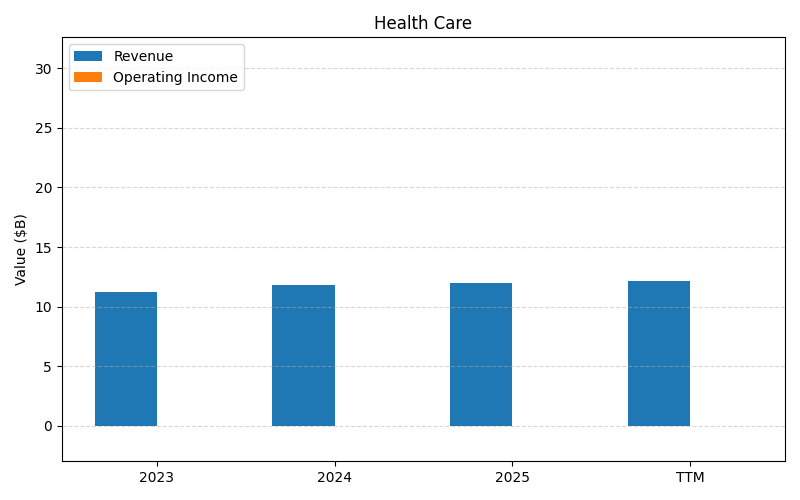
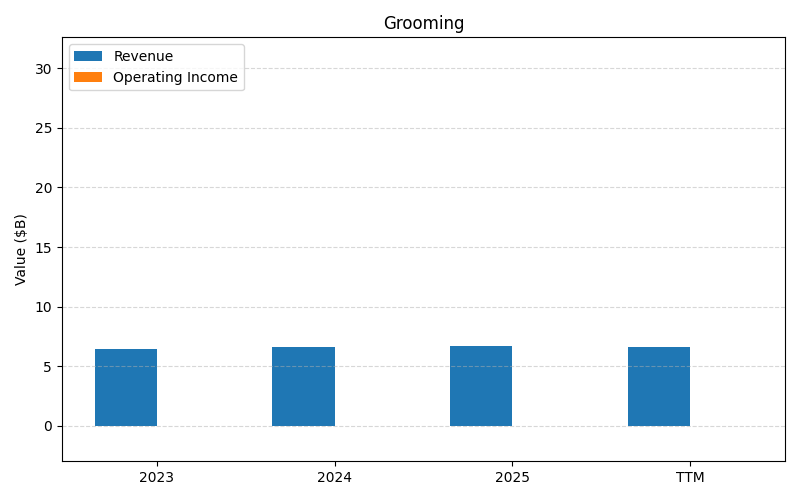
SEGMENTS v2025-09-09 · 2026-05-29 09:13 UTC — Units: $B. Rows list fiscal years (last 3 + TTM) with revenue for each segment; the final row shows the TTM revenue mix (operating income columns display “—” where mix is not applicable).
| Year | Fabric Home Care Rev | Baby Feminine Family Care Rev | Beauty Rev | Health Care Rev | Grooming Rev | Total Rev |
|---|---|---|---|---|---|---|
| 2023 | 28.4B | 20.2B | 15B | 11.2B | 6.42B | 81.2B |
| 2024 | 29.5B | 20.3B | 15.2B | 11.8B | 6.65B | 83.4B |
| 2025 | 29.6B | 20.2B | 15B | 12B | 6.66B | 83.5B |
| TTM | 118.6B | 80.8B | 60.8B | 48.7B | 26.6B | 335.6B |
| % of Total (TTM) | 35.3% | 24.1% | 18.1% | 14.5% | 7.9% | 100% |
Balance Sheet
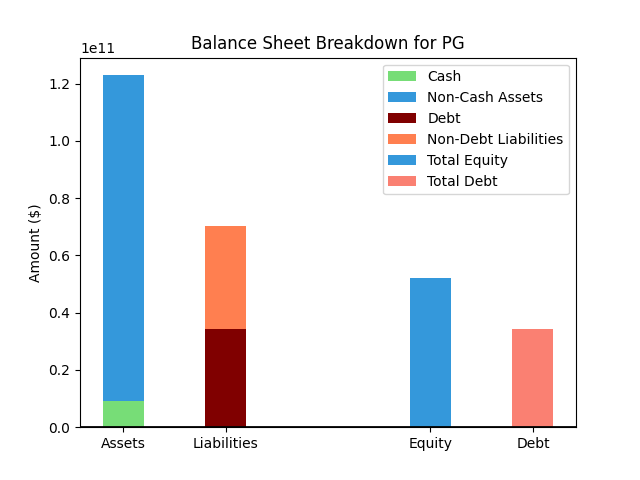
| Metric | Value | |
|---|---|---|
| 0 | Total Assets | $128,378M |
| 1 | Cash | $12,306M |
| 2 | Total Liabilities | $73,647M |
| 3 | Total Debt | $37,026M |
| 4 | Total Equity | $54,505M |
| 5 | Debt to Equity Ratio | 0.68 |
EPS & Dividend
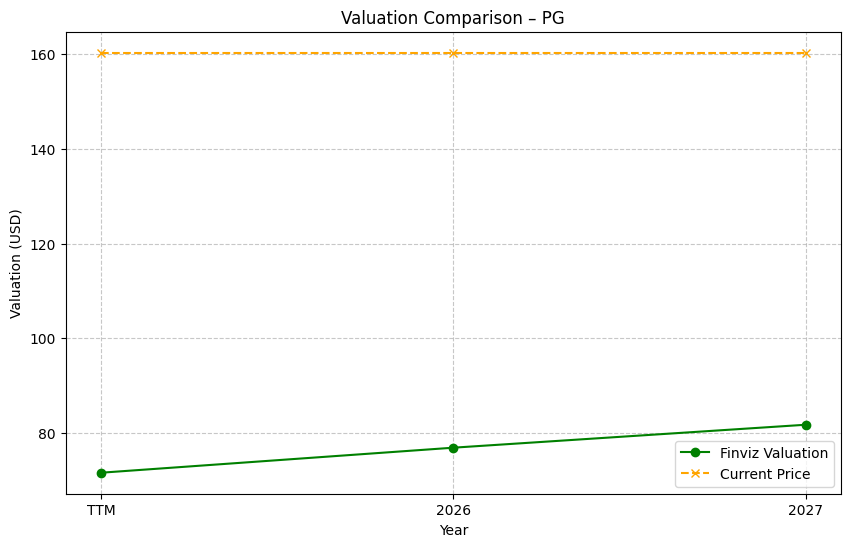
Valuation
| Share Price | Treasury Yield | Estimates | Fair Value (P/E) | Fair Value (P/S) | Current P/S | Current P/E |
|---|---|---|---|---|---|---|
| $143.56 | 4.5% | FINVIZ Growth: 3% | Nicks: 6 Finviz: 9 |
Nick's: 0.000 | 3.9 | 21.0 |
| Basis | Year | Nicks Valuation | Nicks vs Share Price | Finviz Valuation | Finviz vs Share Price |
|---|---|---|---|---|---|
| $6.84 EPS | TTM | $43.37 | -69.8% | $60.60 | -57.8% |
| $6.90 EPS | 2026 | $43.76 | -69.5% | $61.14 | -57.4% |
| $7.09 EPS | 2027 | $44.96 | -68.7% | $62.82 | -56.2% |
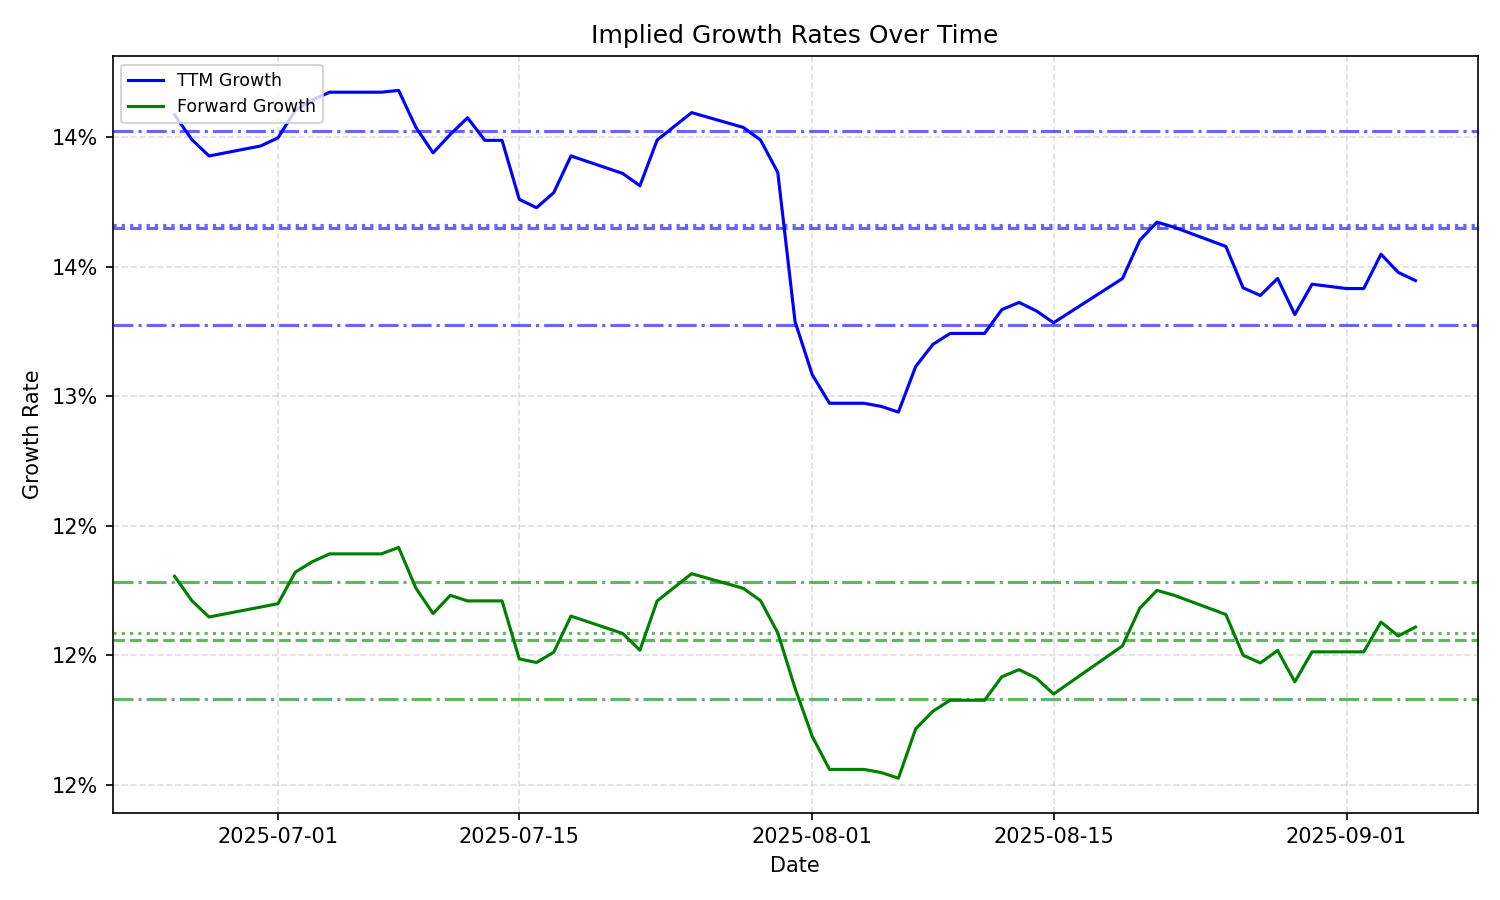
Implied Growth
| Average | Median | Std Dev | Current | Percentile | ||||||
|---|---|---|---|---|---|---|---|---|---|---|
| TTM | Forward | TTM | Forward | TTM | Forward | TTM | Forward | TTM | Forward | |
| Timeframe | ||||||||||
| 1 Year | 12.74% | 11.67% | 12.65% | 11.70% | 0.71% | 0.43% | 12.33% | 11.94% | 41.3% | 69.0% |
| 3 Years | 12.74% | 11.67% | 12.65% | 11.70% | 0.71% | 0.43% | 12.33% | 11.94% | 41.3% | 69.0% |
| 5 Years | 12.74% | 11.67% | 12.65% | 11.70% | 0.71% | 0.43% | 12.33% | 11.94% | 41.3% | 69.0% |
| 10 Years | 12.74% | 11.67% | 12.65% | 11.70% | 0.71% | 0.43% | 12.33% | 11.94% | 41.3% | 69.0% |