Pfizer, Inc. — PFE
| Close Price | Market Cap | P/E Ratio | Forward P/E Ratio | Implied Growth* | Implied Forward Growth* | Dividend | P/B Ratio |
|---|---|---|---|---|---|---|---|
| $26.18 | $149.21B | 20.0 | 9.2 | 11.6% | 3.7% | $1.72 6.6% | 1.7 |
Latest Headlines
- · Arvinas to Present at Jefferies Global Healthcare Conference
- · Pfizer's $10.5 Billion Oncology Bet Sends Innovent Shares Surging
- · Pfizer Expands Oncology Pipeline in $10.5B Innovent Deal
- · Healthcare ETFs to Buy as Eli Lily Steps Into Vaccine Market With $4B Bet
- · Seven-Year Analysis from Pfizer’s LORBRENA CROWN Trial Shows Longest Progression-Free Survival Reported to Date in Advanced Non-Small Cell Lung Cancer
- · Pfizer and Innovent Biologics sign $10.5B cancer drug deal
Revenue & Net Income
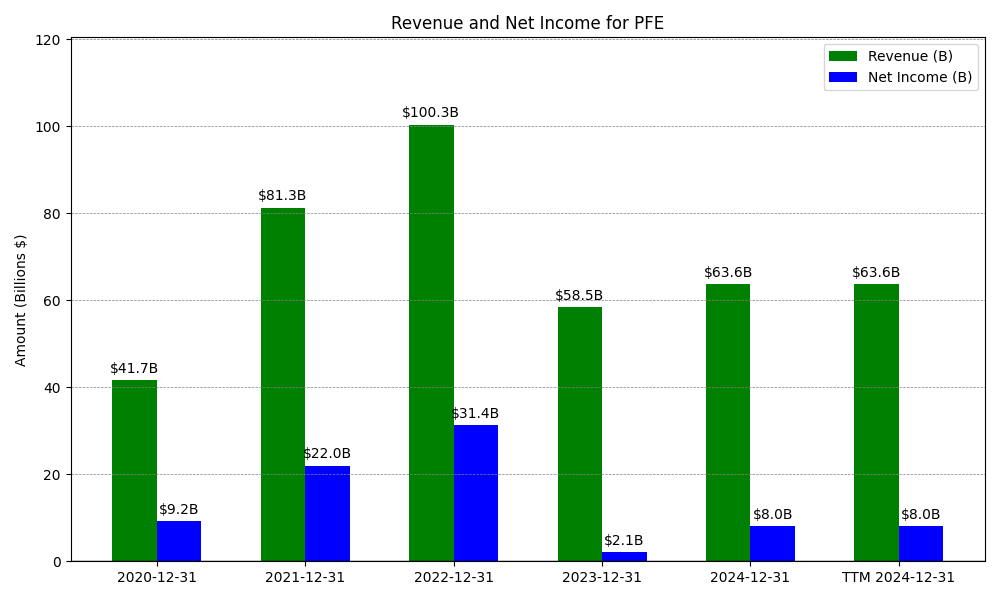
| Date | Revenue | Net_Income | EPS | Last_Updated | Revenue_Change | Net_Income_Change | EPS_Change | |
|---|---|---|---|---|---|---|---|---|
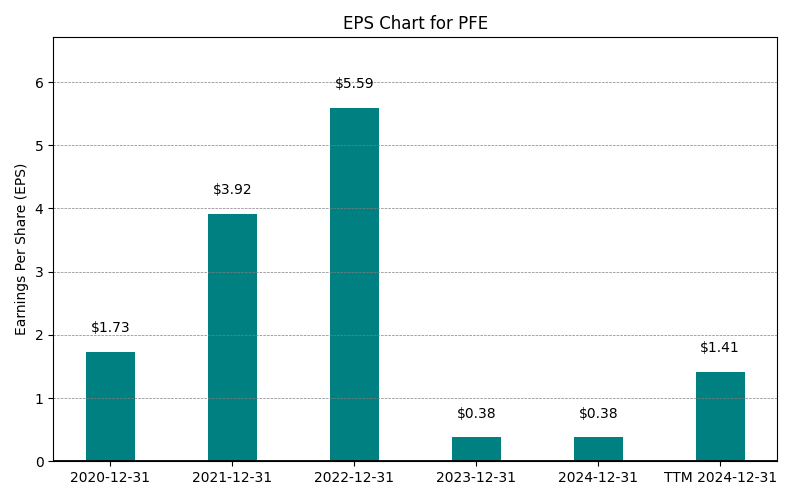
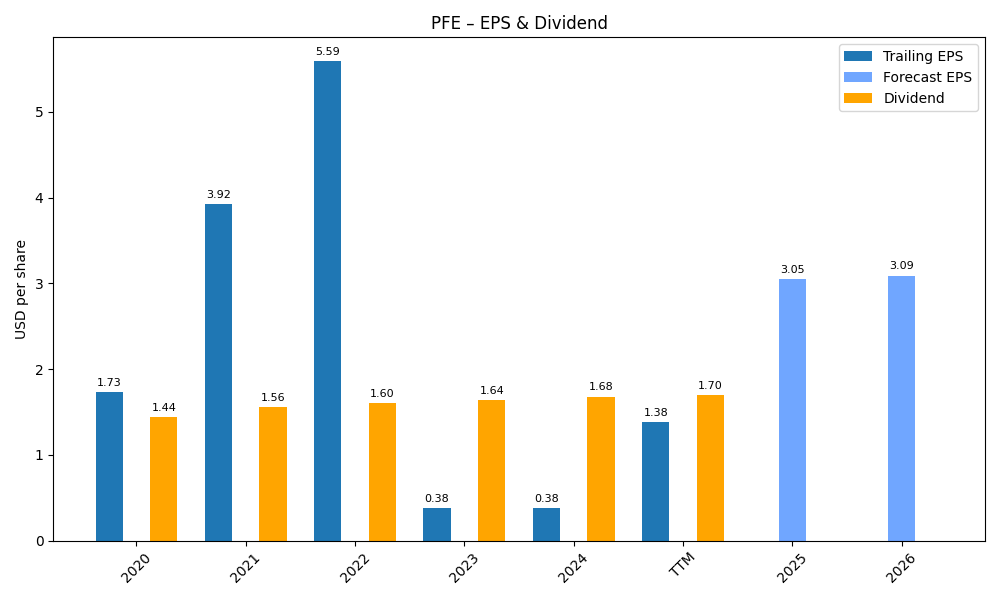
| 0 | 2020-12-31 | $41,651M | $9,159M | $1.73 | 2024-02-03 03:17:10 | N/A | N/A | N/A |
| 1 | 2021-12-31 | $81,288M | $21,979M | $3.92 | 2026-03-05 08:40:09 | 95.2% | 140.0% | 126.6% |
| 2 | 2022-12-31 | $101,175M | $31,372M | $5.59 | 2026-05-29 09:13:25 | 24.5% | 42.7% | 42.6% |
| 3 | 2023-12-31 | $59,554M | $2,119M | $0.38 | 2026-05-29 09:13:25 | -41.1% | -93.2% | -93.2% |
| 4 | 2024-12-31 | $63,627M | $8,031M | $1.42 | 2026-05-29 09:13:25 | 6.8% | 279.0% | 273.7% |
| 5 | 2025-12-31 | $62,579M | $7,771M | $1.37 | 2026-05-29 09:13:25 | -1.6% | -3.2% | -3.5% |
| 6 | TTM 2026-03-31 | $63,314M | $7,490M | $1.31 | 2026-05-07 09:01:42 | 1.2% | -3.6% | -4.4% |
EPS
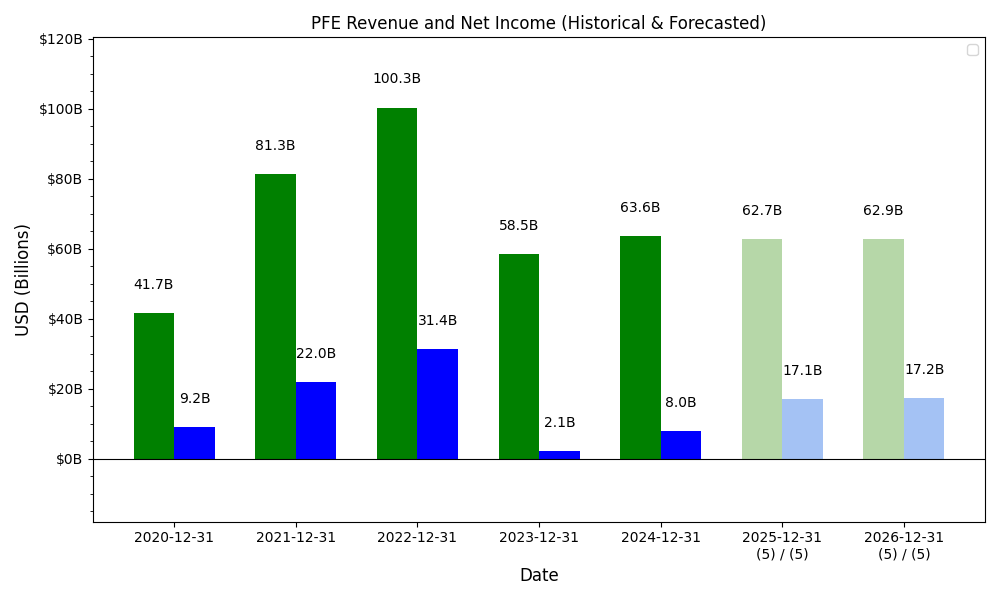
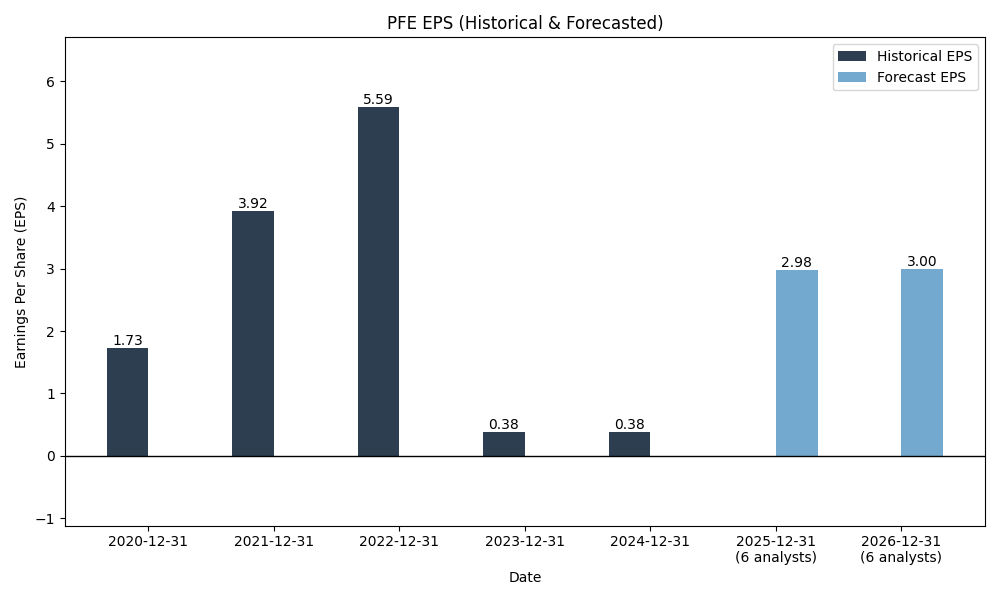
Forecasts
Y/Y % Change
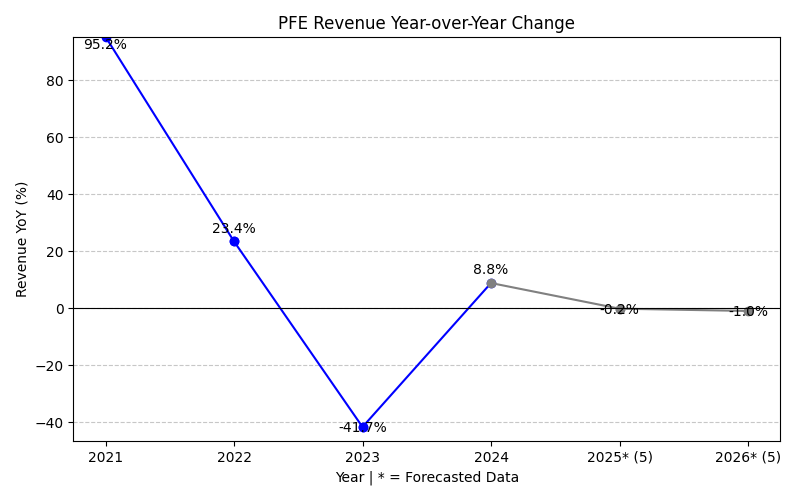
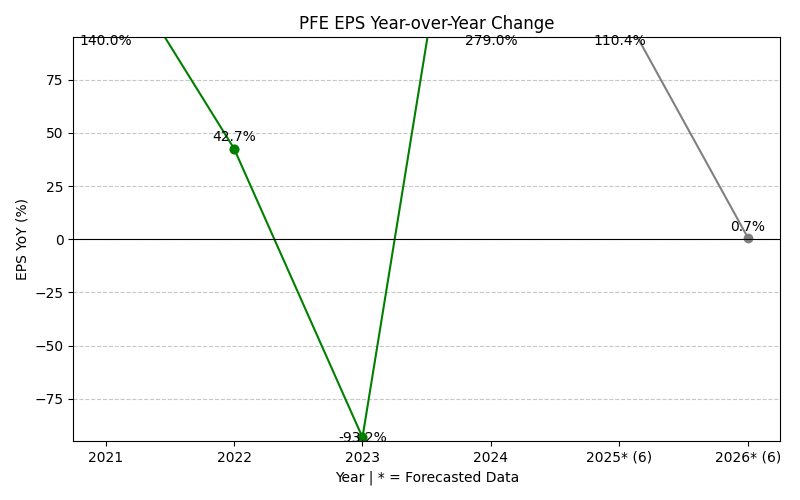
PFE Year-over-Year Growth
| 2020 | 2021 | 2022 | 2023 | 2024 | 2025 | 2026 | 2027 | Average | |
|---|---|---|---|---|---|---|---|---|---|
| Revenue Growth (%) | 95.2% | 24.5% | -41.1% | 6.8% | -1.6% | -1.4% | -3.8% | 11.2% | |
| Revenue Analysts (#) | 0 | 0 | 0 | 0 | 0 | 0 | 26 | 26 | |
| EPS Growth (%) | 140.0% | 42.7% | -93.2% | 279.0% | -3.2% | 117.2% | -4.2% | 68.3% | |
| EPS Analysts (#) | 0 | 0 | 0 | 0 | 0 | 0 | 26 | 26 |
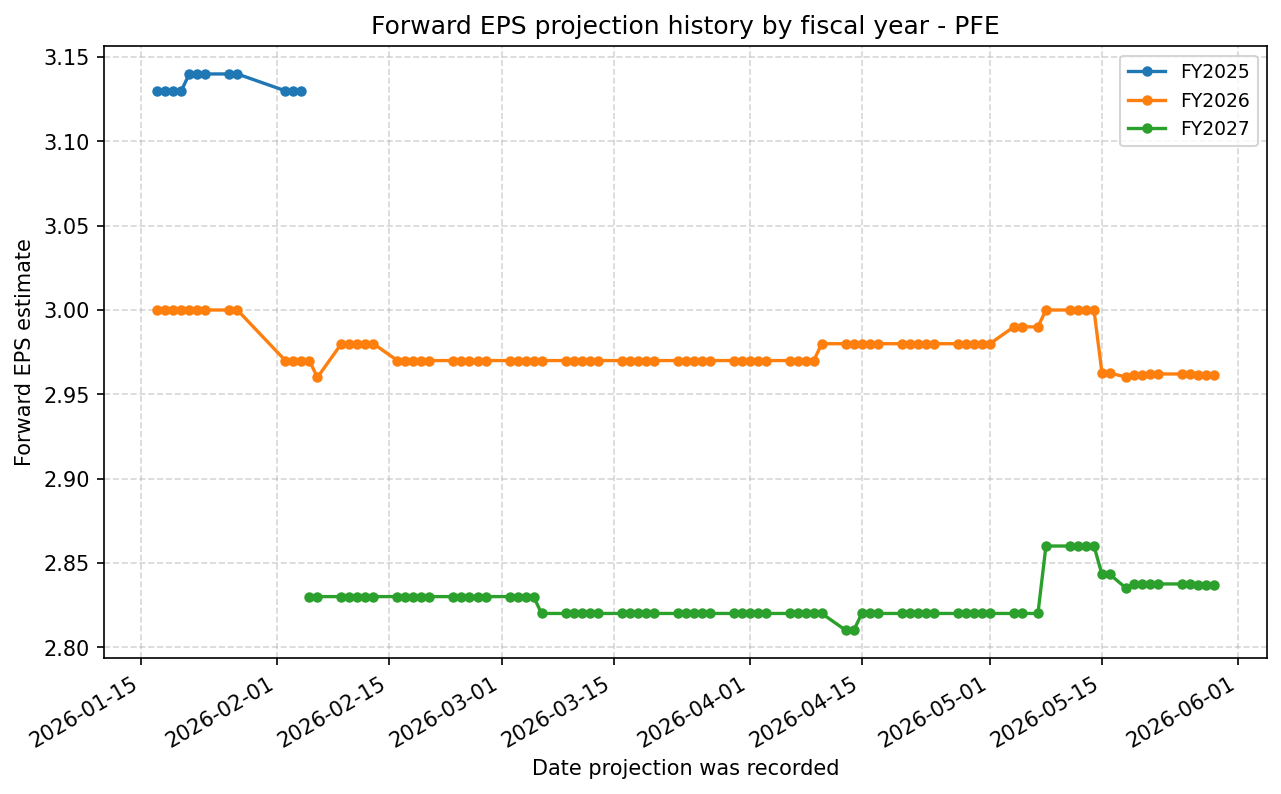
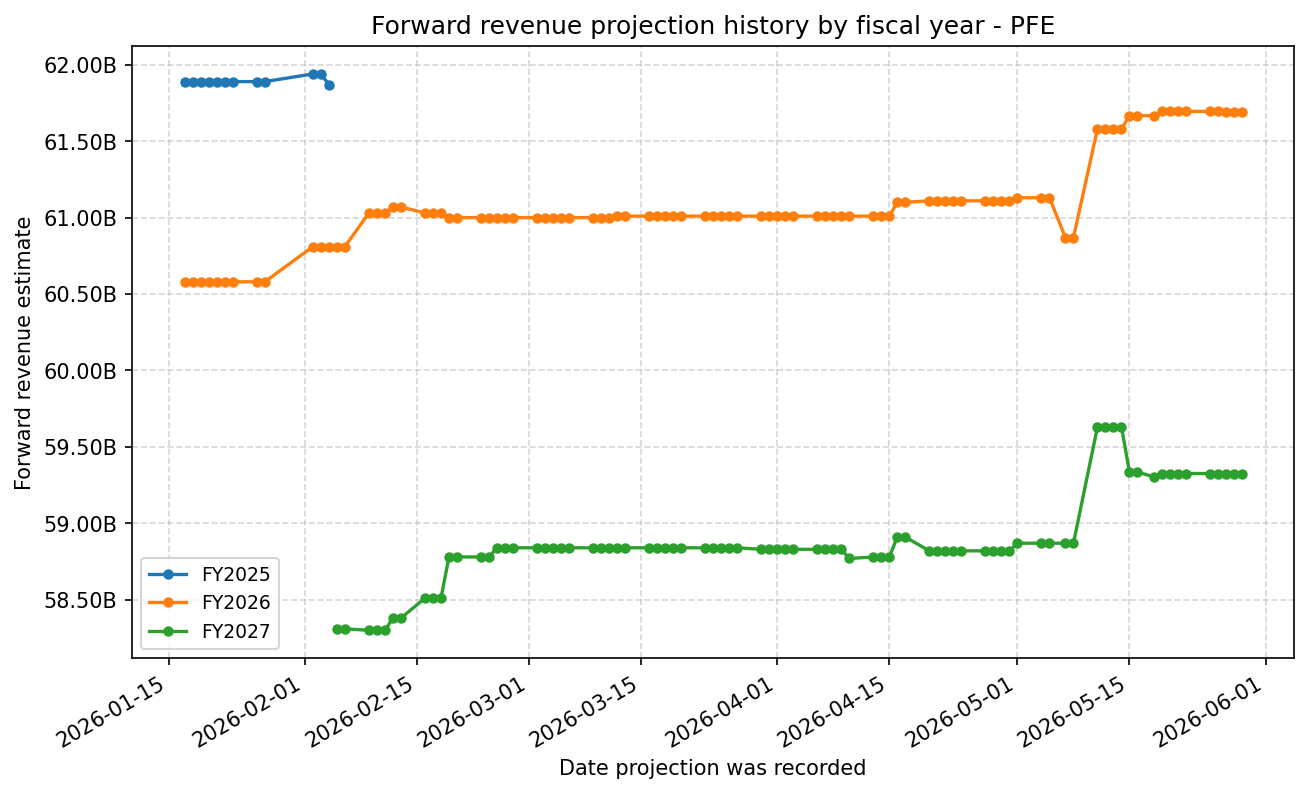
Forward Estimate History
How the next-FY EPS and revenue estimates have drifted over time. One line per fiscal year – past lines end when that FY became current.
Expenses
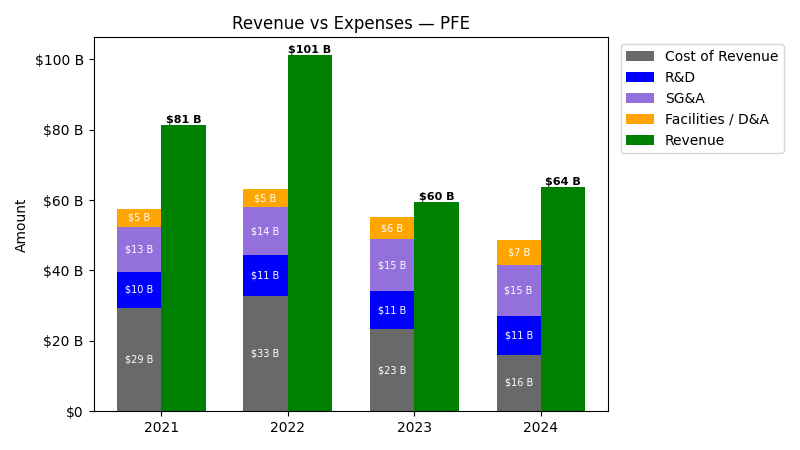
| Year | Revenue ($) | Cost of Revenue ($) | R&D ($) | SG&A ($) | Facilities / D&A ($) |
|---|---|---|---|---|---|
| 2022 | $101.2B | $27.8B | $12.4B | $13.7B | $5.1B |
| 2023 | $59.6B | $17.1B | $10.9B | $14.8B | $6.3B |
| 2024 | $63.6B | $9.1B | $10.9B | $14.7B | $7.0B |
| 2025 | $62.6B | $7.8B | $12.1B | $13.8B | $6.6B |
| TTM | $63.3B | $8.4B | $12.5B | $13.7B | $6.6B |
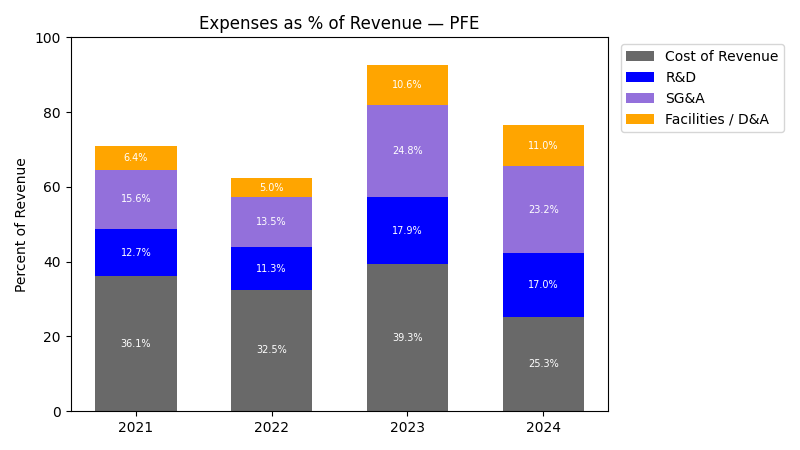
| Year | Revenue Change (%) | Cost of Revenue Change (%) | R&D Change (%) | SG&A Change (%) | Facilities / D&A Change (%) |
|---|---|---|---|---|---|
| 2023 | -41.14 | -38.52 | -12.18 | 8.00 | 24.21 |
| 2024 | 6.84 | -46.74 | 0.52 | -0.28 | 11.49 |
| 2025 | -1.65 | -14.86 | 10.25 | -6.35 | -6.00 |
| TTM | 1.17 | 8.84 | 3.44 | -0.51 | -0.08 |
No unmapped expenses.
Segment Performance
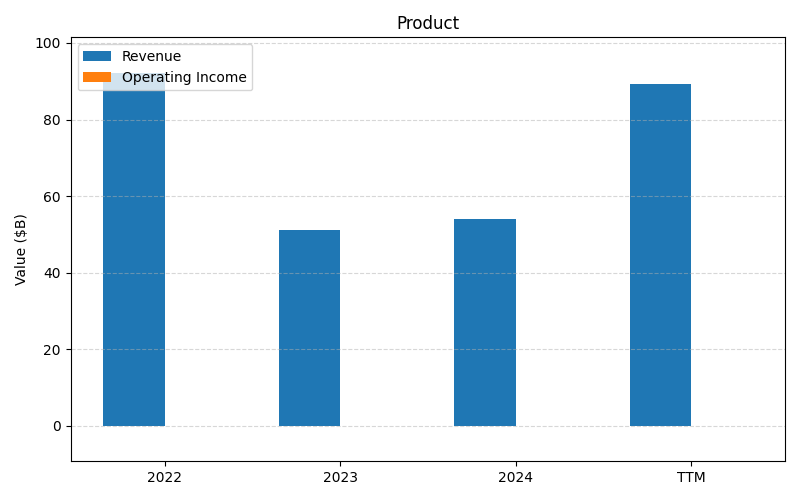
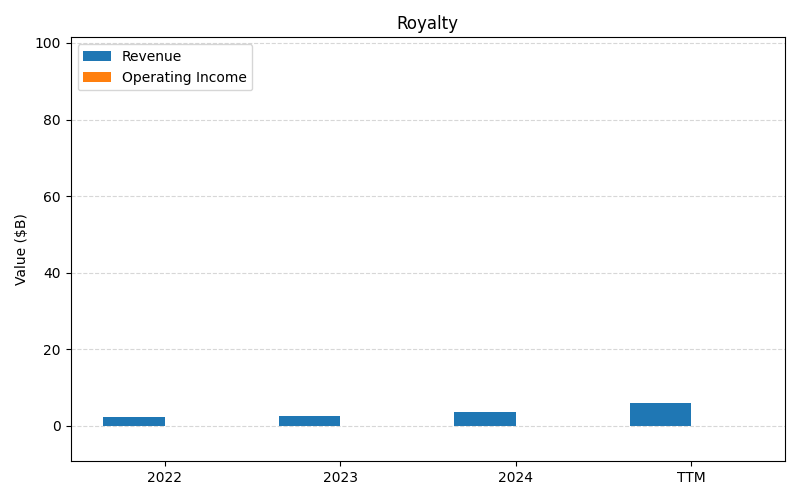
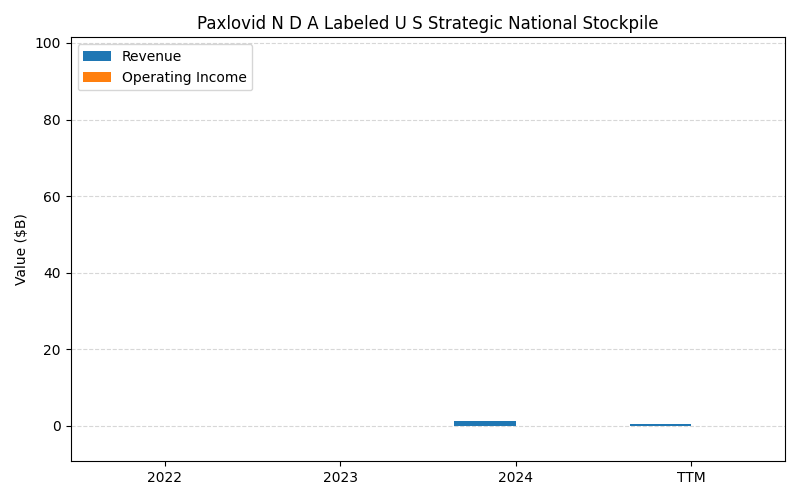
SEGMENTS v2025-09-09 · 2026-05-29 09:13 UTC — Units: $B. Rows list fiscal years (last 3 + TTM) with revenue for each segment; the final row shows the TTM revenue mix (operating income columns display “—” where mix is not applicable).
| Year | Prod Rev | Royalty Rev | Paxlovid N D A Labeled U S Strategic National Stockpile Rev | Total Rev |
|---|---|---|---|---|
| 2023 | 51.1B | 2.72B | – | 53.8B |
| 2024 | 54B | 3.77B | 0.88B | 58.6B |
| 2025 | 51.8B | 4.43B | – | 56.2B |
| TTM | 128.8B | 9.61B | – | 138.4B |
| % of Total (TTM) | 93.1% | 6.9% | – | 100% |
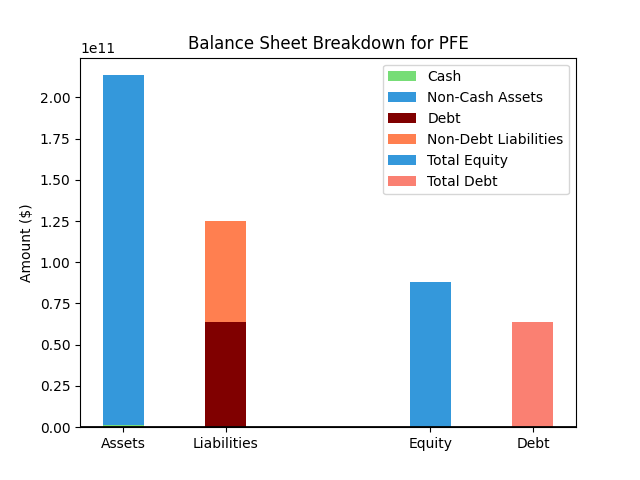
Balance Sheet
| Metric | Value | |
|---|---|---|
| 0 | Total Assets | $207,618M |
| 1 | Cash | $1,703M |
| 2 | Total Liabilities | $117,214M |
| 3 | Total Debt | $63,730M |
| 4 | Total Equity | $90,101M |
| 5 | Debt to Equity Ratio | 0.71 |
EPS & Dividend
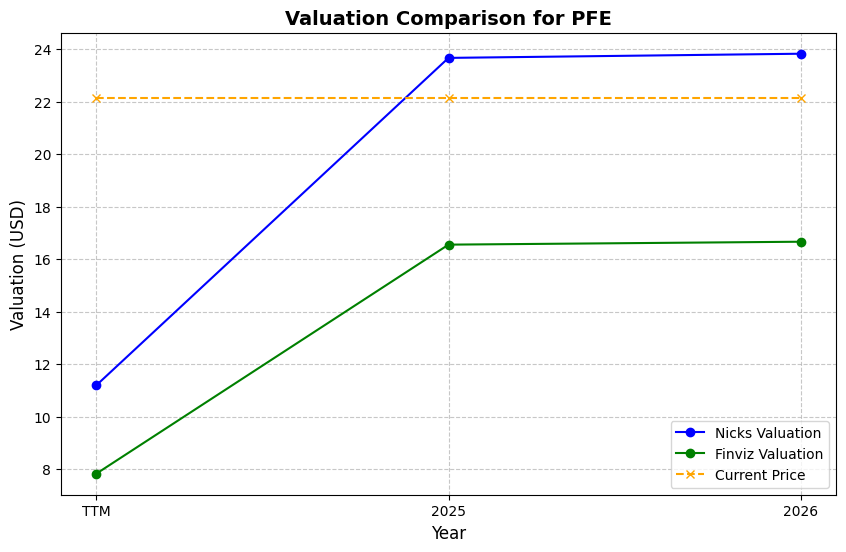
Valuation
| Share Price | Treasury Yield | Estimates | Fair Value (P/E) | Fair Value (P/S) | Current P/S | Current P/E |
|---|---|---|---|---|---|---|
| $26.18 | 4.5% | Nicks Growth: 2% Nick's Expected Margin: 10% FINVIZ Growth: -9% |
Nicks: 8 Finviz: 2 |
Nick's: 0.780 | 2.4 | 20.0 |
| Basis | Year | Nicks Valuation | Nicks vs Share Price | Finviz Valuation | Finviz vs Share Price |
|---|---|---|---|---|---|
| $1.31 EPS | TTM | $10.22 | -61.0% | $3.11 | -88.1% |
| $2.96 EPS | 2026 | $23.10 | -11.8% | $7.03 | -73.1% |
| $2.84 EPS | 2027 | $22.13 | -15.5% | $6.74 | -74.3% |
Implied Growth
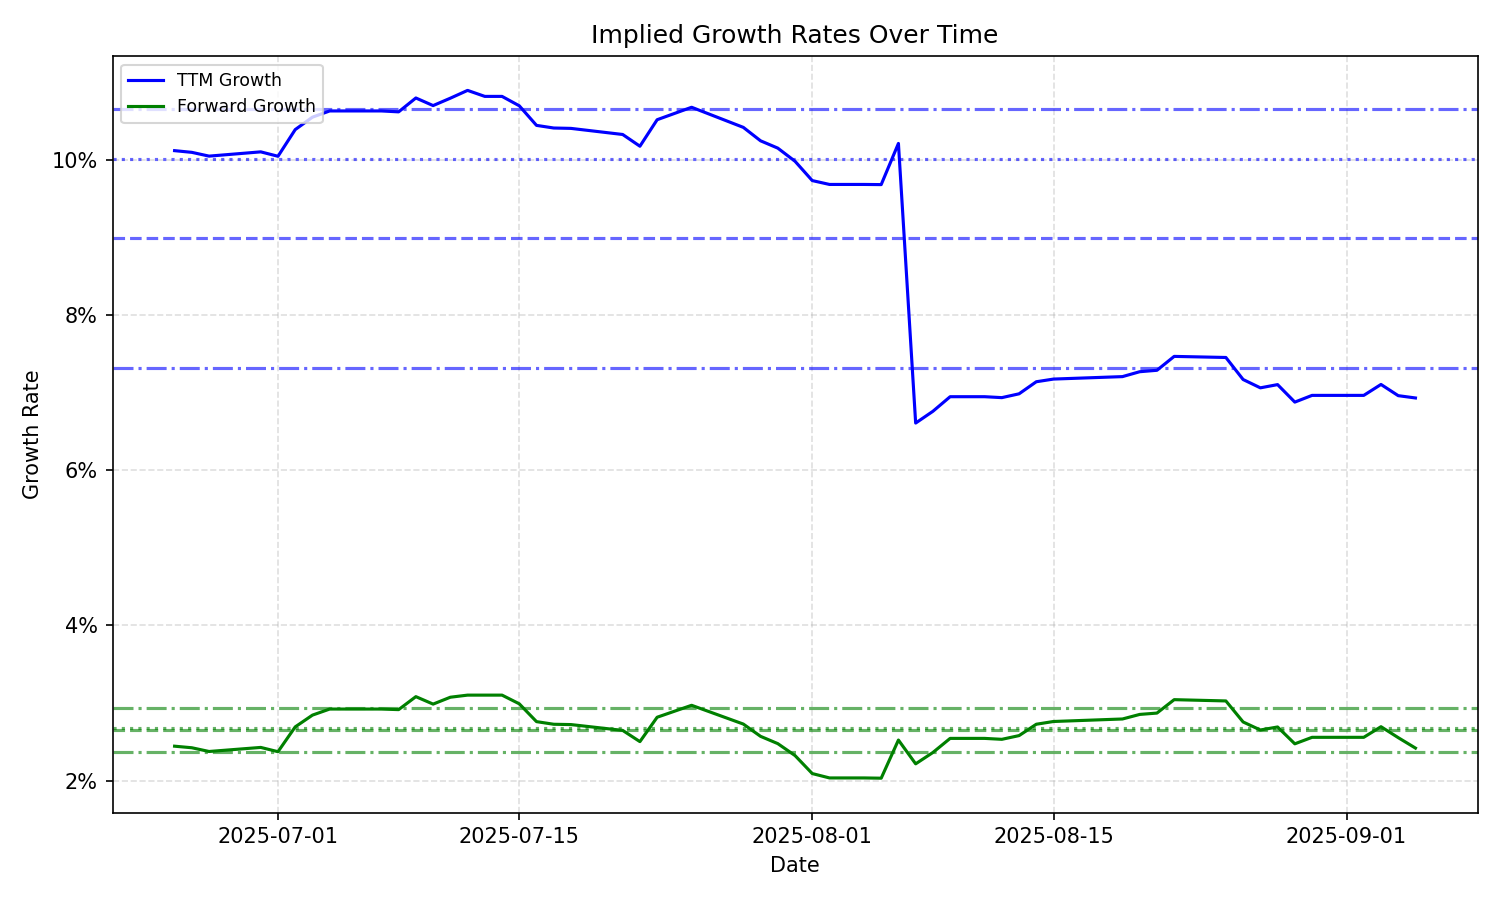
| Average | Median | Std Dev | Current | Percentile | ||||||
|---|---|---|---|---|---|---|---|---|---|---|
| TTM | Forward | TTM | Forward | TTM | Forward | TTM | Forward | TTM | Forward | |
| Timeframe | ||||||||||
| 1 Year | 9.16% | 2.97% | 8.33% | 2.75% | 1.96% | 0.65% | 11.61% | 3.64% | 94.2% | 76.0% |
| 3 Years | 9.16% | 2.97% | 8.33% | 2.75% | 1.96% | 0.65% | 11.61% | 3.64% | 94.2% | 76.0% |
| 5 Years | 9.16% | 2.97% | 8.33% | 2.75% | 1.96% | 0.65% | 11.61% | 3.64% | 94.2% | 76.0% |
| 10 Years | 9.16% | 2.97% | 8.33% | 2.75% | 1.96% | 0.65% | 11.61% | 3.64% | 94.2% | 76.0% |