Perion Network Ltd — PERI
| Close Price | Market Cap | P/E Ratio | Forward P/E Ratio | Implied Growth* | Implied Forward Growth* | Dividend | P/B Ratio |
|---|---|---|---|---|---|---|---|
| $8.49 | $350.66M | - | 6.5 | N/A | 0.3% | - | 0.5 |
Latest Headlines
- · Perion Network Ltd. (NASDAQ:PERI) Just Reported Earnings, And Analysts Cut Their Target Price
- · Perion Network (PERI) Q1 Earnings: How Key Metrics Compare to Wall Street Estimates
- · Perion Network Ltd (PERI) Q1 2026 Earnings Call Highlights: Strong AI Growth Amid Macroeconomic ...
- · Why Perion Network Stock Was Falling Today
- · Perion (PERI) Q1 2026 Earnings Transcript
- · Perion Network Q1 Earnings Call Highlights
Revenue & Net Income
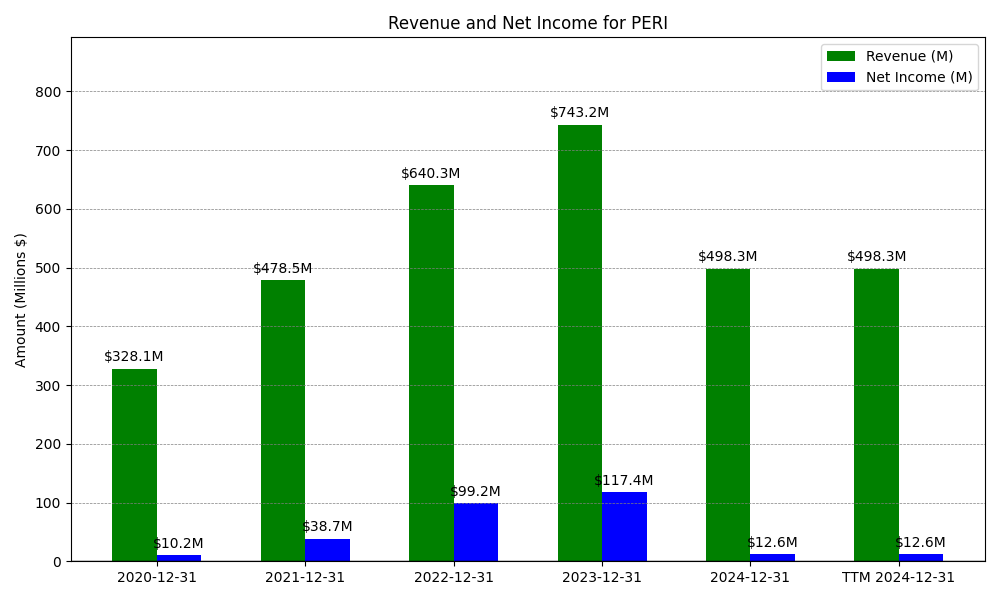
| Date | Revenue | Net_Income | EPS | Last_Updated | Revenue_Change | Net_Income_Change | EPS_Change | |
|---|---|---|---|---|---|---|---|---|
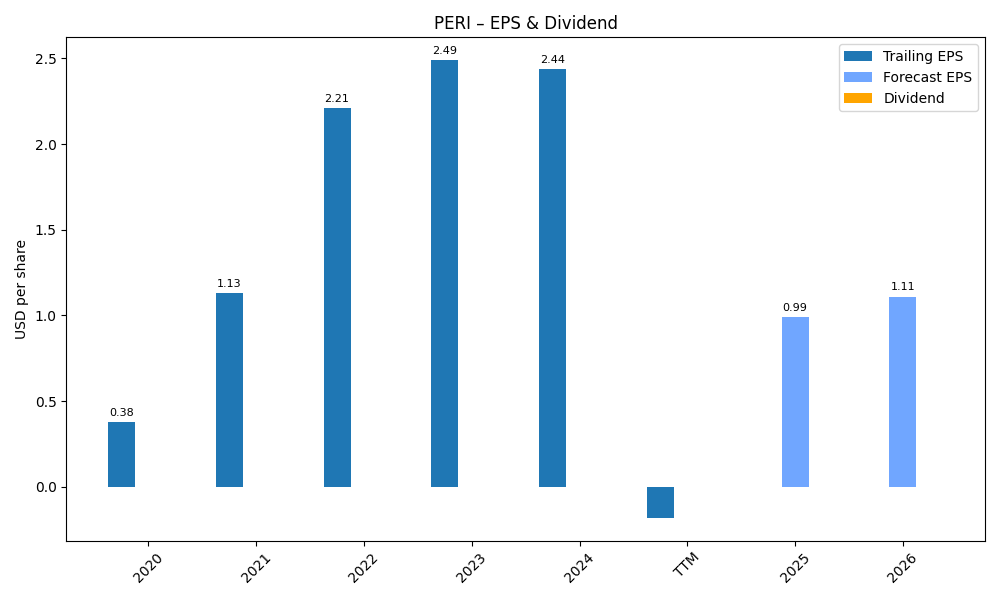
| 0 | 2020-12-31 | $328M | $10M | $0.38 | 2024-03-30 02:04:47 | N/A | N/A | N/A |
| 1 | 2021-12-31 | $640M | $97M | $1.13 | 2026-05-20 09:12:12 | 95.2% | 853.3% | 197.4% |
| 2 | 2022-12-31 | $640M | $97M | $2.21 | 2026-05-29 09:13:22 | 0.0% | 0.0% | 95.6% |
| 3 | 2023-12-31 | $743M | $115M | $2.49 | 2026-05-29 09:13:22 | 16.1% | 17.9% | 12.7% |
| 4 | 2024-12-31 | $498M | $13M | $0.27 | 2026-05-29 09:13:22 | -32.9% | -89.0% | -89.2% |
| 5 | 2025-12-31 | $440M | $-8M | $-0.19 | 2026-05-29 09:13:22 | -11.7% | -162.9% | -170.4% |
| 6 | TTM 2026-03-31 | $441M | $-10M | $-0.26 | 2026-05-21 09:12:46 | 0.2% | 20.9% | 36.8% |
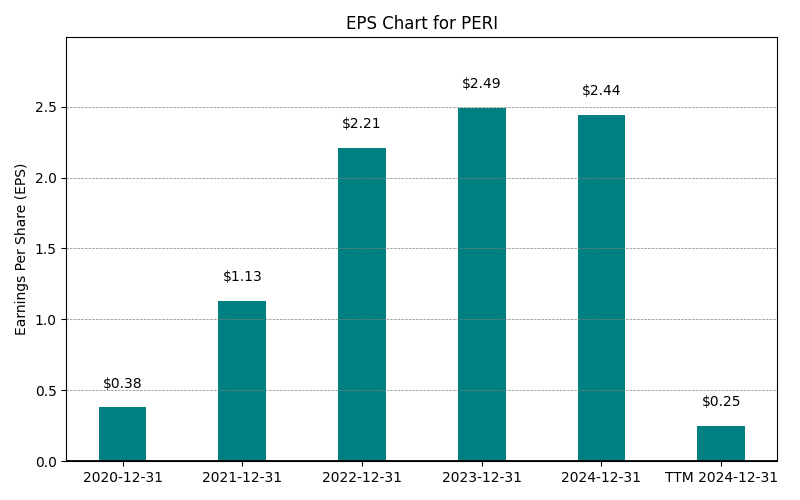
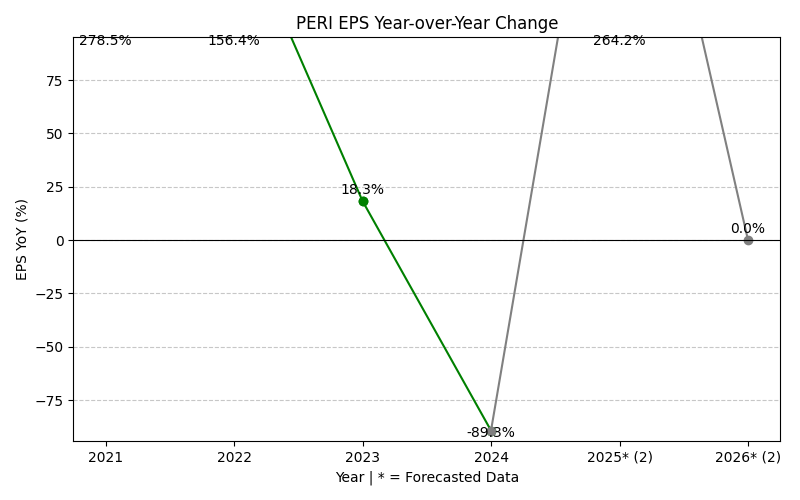
EPS
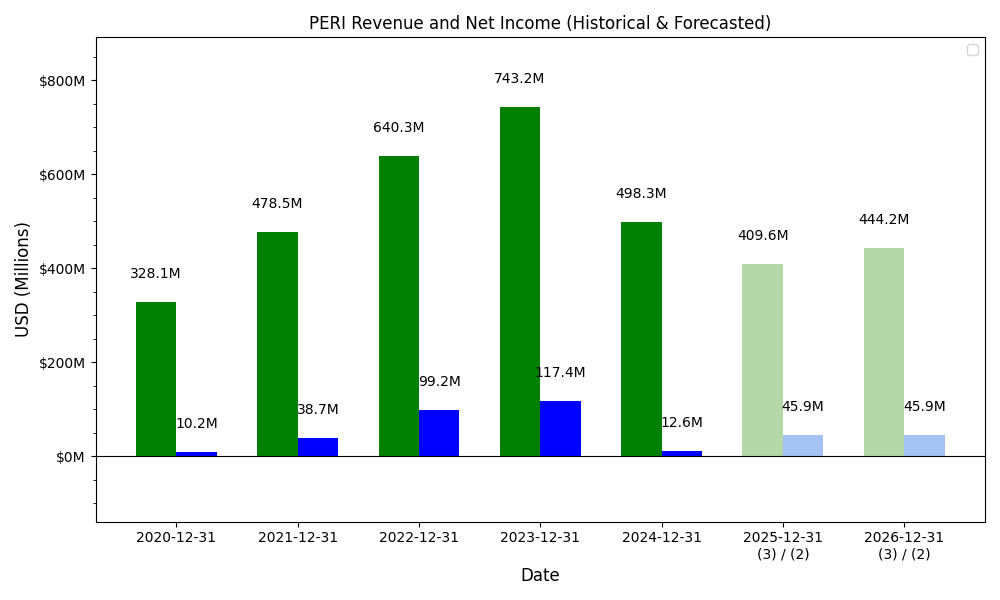
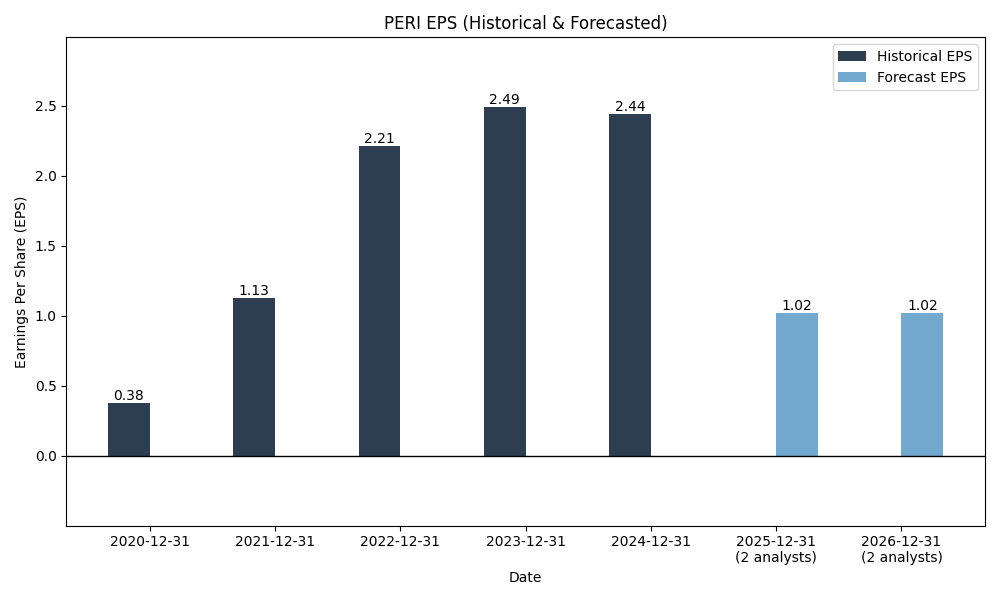
Forecasts
Y/Y % Change
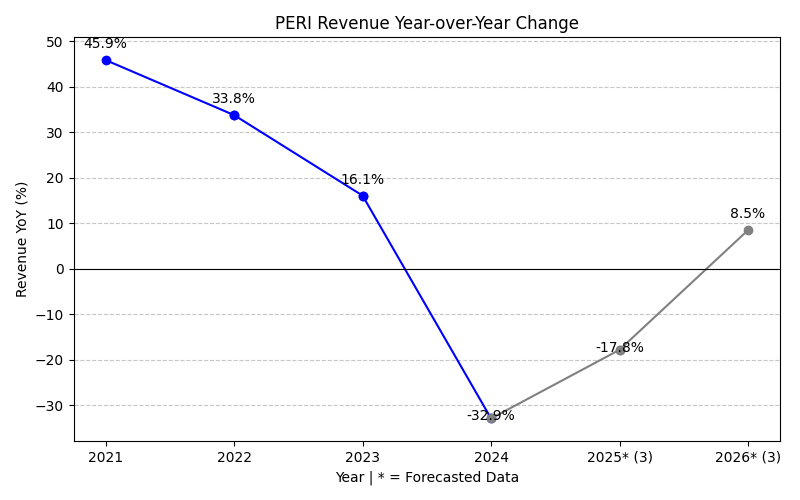
PERI Year-over-Year Growth
| 2020 | 2021 | 2022 | 2023 | 2024 | 2025 | 2026 | 2027 | Average | |
|---|---|---|---|---|---|---|---|---|---|
| Revenue Growth (%) | 95.2% | 0.0% | 16.1% | -32.9% | -11.7% | 5.3% | 10.5% | 11.8% | |
| Revenue Analysts (#) | 0 | 0 | 0 | 0 | 0 | 0 | 6 | 6 | |
| EPS Growth (%) | 853.3% | 0.0% | 17.9% | -89.0% | -162.9% | -711.8% | 10.9% | -11.7% | |
| EPS Analysts (#) | 0 | 0 | 0 | 0 | 0 | 0 | 4 | 4 |
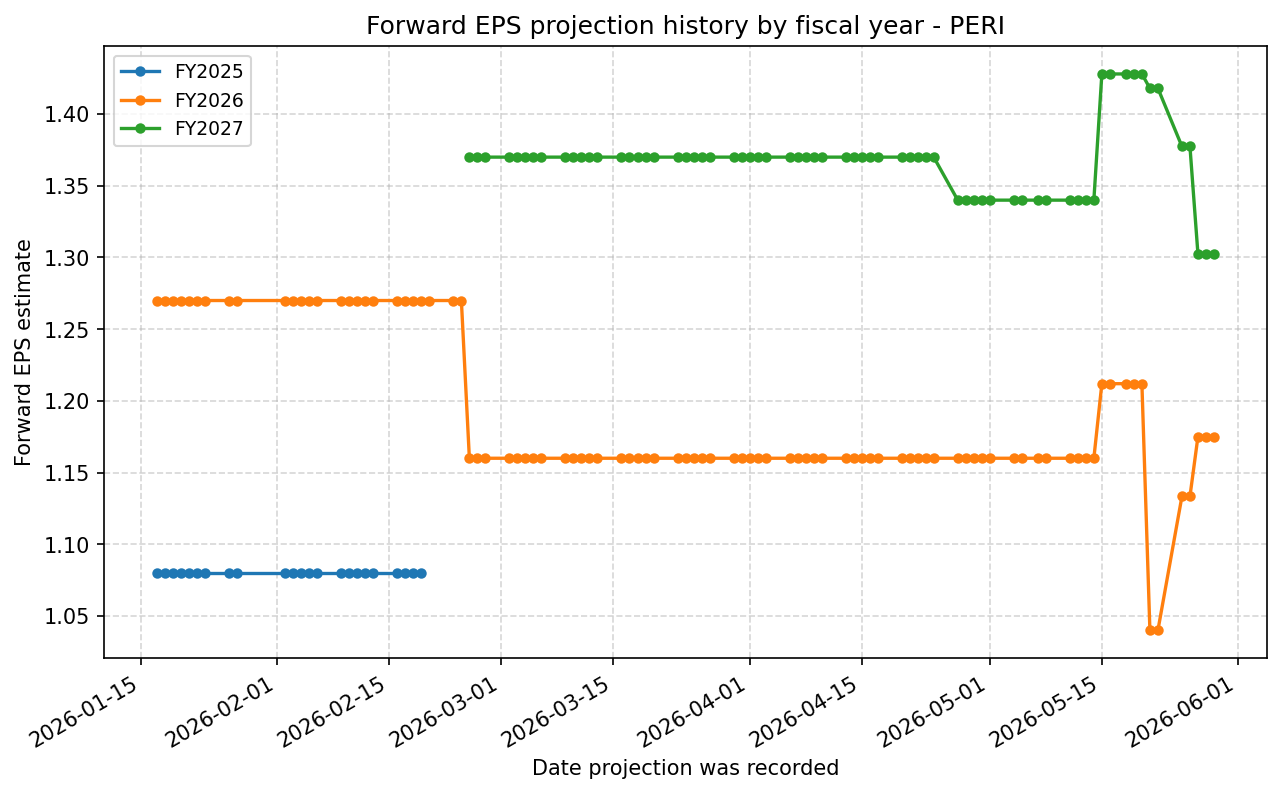
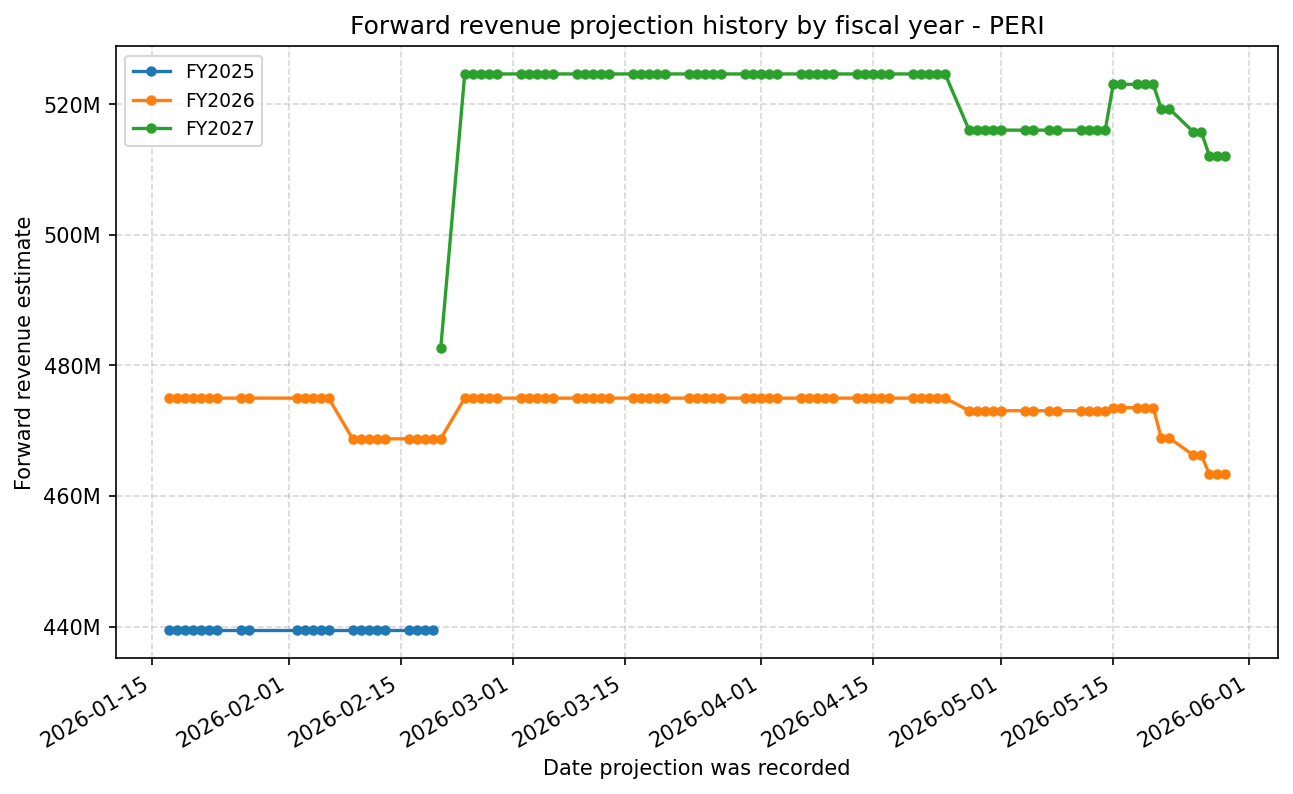
Forward Estimate History
How the next-FY EPS and revenue estimates have drifted over time. One line per fiscal year – past lines end when that FY became current.
Expenses
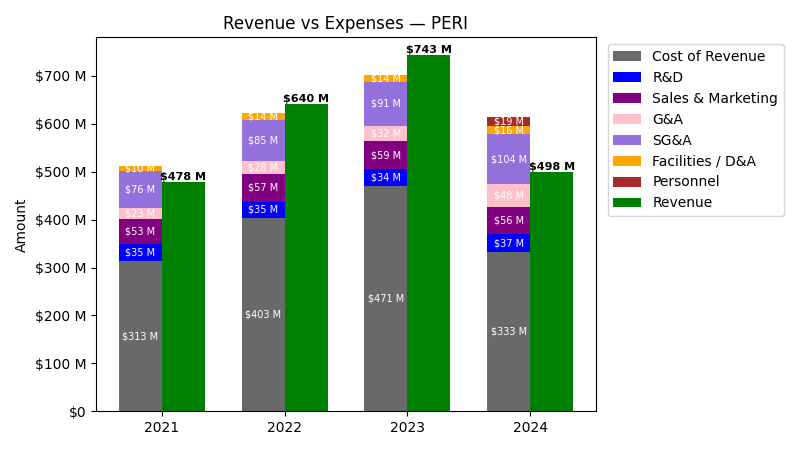
| Year | Revenue ($) | Cost of Revenue ($) | R&D ($) | Sales & Marketing ($) | G&A ($) | SG&A ($) | Facilities / D&A ($) | Personnel ($) |
|---|---|---|---|---|---|---|---|---|
| 2022 | $640.3M | $389.2M | $34.6M | $57.4M | $27.7M | $85.2M | $13.8M | $0.0 |
| 2023 | $743.2M | $456.7M | $33.9M | $59.3M | $32.1M | $91.4M | $14.1M | $0.0 |
| 2024 | $498.3M | $316.2M | $36.7M | $68.5M | $38.7M | $107.2M | $16.4M | $19.0M |
| 2025 | $439.9M | $270.6M | $34.7M | $76.5M | $36.4M | $112.9M | $17.7M | $0.0 |
| TTM | $441.0M | $270.2M | $33.1M | $80.1M | $36.4M | $116.6M | $19.1M | $0.0 |
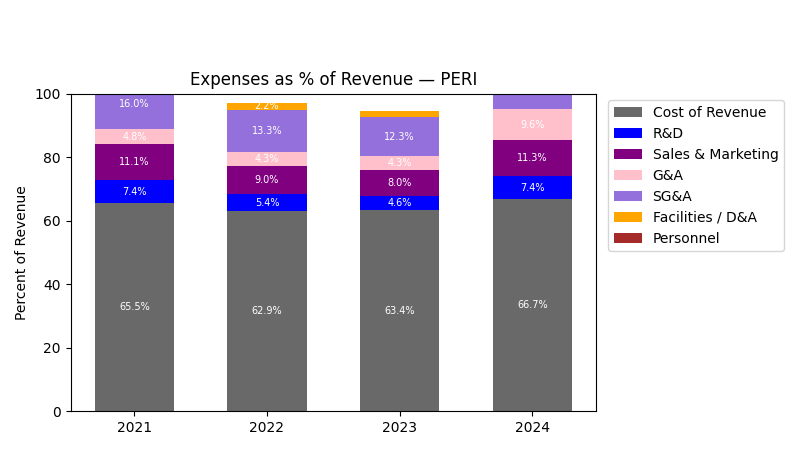
| Year | Revenue Change (%) | Cost of Revenue Change (%) | R&D Change (%) | Sales & Marketing Change (%) | G&A Change (%) | SG&A Change (%) | Facilities / D&A Change (%) | Personnel Change (%) |
|---|---|---|---|---|---|---|---|---|
| 2023 | 16.07 | 17.36 | -2.14 | 3.29 | 15.56 | 7.29 | 1.84 | NaN |
| 2024 | -32.95 | -30.77 | 8.19 | 15.43 | 20.69 | 17.28 | 16.62 | inf |
| 2025 | -11.71 | -14.41 | -5.46 | 11.67 | -5.93 | 5.32 | 7.56 | -100.0 |
| TTM | 0.23 | -0.16 | -4.34 | 4.76 | 0.09 | 3.25 | 8.08 | NaN |
No unmapped expenses.
Balance Sheet
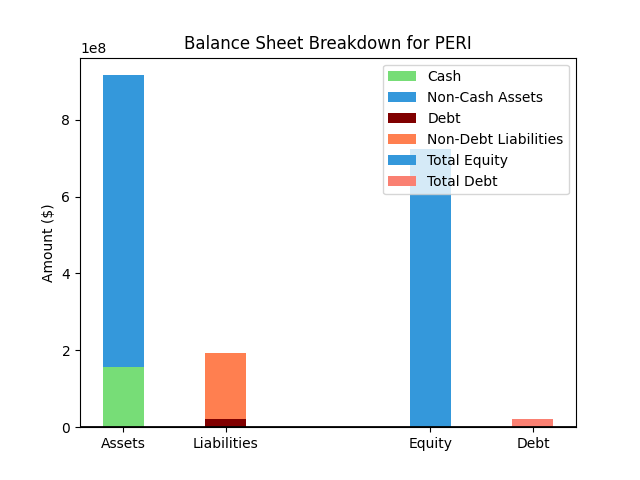
| Metric | Value | |
|---|---|---|
| 0 | Total Assets | $866M |
| 1 | Cash | $52M |
| 2 | Total Liabilities | $217M |
| 3 | Total Debt | $21M |
| 4 | Total Equity | $650M |
| 5 | Debt to Equity Ratio | 0.03 |
EPS & Dividend
Valuation
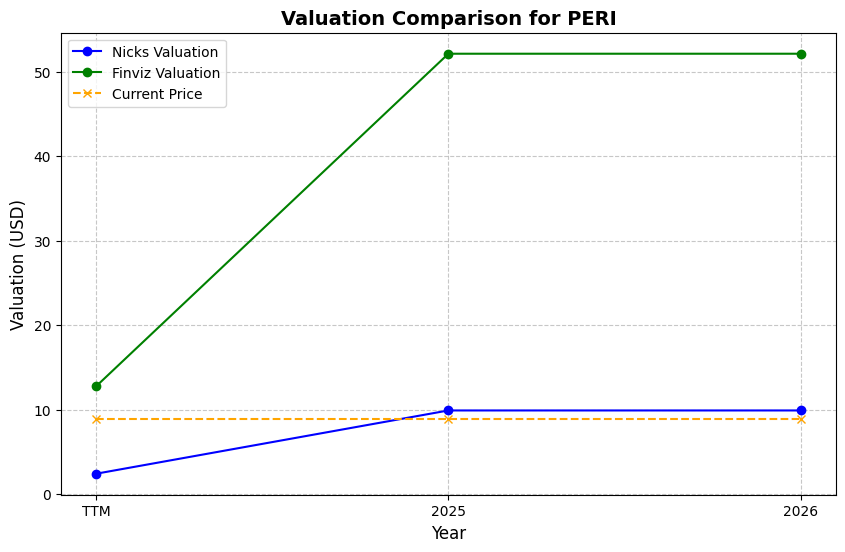
| Share Price | Treasury Yield | Estimates | Fair Value (P/E) | Fair Value (P/S) | Current P/S | Current P/E |
|---|---|---|---|---|---|---|
| $8.49 | 4.5% | Nicks Growth: 4% Nick's Expected Margin: 15% FINVIZ Growth: 6% |
Nicks: 10 Finviz: 12 |
Nick's: 1.433 | 0.8 | - |
| Basis | Year | Nicks Valuation | Nicks vs Share Price | Finviz Valuation | Finviz vs Share Price |
|---|---|---|---|---|---|
| $10.68 Revenue | TTM | $15.30 | 80.3% | $18.99 | 123.6% |
| $1.18 EPS | 2026 | $11.23 | 32.3% | $13.93 | 64.1% |
| $1.30 EPS | 2027 | $12.45 | 46.6% | $15.44 | 81.9% |
Implied Growth
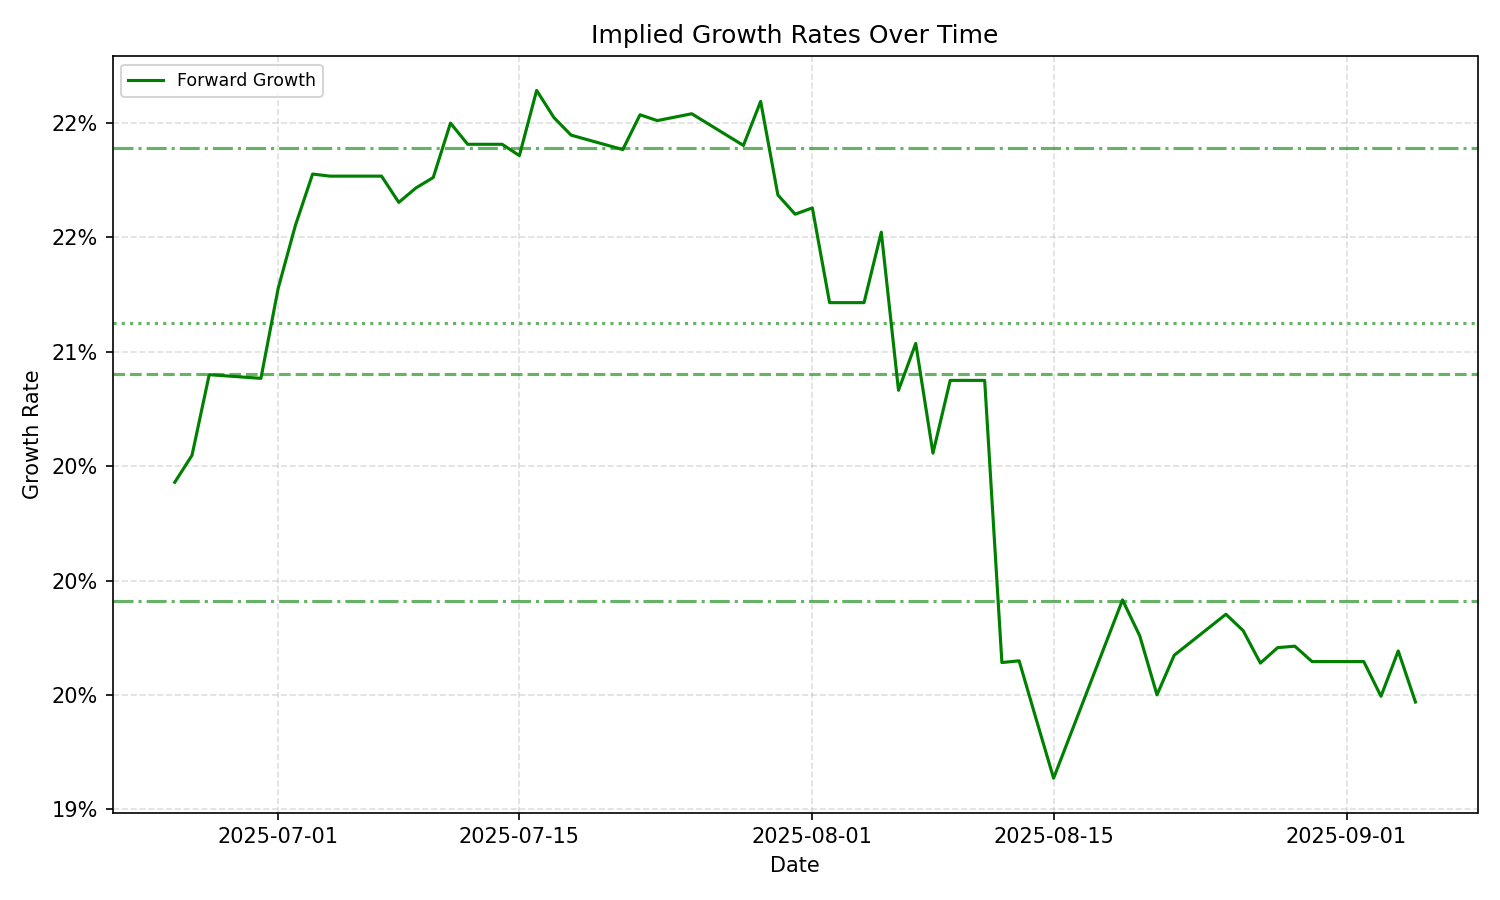
| Average | Median | Std Dev | Current | Percentile | ||||||
|---|---|---|---|---|---|---|---|---|---|---|
| TTM | Forward | TTM | Forward | TTM | Forward | TTM | Forward | TTM | Forward | |
| Timeframe | ||||||||||
| 1 Year | – | 15.02% | – | 19.73% | – | 8.63% | – | 0.24% | – | 1.6% |
| 3 Years | – | 15.02% | – | 19.73% | – | 8.63% | – | 0.24% | – | 1.6% |
| 5 Years | – | 15.02% | – | 19.73% | – | 8.63% | – | 0.24% | – | 1.6% |
| 10 Years | – | 15.02% | – | 19.73% | – | 8.63% | – | 0.24% | – | 1.6% |