PENN Entertainment, Inc. — PENN
| Close Price | Market Cap | P/E Ratio | Forward P/E Ratio | Implied Growth* | Implied Forward Growth* | Dividend | P/B Ratio |
|---|---|---|---|---|---|---|---|
| $18.83 | $2.52B | - | 11.4 | N/A | 5.8% | - | 1.3 |
Latest Headlines
- · 3 Stocks Under $50 with Warning Signs
- · Palidye Holdings Initiates PENN Entertainment Position, According to Recent SEC Filing
- · How Penn’s Penn Interactive Layoffs and Restructuring Will Impact PENN Entertainment (PENN) Investors
- · Gambling Layoffs Increase as Prediction Markets and AI Reshape Sports Betting
- · Pavilion Payments Appoints Kaiu Pettigrew as Chief Information Officer
- · REPLAY: Fireside Chat with Meridian Holdings Interim CEO, CFO & Meridianbet CEO
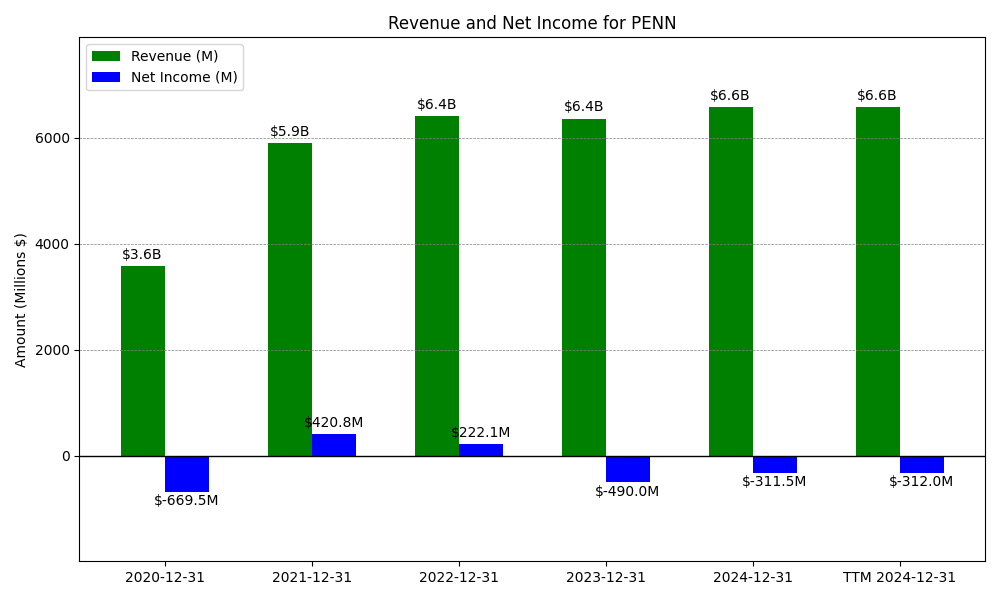
Revenue & Net Income
| Date | Revenue | Net_Income | EPS | Last_Updated | Revenue_Change | Net_Income_Change | EPS_Change | |
|---|---|---|---|---|---|---|---|---|
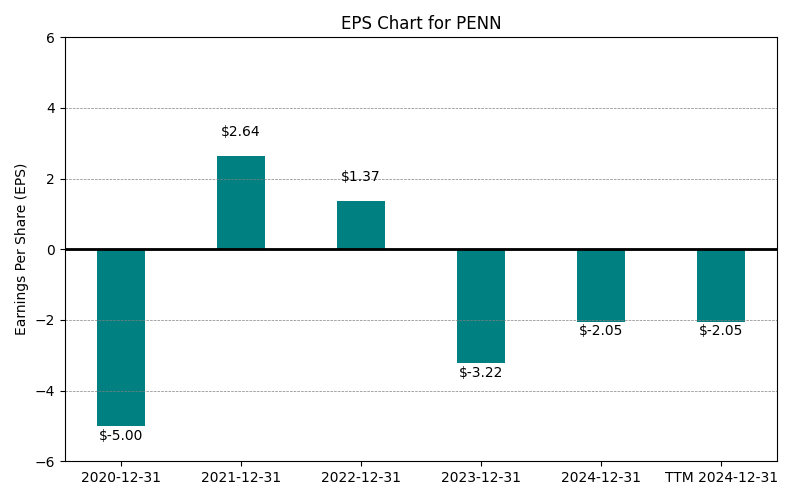
| 0 | 2020-12-31 | $3,579M | $-670M | $-5.00 | 2024-05-14 03:23:27 | N/A | N/A | N/A |
| 1 | 2021-12-31 | $5,905M | $421M | $2.64 | 2026-03-09 08:43:07 | 65.0% | -162.9% | -152.8% |
| 2 | 2022-12-31 | $6,402M | $222M | $1.37 | 2026-05-29 09:13:16 | 8.4% | -47.2% | -48.1% |
| 3 | 2023-12-31 | $6,363M | $-490M | $-3.22 | 2026-05-29 09:13:16 | -0.6% | -320.6% | -335.0% |
| 4 | 2024-12-31 | $6,578M | $-312M | $-2.05 | 2026-05-29 09:13:16 | 3.4% | -36.4% | -36.3% |
| 5 | 2025-12-31 | $6,961M | $-843M | $-5.83 | 2026-05-29 09:13:16 | 5.8% | 170.7% | 184.4% |
| 6 | TTM 2026-03-31 | $7,068M | $-957M | $-6.58 | 2026-04-24 08:48:43 | 1.5% | 13.5% | 12.9% |
EPS
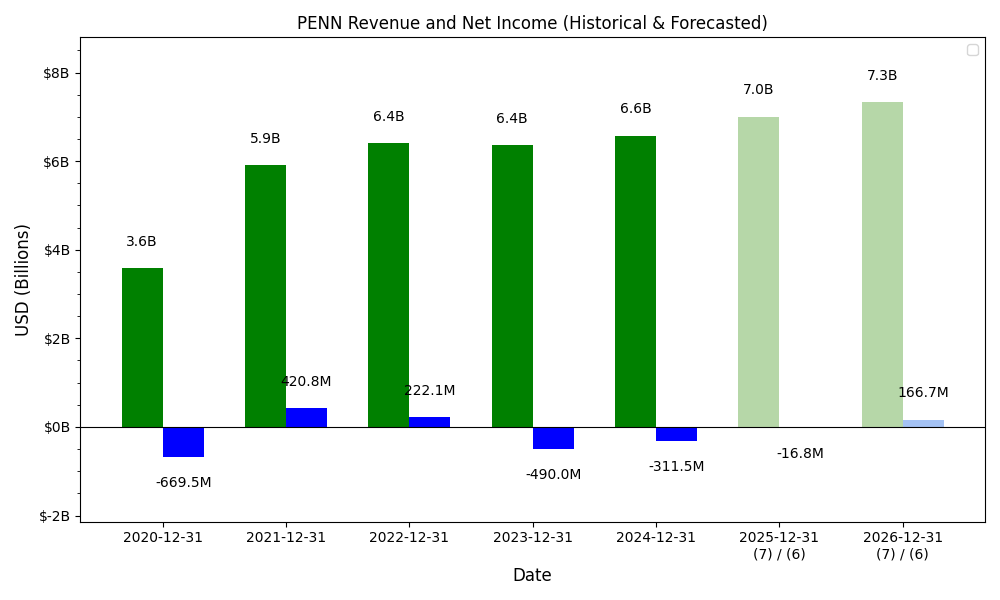
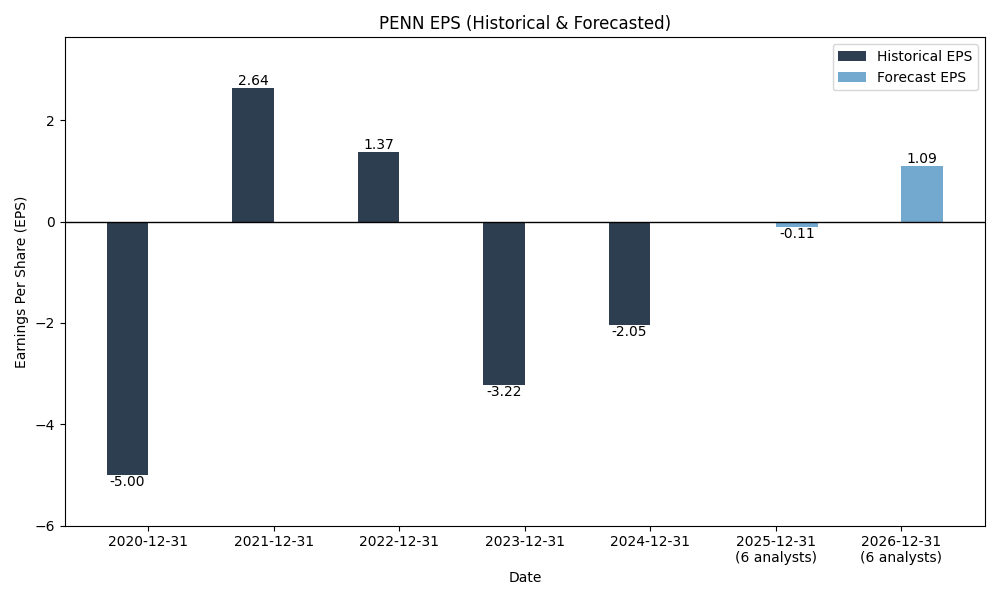
Forecasts
Y/Y % Change
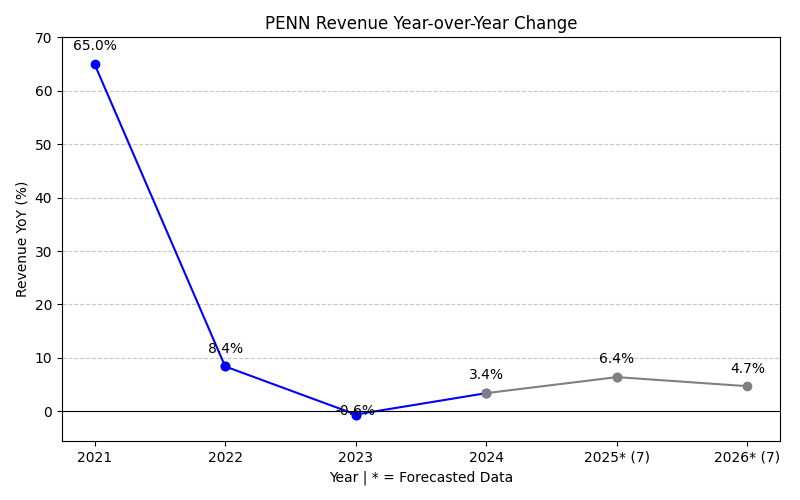
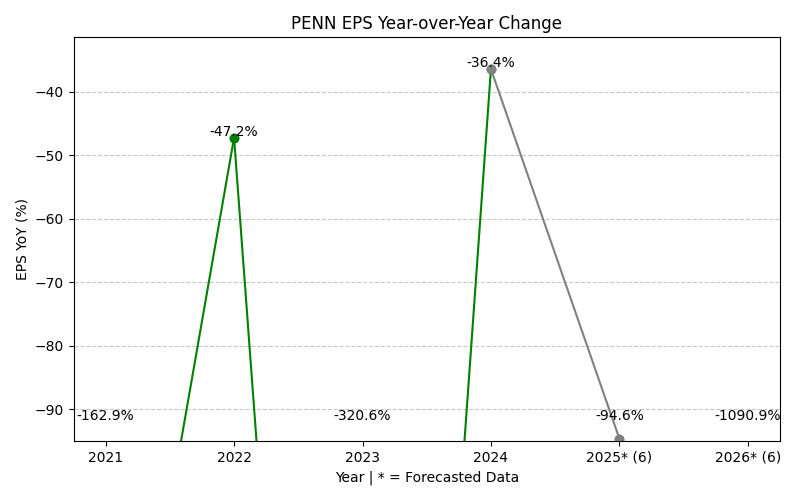
PENN Year-over-Year Growth
| 2020 | 2021 | 2022 | 2023 | 2024 | 2025 | 2026 | 2027 | Average | |
|---|---|---|---|---|---|---|---|---|---|
| Revenue Growth (%) | 65.0% | 8.4% | -0.6% | 3.4% | 5.8% | 5.5% | 4.2% | 13.1% | |
| Revenue Analysts (#) | 0 | 0 | 0 | 0 | 0 | 0 | 19 | 17 | |
| EPS Growth (%) | -162.9% | -47.2% | -320.6% | -36.4% | 170.7% | -115.6% | 68.4% | -63.4% | |
| EPS Analysts (#) | 0 | 0 | 0 | 0 | 0 | 0 | 6 | 6 |
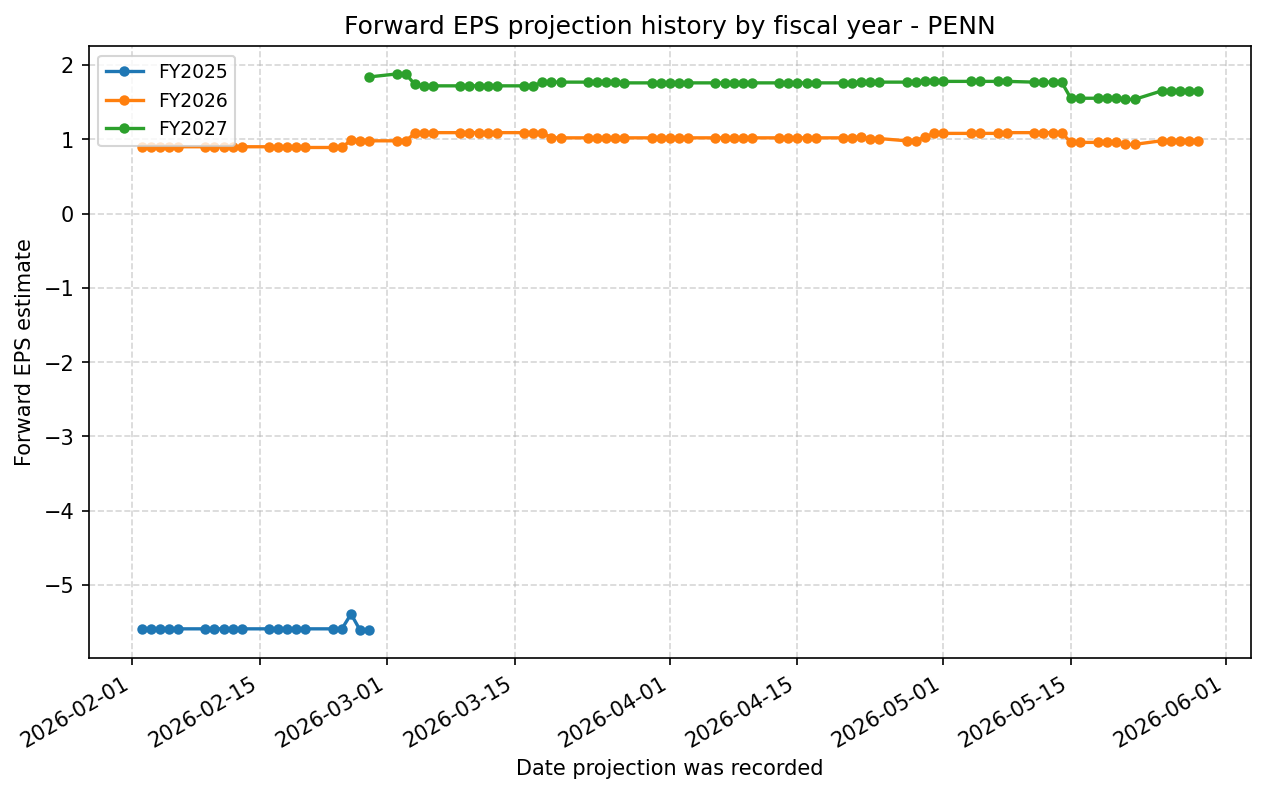
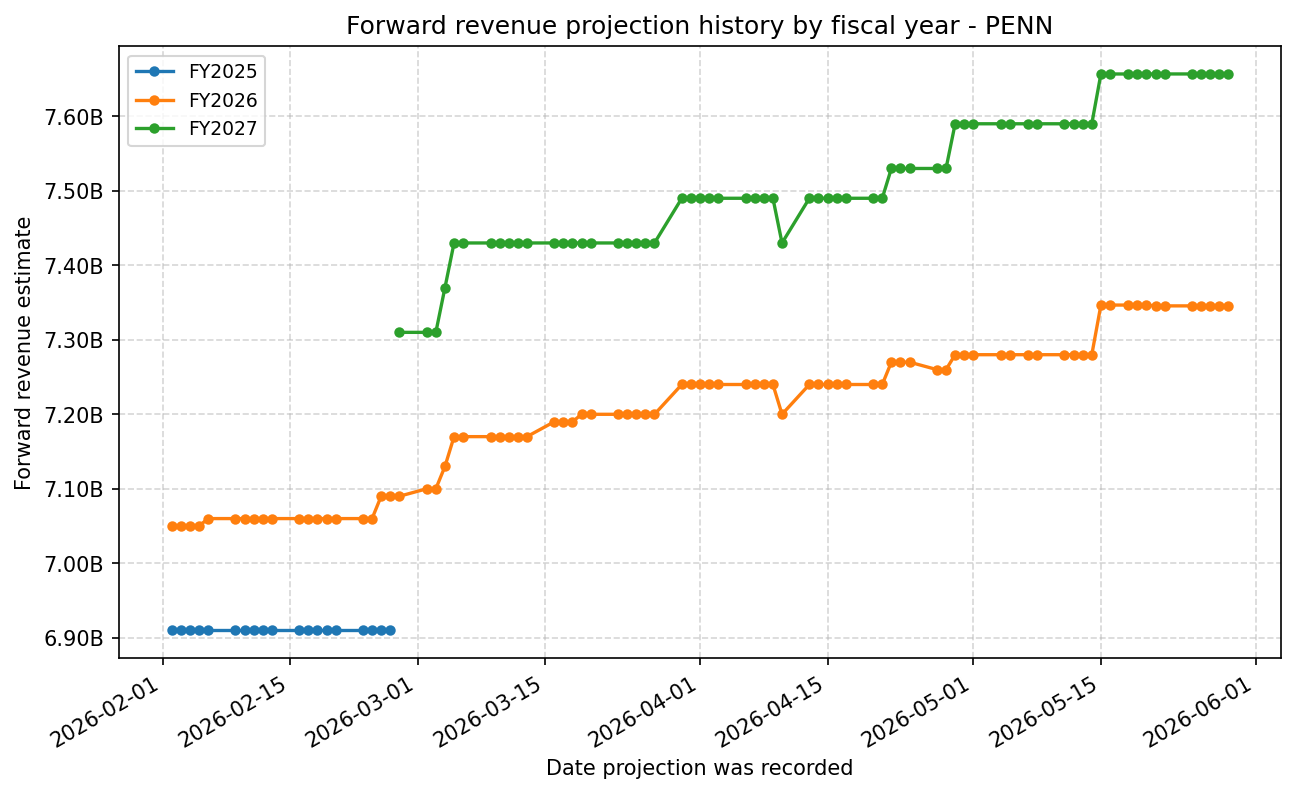
Forward Estimate History
How the next-FY EPS and revenue estimates have drifted over time. One line per fiscal year – past lines end when that FY became current.
Expenses
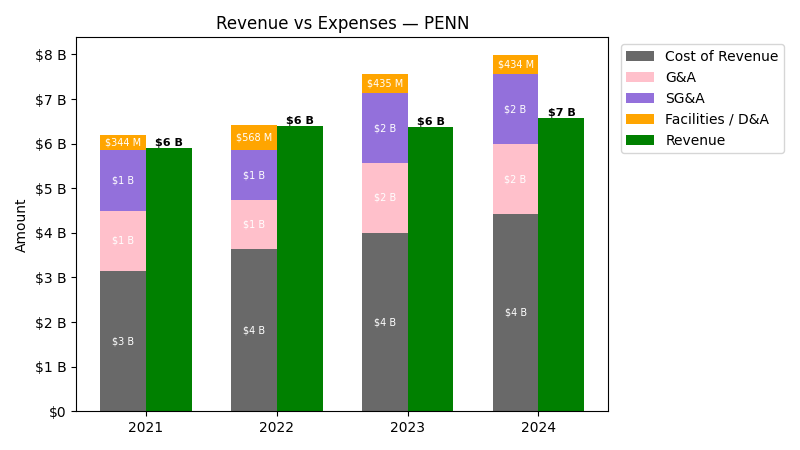
| Year | Revenue ($) | Cost of Revenue ($) | G&A ($) | SG&A ($) | Facilities / D&A ($) |
|---|---|---|---|---|---|
| 2022 | $6.4B | $3.1B | $1.1B | $1.1B | $567.5M |
| 2023 | $6.4B | $3.6B | $1.6B | $1.6B | $435.1M |
| 2024 | $6.6B | $4.0B | $1.6B | $1.6B | $433.6M |
| 2025 | $7.0B | $4.2B | $1.6B | $1.6B | $446.9M |
| TTM | $7.1B | $4.2B | $1.7B | $1.7B | $455.9M |
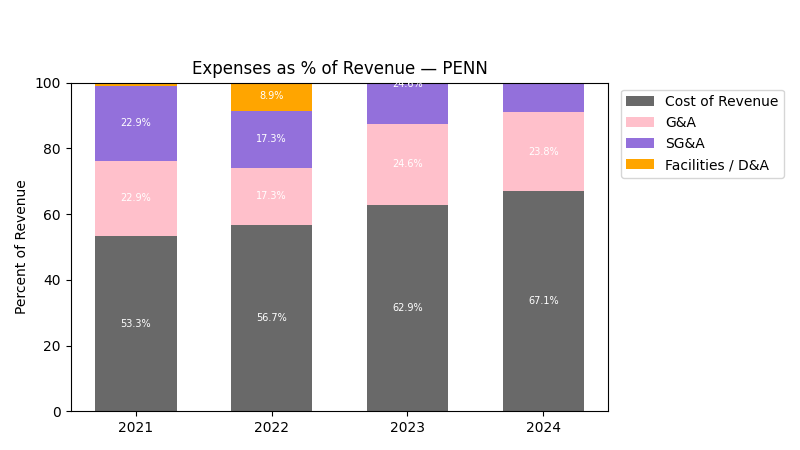
| Year | Revenue Change (%) | Cost of Revenue Change (%) | G&A Change (%) | SG&A Change (%) | Facilities / D&A Change (%) |
|---|---|---|---|---|---|
| 2023 | -0.61 | 16.37 | 40.80 | 40.80 | -23.33 |
| 2024 | 3.38 | 11.64 | 0.32 | 0.32 | -0.34 |
| 2025 | 5.82 | 4.54 | 4.17 | 4.17 | 3.07 |
| TTM | 1.53 | 0.23 | 1.51 | 1.51 | 2.01 |
No unmapped expenses.
Balance Sheet
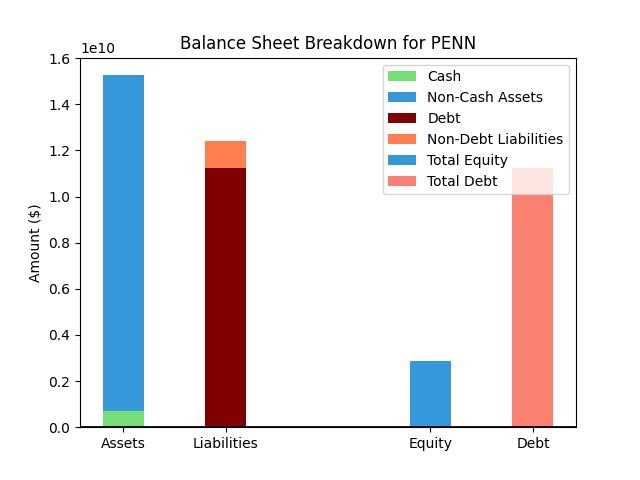
| Metric | Value | |
|---|---|---|
| 0 | Total Assets | $14,118M |
| 1 | Cash | $708M |
| 2 | Total Liabilities | $12,296M |
| 3 | Total Debt | $11,193M |
| 4 | Total Equity | $1,828M |
| 5 | Debt to Equity Ratio | 6.12 |
EPS & Dividend

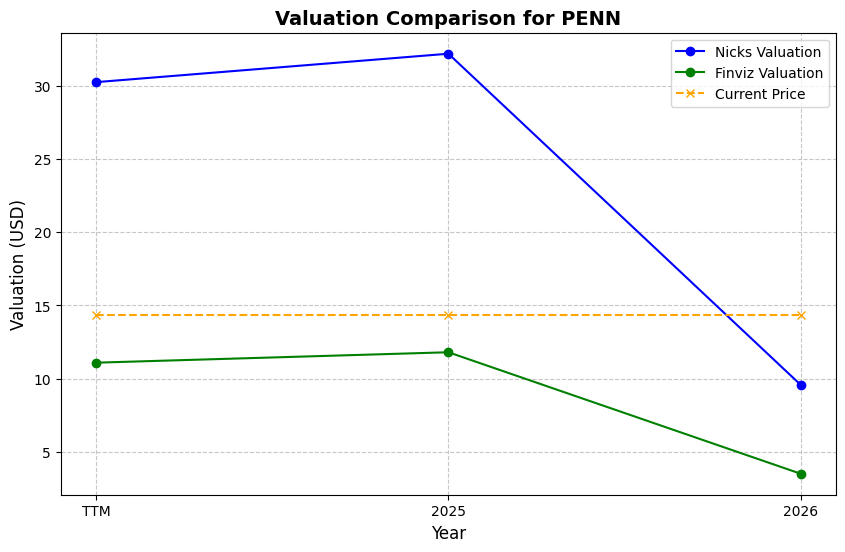
Valuation
| Share Price | Treasury Yield | Estimates | Fair Value (P/E) | Fair Value (P/S) | Current P/S | Current P/E |
|---|---|---|---|---|---|---|
| $18.83 | 4.5% | Nicks Growth: 3% Nick's Expected Margin: 8% FINVIZ Growth: -6% |
Nicks: 9 Finviz: 3 |
Nick's: 0.691 | 0.4 | - |
| Basis | Year | Nicks Valuation | Nicks vs Share Price | Finviz Valuation | Finviz vs Share Price |
|---|---|---|---|---|---|
| $52.81 Revenue | TTM | $36.49 | 93.8% | $13.36 | -29.0% |
| $0.98 EPS | 2026 | $8.48 | -55.0% | $3.10 | -83.5% |
| $1.65 EPS | 2027 | $14.28 | -24.2% | $5.23 | -72.2% |
Implied Growth
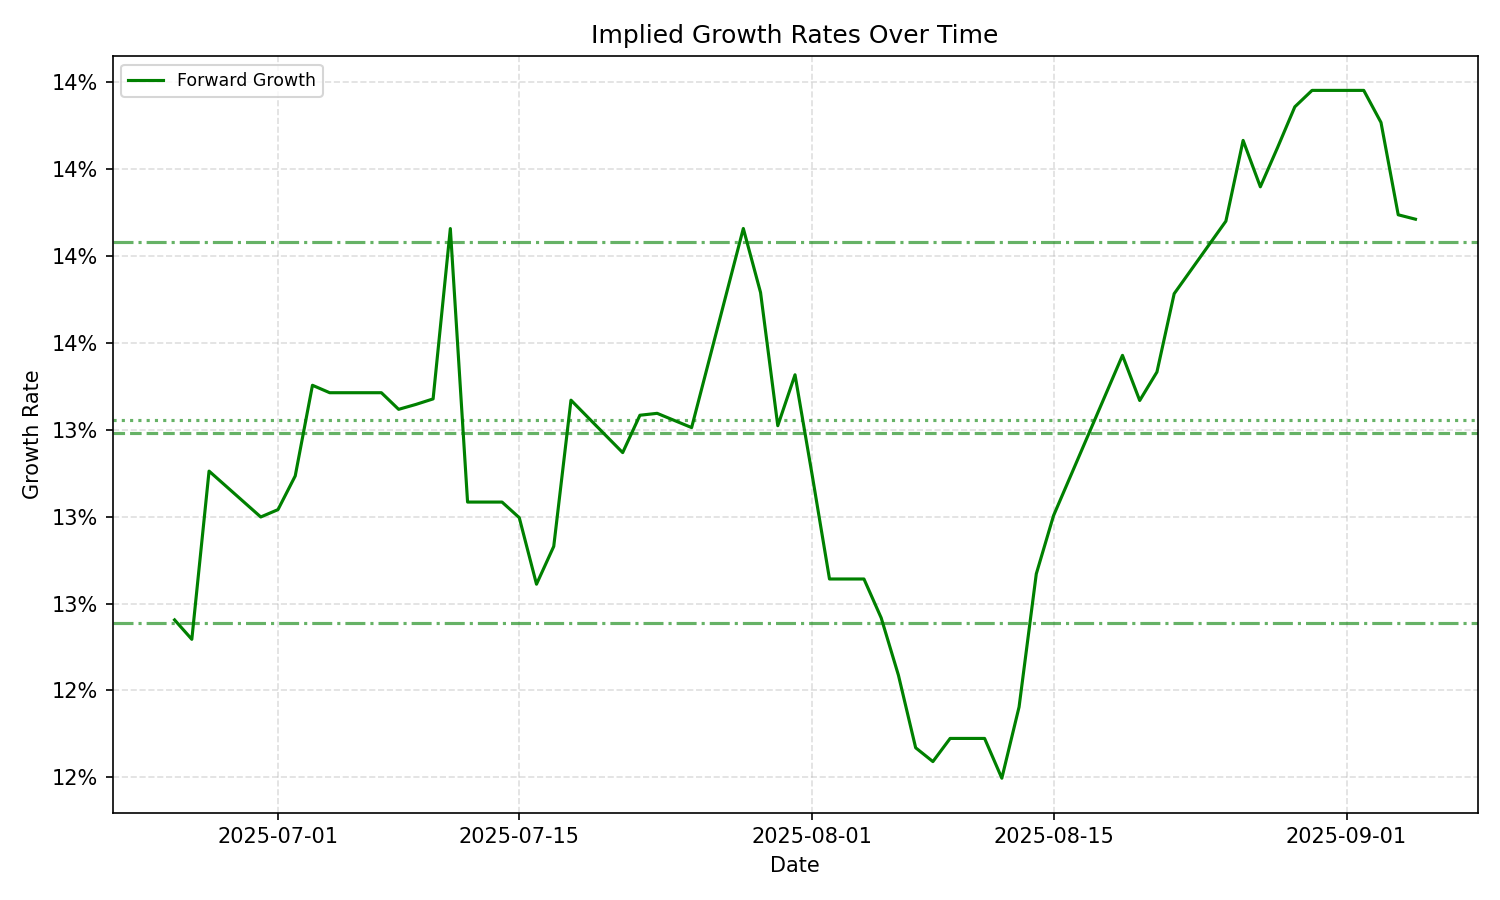
| Average | Median | Std Dev | Current | Percentile | ||||||
|---|---|---|---|---|---|---|---|---|---|---|
| TTM | Forward | TTM | Forward | TTM | Forward | TTM | Forward | TTM | Forward | |
| Timeframe | ||||||||||
| 1 Year | – | 11.58% | – | 12.36% | – | 2.53% | – | 6.09% | – | 9.0% |
| 3 Years | – | 11.58% | – | 12.36% | – | 2.53% | – | 6.09% | – | 9.0% |
| 5 Years | – | 11.58% | – | 12.36% | – | 2.53% | – | 6.09% | – | 9.0% |
| 10 Years | – | 11.58% | – | 12.36% | – | 2.53% | – | 6.09% | – | 9.0% |