Oracle Corporation — ORCL
| Close Price | Market Cap | P/E Ratio | Forward P/E Ratio | Implied Growth* | Implied Forward Growth* | Dividend | P/B Ratio |
|---|---|---|---|---|---|---|---|
| $225.78 | $649.35B | 40.6 | 28.1 | 19.5% | 15.3% | $2.00 0.9% | 19.4 |
Latest Headlines
- · Assessing Oracle (ORCL) Valuation After Strong Multi‑Month Share Price Momentum
- · Snowflake, Oracle, ServiceNow Stocks Rally As AI Trade Heats Up Again
- · Why Is The US Stock Market Up Today?
- · Prediction: AMD’s Rapid Data Center Expansion Fuels Bullish Target
- · Stocks Supported by Middle East Peace Hopes and AI Spending
- · Buy Or Sell Microsoft Stock At $425?
Revenue & Net Income
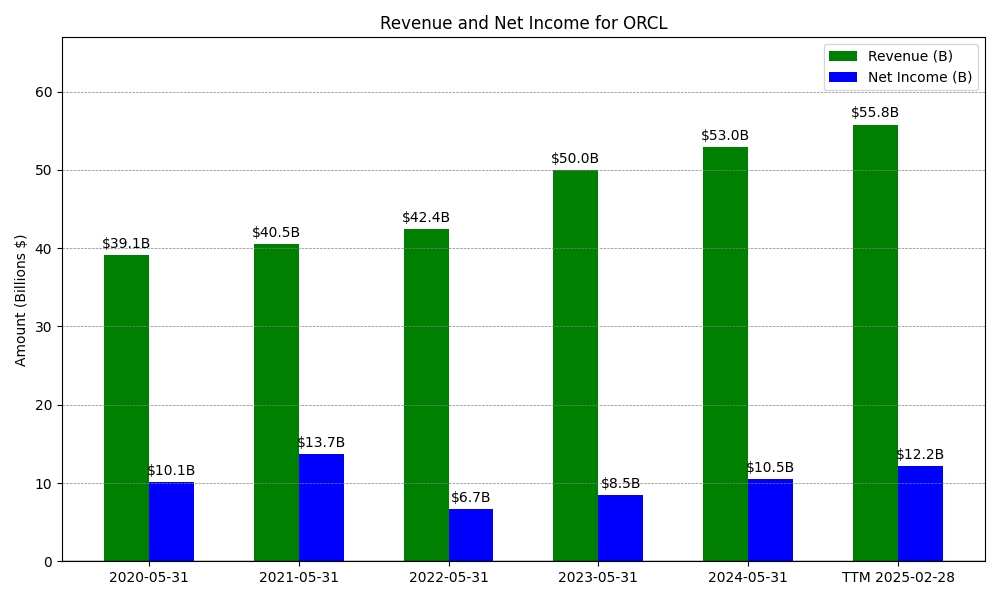
| Date | Revenue | Net_Income | EPS | Last_Updated | Revenue_Change | Net_Income_Change | EPS_Change | |
|---|---|---|---|---|---|---|---|---|
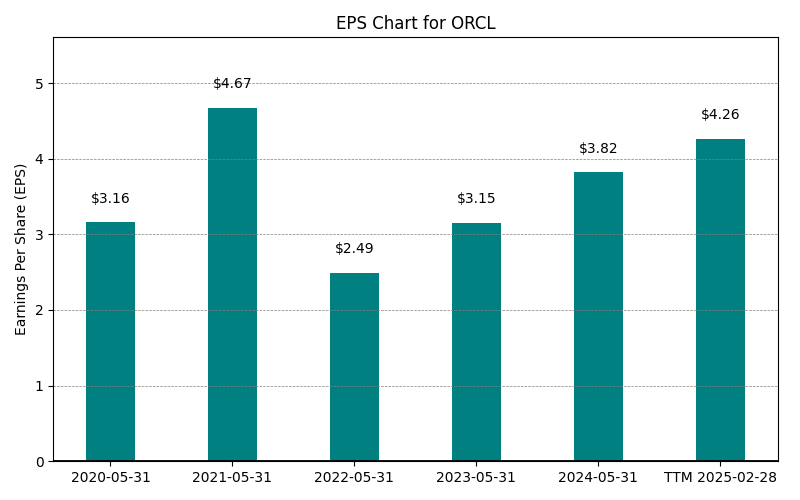
| 0 | 2020-05-31 | $39,068M | $10,135M | $3.16 | 2024-02-09 04:07:18 | N/A | N/A | N/A |
| 1 | 2021-05-31 | $40,479M | $13,746M | $4.67 | 2024-02-09 04:07:18 | 3.6% | 35.6% | 47.8% |
| 2 | 2022-05-31 | $42,440M | $6,717M | $2.49 | 2026-05-29 09:13:06 | 4.8% | -51.1% | -46.7% |
| 3 | 2023-05-31 | $49,954M | $8,503M | $3.15 | 2026-05-29 09:13:06 | 17.7% | 26.6% | 26.5% |
| 4 | 2024-05-31 | $52,961M | $10,467M | $3.82 | 2026-05-29 09:13:06 | 6.0% | 23.1% | 21.3% |
| 5 | 2025-05-31 | $57,399M | $12,443M | $4.46 | 2026-05-29 09:13:06 | 8.4% | 18.9% | 16.8% |
| 6 | TTM 2026-02-28 | $64,077M | $16,210M | $5.56 | 2026-03-17 08:50:04 | 11.6% | 30.3% | 24.7% |
EPS
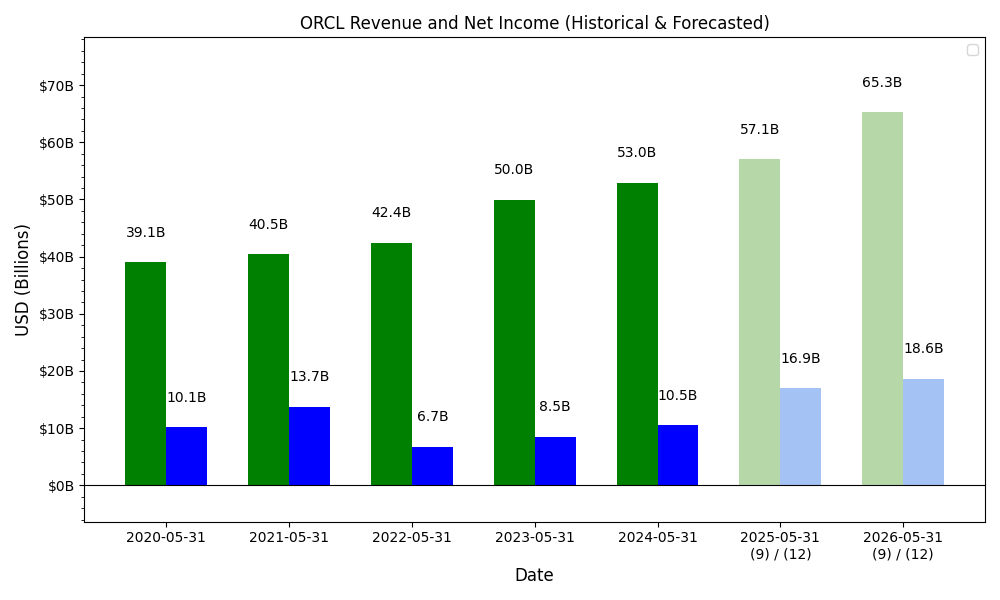
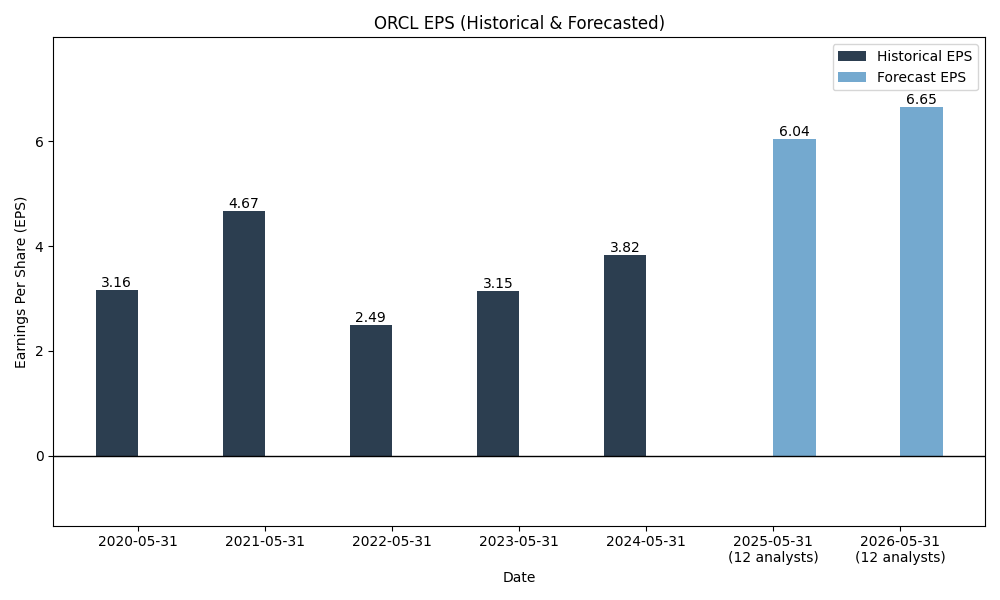
Forecasts
Y/Y % Change
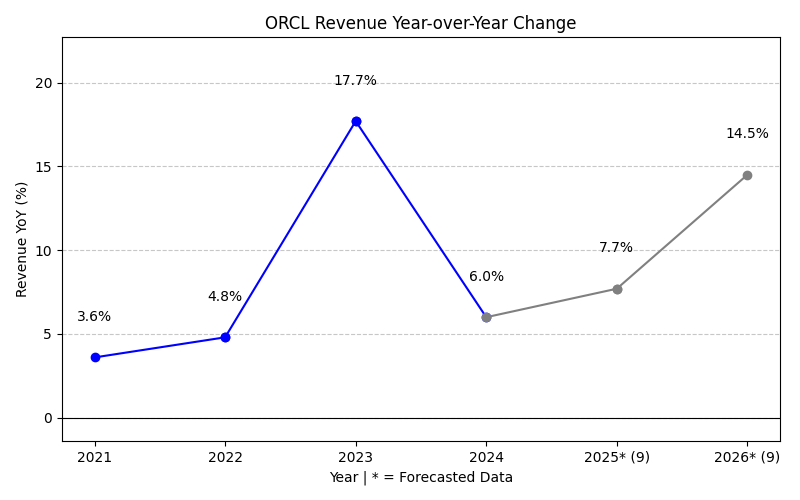
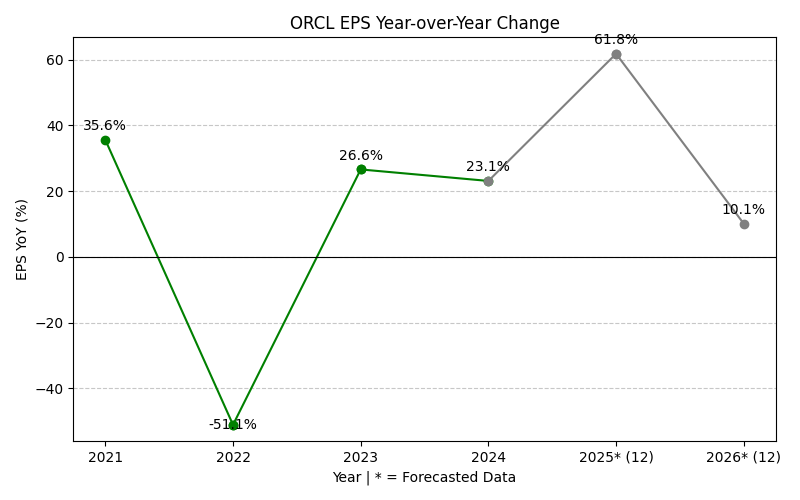
ORCL Year-over-Year Growth
| 2020 | 2021 | 2022 | 2023 | 2024 | 2025 | 2026 | 2027 | Average | |
|---|---|---|---|---|---|---|---|---|---|
| Revenue Growth (%) | 3.6% | 4.8% | 17.7% | 6.0% | 8.4% | 17.1% | 31.9% | 12.8% | |
| Revenue Analysts (#) | 0 | 0 | 0 | 0 | 0 | 0 | 39 | 38 | |
| EPS Growth (%) | 35.6% | -51.1% | 26.6% | 23.1% | 18.9% | 72.3% | 7.8% | 19.0% | |
| EPS Analysts (#) | 0 | 0 | 0 | 0 | 0 | 0 | 39 | 38 |
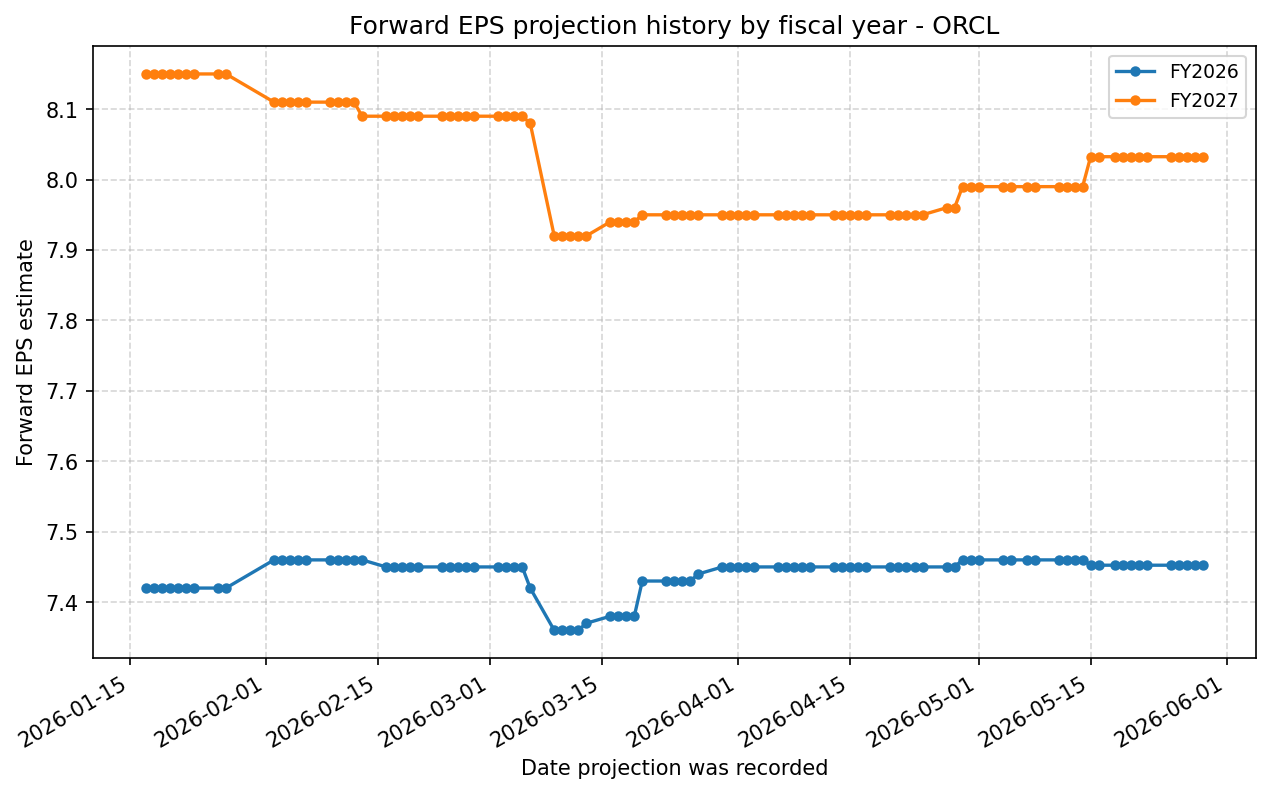
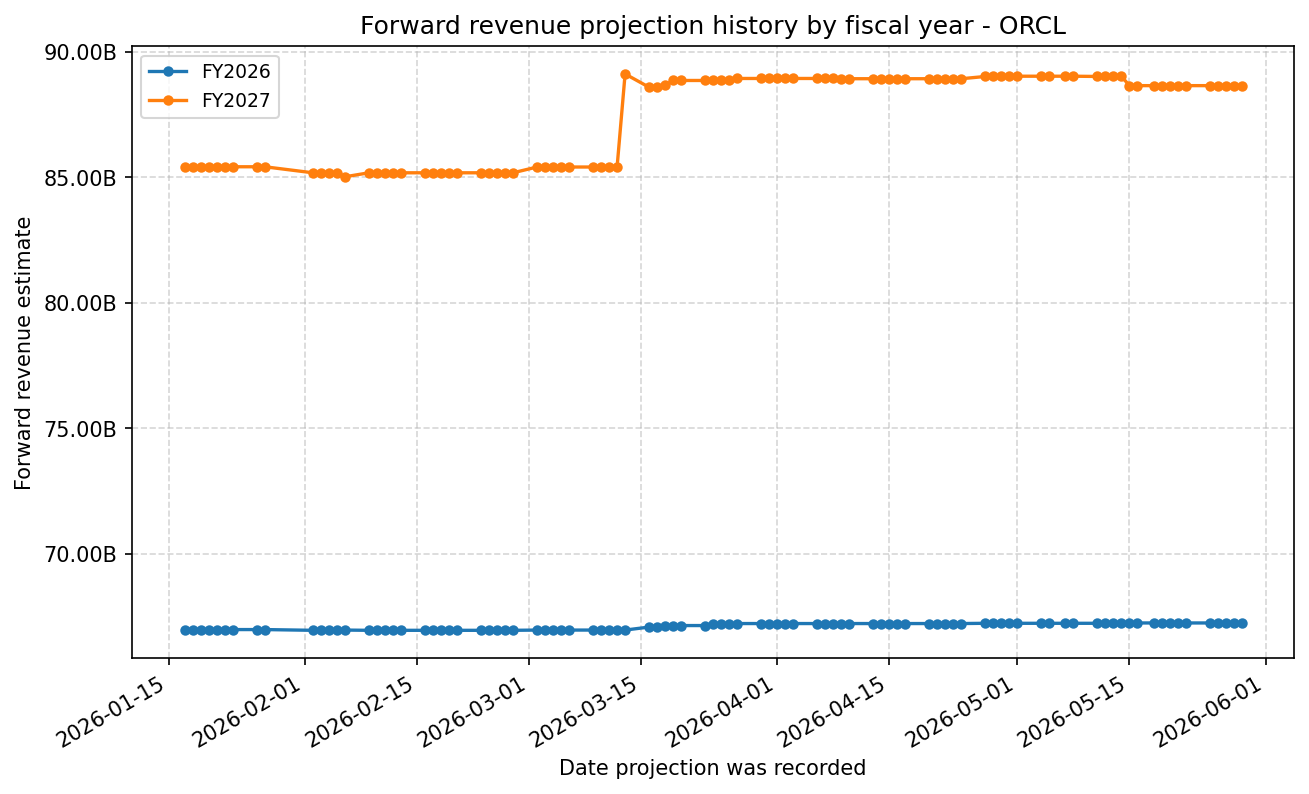
Forward Estimate History
How the next-FY EPS and revenue estimates have drifted over time. One line per fiscal year – past lines end when that FY became current.
Expenses
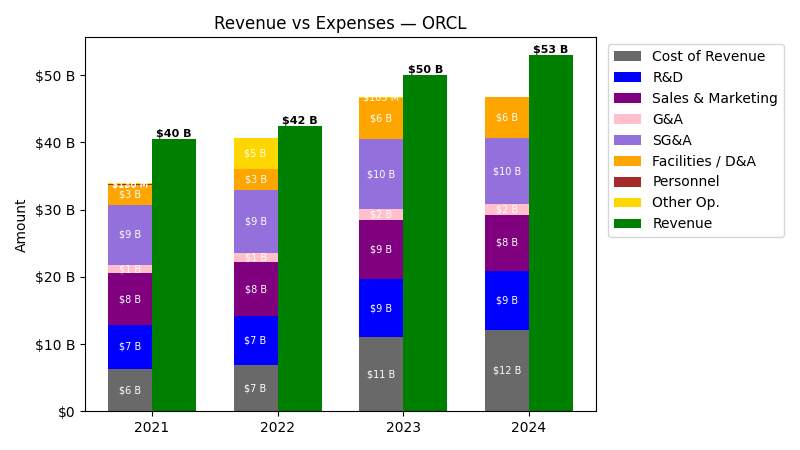
| Year | Revenue ($) | Cost of Revenue ($) | R&D ($) | Sales & Marketing ($) | G&A ($) | SG&A ($) | Facilities / D&A ($) | Personnel ($) |
|---|---|---|---|---|---|---|---|---|
| 2022 | $42.4B | $3.8B | $7.2B | $8.0B | $1.3B | $9.4B | $3.1B | $245.0M |
| 2023 | $50.0B | $4.9B | $8.6B | $8.8B | $1.6B | $10.4B | $6.1B | $363.0M |
| 2024 | $53.0B | $5.9B | $8.9B | $8.3B | $1.5B | $9.8B | $6.1B | $367.0M |
| 2025 | $57.4B | $6.9B | $9.9B | $8.7B | $1.6B | $10.3B | $6.2B | $439.0M |
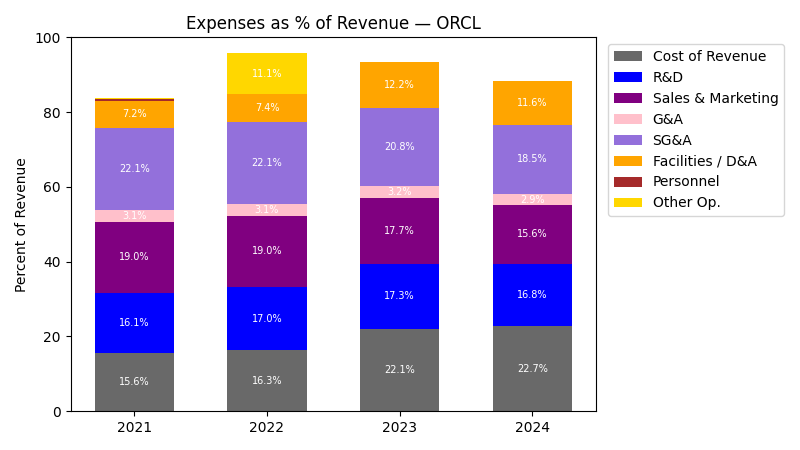
| Year | Revenue Change (%) | Cost of Revenue Change (%) | R&D Change (%) | Sales & Marketing Change (%) | G&A Change (%) | SG&A Change (%) | Facilities / D&A Change (%) | Personnel Change (%) |
|---|---|---|---|---|---|---|---|---|
| 2023 | 17.70 | 30.32 | 19.45 | 9.77 | 19.89 | 11.19 | 95.64 | 48.16 |
| 2024 | 6.02 | 19.17 | 3.39 | -6.33 | -1.96 | -5.67 | 0.51 | 1.10 |
| 2025 | 8.38 | 17.21 | 10.60 | 4.56 | 3.49 | 4.39 | 0.57 | 19.62 |
No unmapped expenses.
Segment Performance
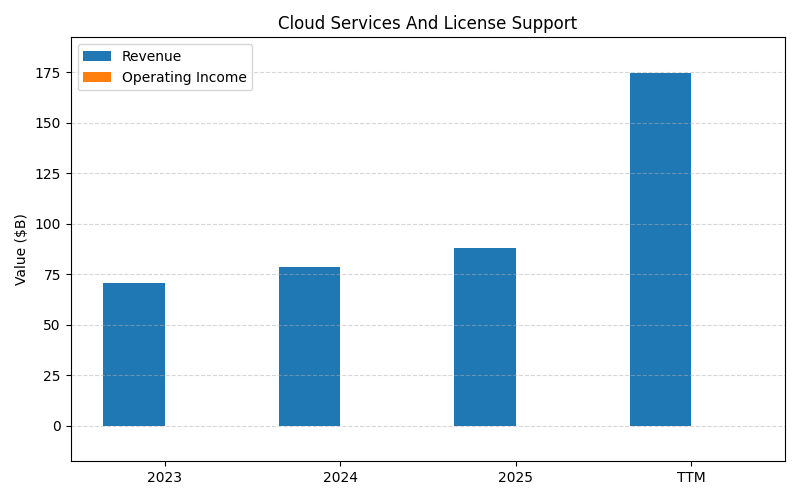
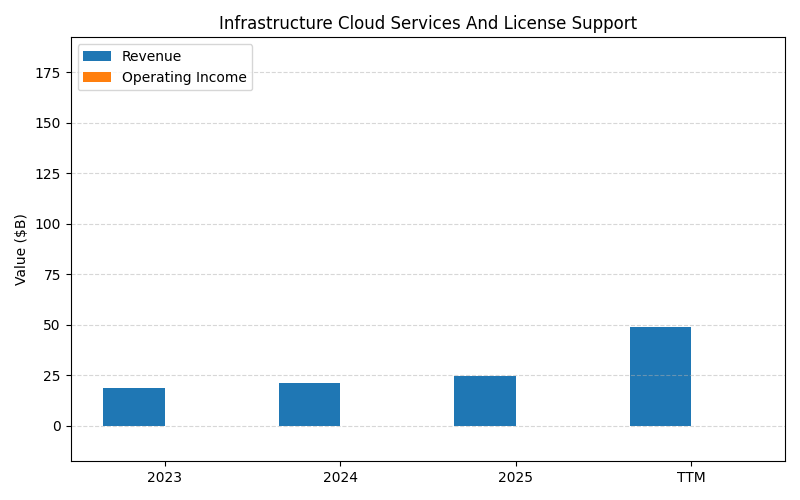
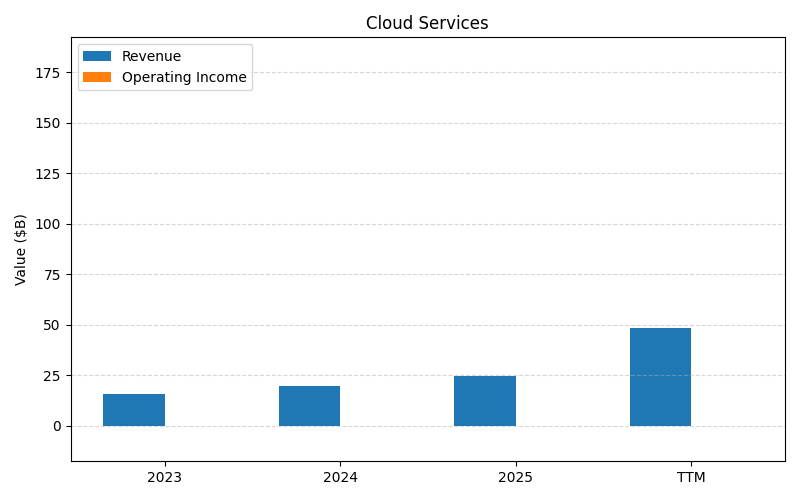
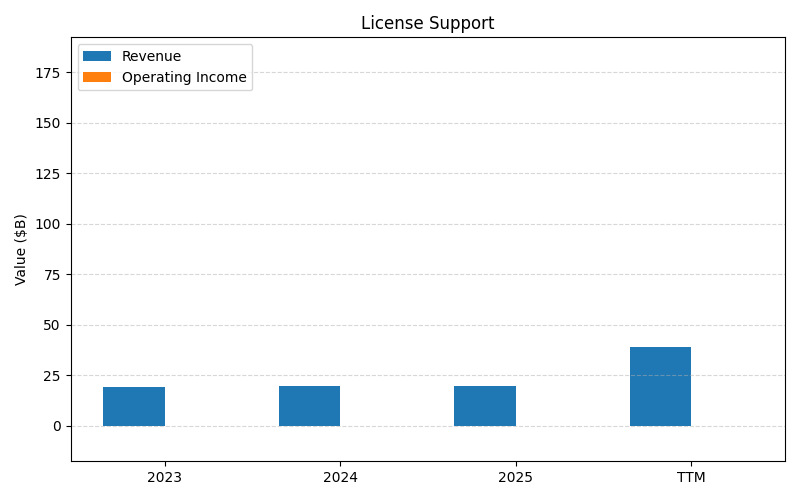
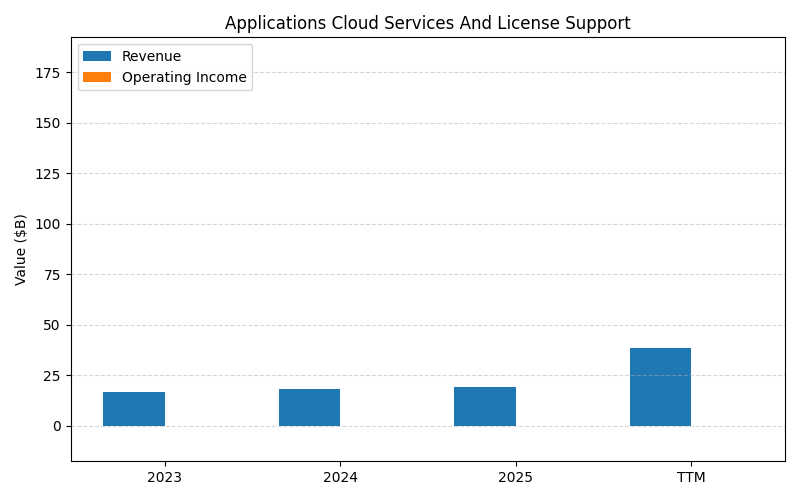
SEGMENTS v2025-09-09 · 2026-05-29 09:13 UTC — Units: $B. Rows list fiscal years (last 3 + TTM) with revenue for each segment; the final row shows the TTM revenue mix (operating income columns display “—” where mix is not applicable).
| Year | Cloud Services And License Support Rev | Infrastructure Cloud Services And License Support Rev | Cloud Services Rev | License Support Rev | Applications Cloud Services And License Support Rev | Total Rev |
|---|---|---|---|---|---|---|
| 2023 | 70.6B | 18.7B | 15.9B | 19.4B | 16.7B | 141.2B |
| 2024 | 78.8B | 21.2B | 19.8B | 19.6B | 18.2B | 157.5B |
| 2025 | 88.1B | 24.6B | 24.5B | 19.5B | 19.4B | 176.1B |
Segment Performance (Axis 2)
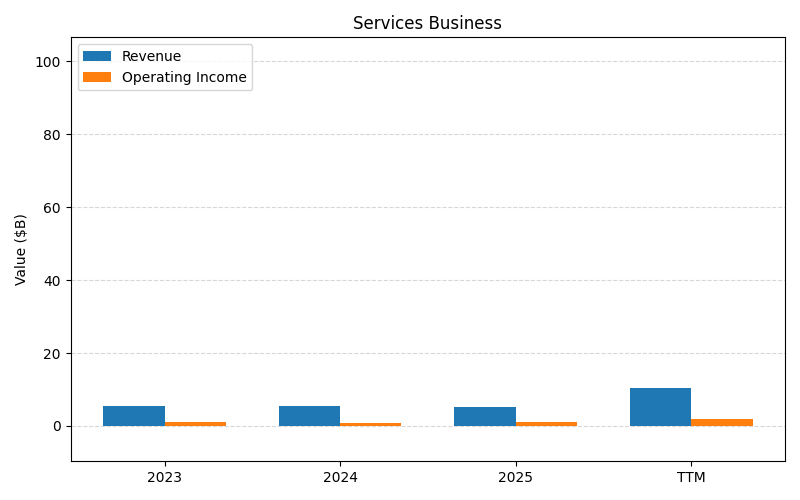
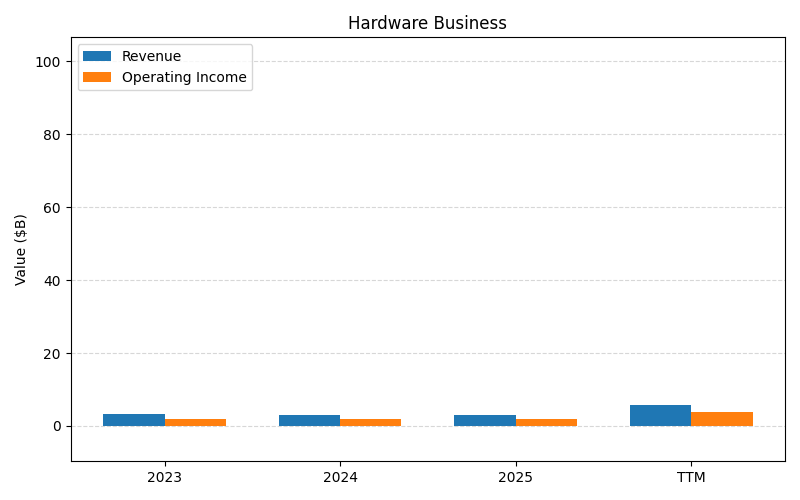
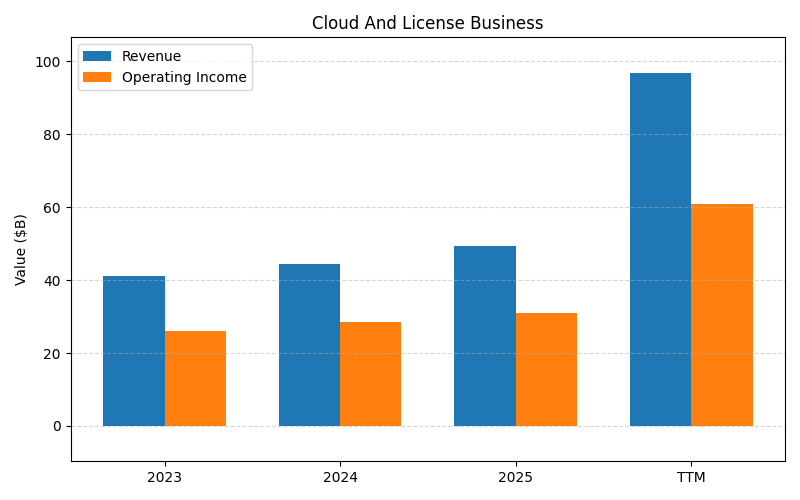
SEGMENTS v2025-09-09 · 2026-05-29 09:13 UTC — Units: $B. Rows list fiscal years (last 3 + TTM) with revenue and operating income for each segment; the final row shows the TTM revenue mix (operating income columns display “—” where mix is not applicable).
| Year | Services Business Rev | Services Business OI | Hardware Business Rev | Hardware Business OI | Cloud And License Business Rev | Cloud And License Business OI | Total Rev | Total OI |
|---|---|---|---|---|---|---|---|---|
| 2023 | 5.59B | 1.10B | 3.27B | 1.93B | 41.1B | 26.1B | 50B | 29.2B |
| 2024 | 5.43B | 0.92B | 3.07B | 1.92B | 44.5B | 28.5B | 53B | 31.3B |
| 2025 | 5.23B | 0.99B | 2.94B | 1.92B | 49.2B | 30.9B | 57.4B | 33.8B |
| TTM | 21.5B | 4.36B | 11.7B | 7.60B | – | – | 33.2B | 12B |
| % of Total (TTM) | 64.8% | — | 35.2% | — | – | — | 100% | — |
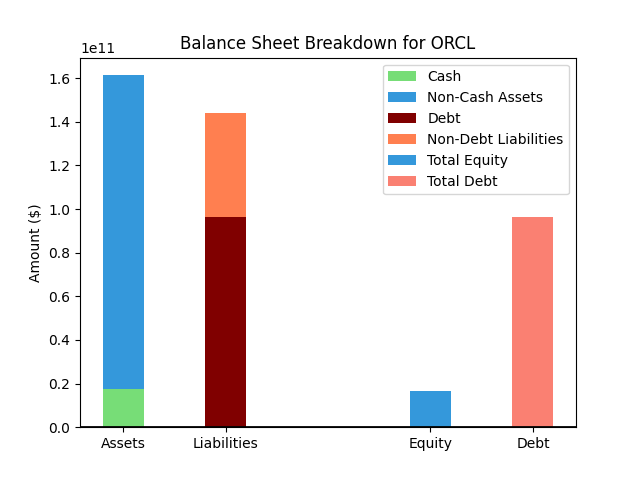
Balance Sheet
| Metric | Value | |
|---|---|---|
| 0 | Total Assets | $245,240M |
| 1 | Cash | $38,455M |
| 2 | Total Liabilities | $206,189M |
| 3 | Total Debt | $153,117M |
| 4 | Total Equity | $38,495M |
| 5 | Debt to Equity Ratio | 3.98 |
EPS & Dividend

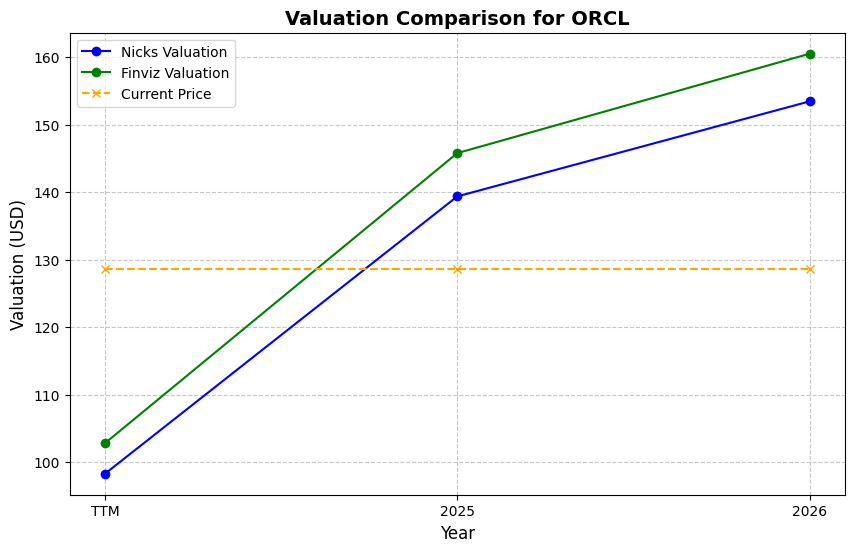
Valuation
| Share Price | Treasury Yield | Estimates | Fair Value (P/E) | Fair Value (P/S) | Current P/S | Current P/E |
|---|---|---|---|---|---|---|
| $225.78 | 4.5% | Nicks Growth: 13% Nick's Expected Margin: 25% FINVIZ Growth: 21% |
Nicks: 23 Finviz: 47 |
Nick's: 5.677 | 10.1 | 40.6 |
| Basis | Year | Nicks Valuation | Nicks vs Share Price | Finviz Valuation | Finviz vs Share Price |
|---|---|---|---|---|---|
| $5.56 EPS | TTM | $126.26 | -44.1% | $264.01 | 16.9% |
| $7.45 EPS | 2026 | $169.23 | -25.0% | $353.87 | 56.7% |
| $8.03 EPS | 2027 | $182.40 | -19.2% | $381.42 | 68.9% |
Implied Growth
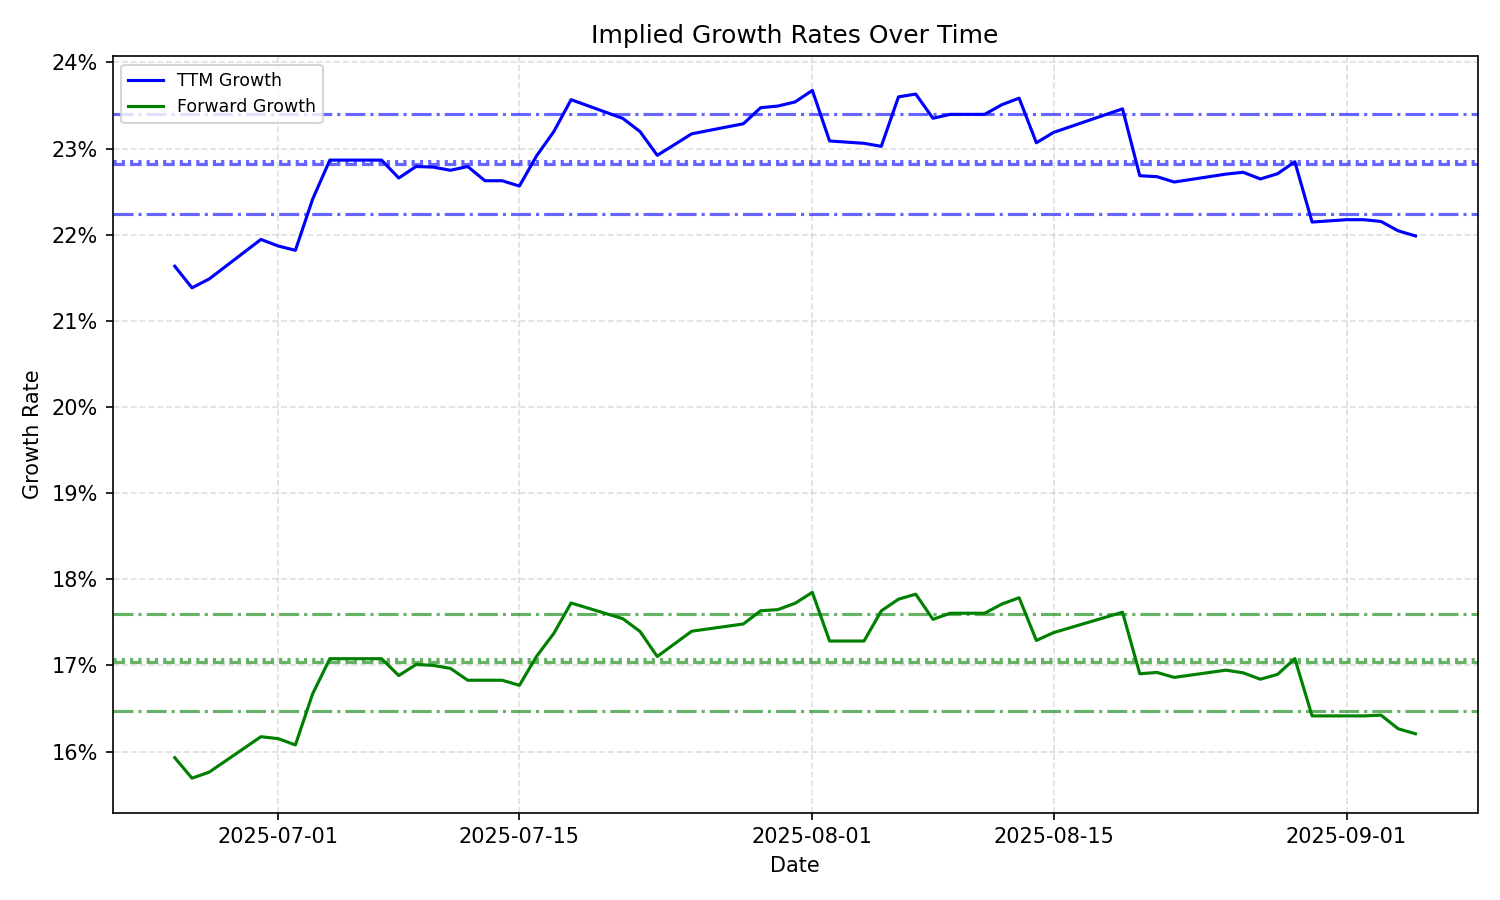
| Average | Median | Std Dev | Current | Percentile | ||||||
|---|---|---|---|---|---|---|---|---|---|---|
| TTM | Forward | TTM | Forward | TTM | Forward | TTM | Forward | TTM | Forward | |
| Timeframe | ||||||||||
| 1 Year | 20.11% | 15.02% | 21.32% | 15.60% | 3.77% | 2.98% | 18.32% | 14.21% | 44.6% | 45.4% |
| 3 Years | 20.11% | 15.02% | 21.32% | 15.60% | 3.77% | 2.98% | 18.32% | 14.21% | 44.6% | 45.4% |
| 5 Years | 20.11% | 15.02% | 21.32% | 15.60% | 3.77% | 2.98% | 18.32% | 14.21% | 44.6% | 45.4% |
| 10 Years | 20.11% | 15.02% | 21.32% | 15.60% | 3.77% | 2.98% | 18.32% | 14.21% | 44.6% | 45.4% |