Opendoor Technologies Inc — OPEN
| Close Price | Market Cap | P/E Ratio | Forward P/E Ratio | Implied Growth* | Implied Forward Growth* | Dividend | P/B Ratio |
|---|---|---|---|---|---|---|---|
| $5.04 | $4.86B | - | -425.7 | N/A | - | - | 4.8 |
Latest Headlines
- · Can Opendoor's Lower-Rate Mortgage Model Lift Buyer Conversion?
- · 1 Unprofitable Stock on Our Buy List and 2 We Question
- · Why Is Opendoor (OPEN) Stock Rocketing Higher Today
- · Opendoor Announces Inclusion in Russell 3000 Index
- · NavigateAI Launches to Build the AI Copilot for the Physical World
- · The Best Stocks to Buy After This Year's Sell-Off
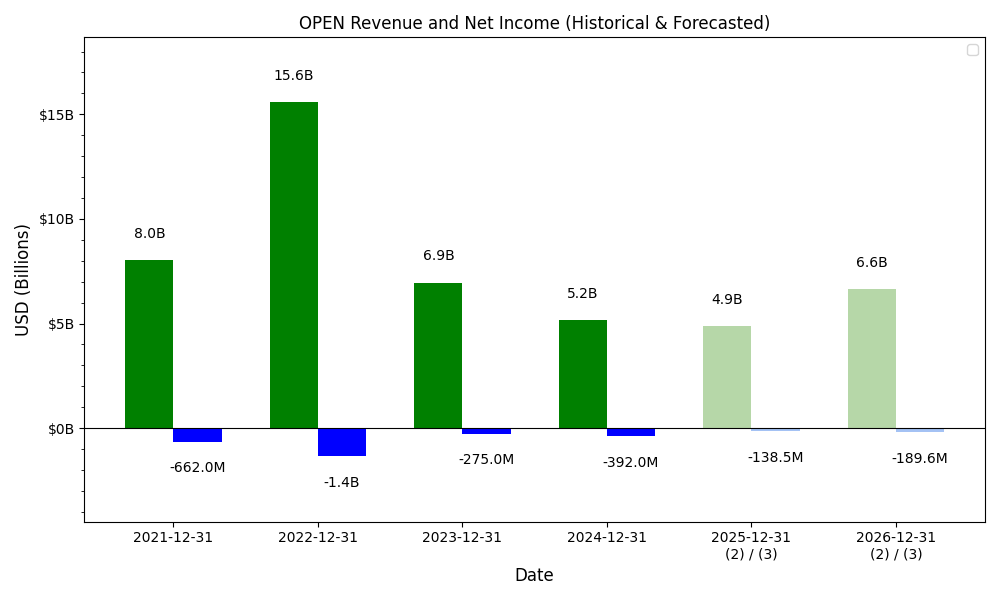
Revenue & Net Income

| Date | Revenue | Net_Income | EPS | Last_Updated | Revenue_Change | Net_Income_Change | EPS_Change | |
|---|---|---|---|---|---|---|---|---|
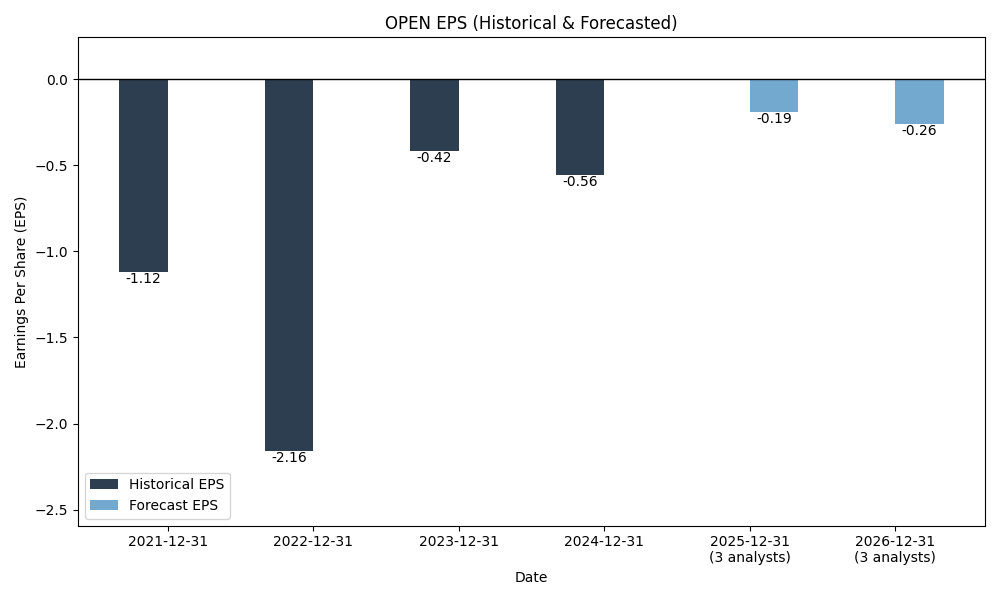
| 0 | 2021-12-31 | $8,021M | $-662M | $-1.12 | 2026-02-27 13:34:57 | N/A | N/A | N/A |
| 1 | 2022-12-31 | $15,567M | $-1,353M | $-2.16 | 2026-05-29 09:13:00 | 94.1% | 104.4% | 92.9% |
| 2 | 2023-12-31 | $6,946M | $-275M | $-0.42 | 2026-05-29 09:13:00 | -55.4% | -79.7% | -80.6% |
| 3 | 2024-12-31 | $5,153M | $-392M | $-0.56 | 2026-05-29 09:13:00 | -25.8% | 42.5% | 33.3% |
| 4 | 2025-12-31 | $4,371M | $-1,300M | $-1.70 | 2026-05-29 09:13:00 | -15.2% | 231.6% | 203.6% |
| 5 | TTM 2026-03-31 | $3,938M | $-1,388M | $-1.76 | 2026-05-11 09:13:26 | -9.9% | 6.8% | 3.5% |
EPS

Forecasts
Y/Y % Change
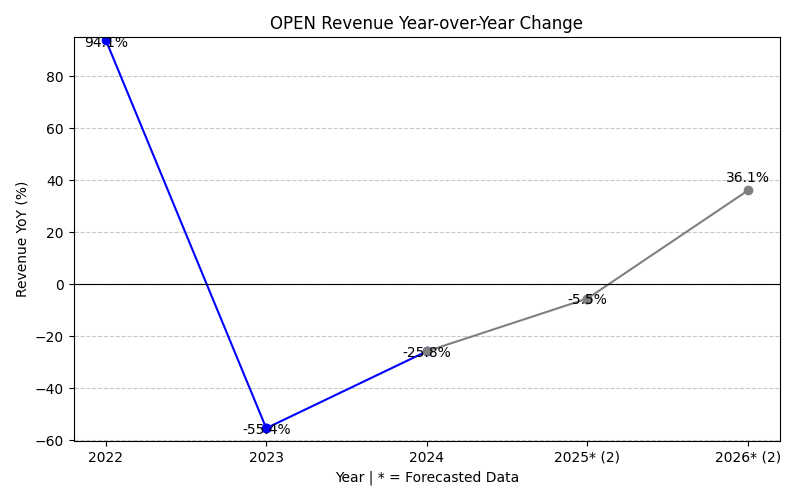
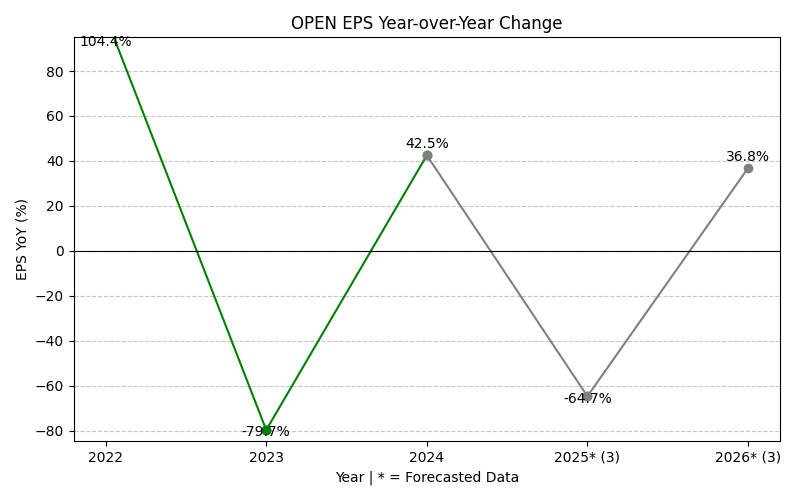
OPEN Year-over-Year Growth
| 2021 | 2022 | 2023 | 2024 | 2025 | 2026 | 2027 | Average | |
|---|---|---|---|---|---|---|---|---|
| Revenue Growth (%) | 94.1% | -55.4% | -25.8% | -15.2% | -9.0% | 60.4% | 8.2% | |
| Revenue Analysts (#) | 0 | 0 | 0 | 0 | 0 | 9 | 9 | |
| EPS Growth (%) | 104.4% | -79.7% | 42.5% | 231.6% | -89.3% | -91.8% | 19.6% | |
| EPS Analysts (#) | 0 | 0 | 0 | 0 | 0 | 4 | 4 |
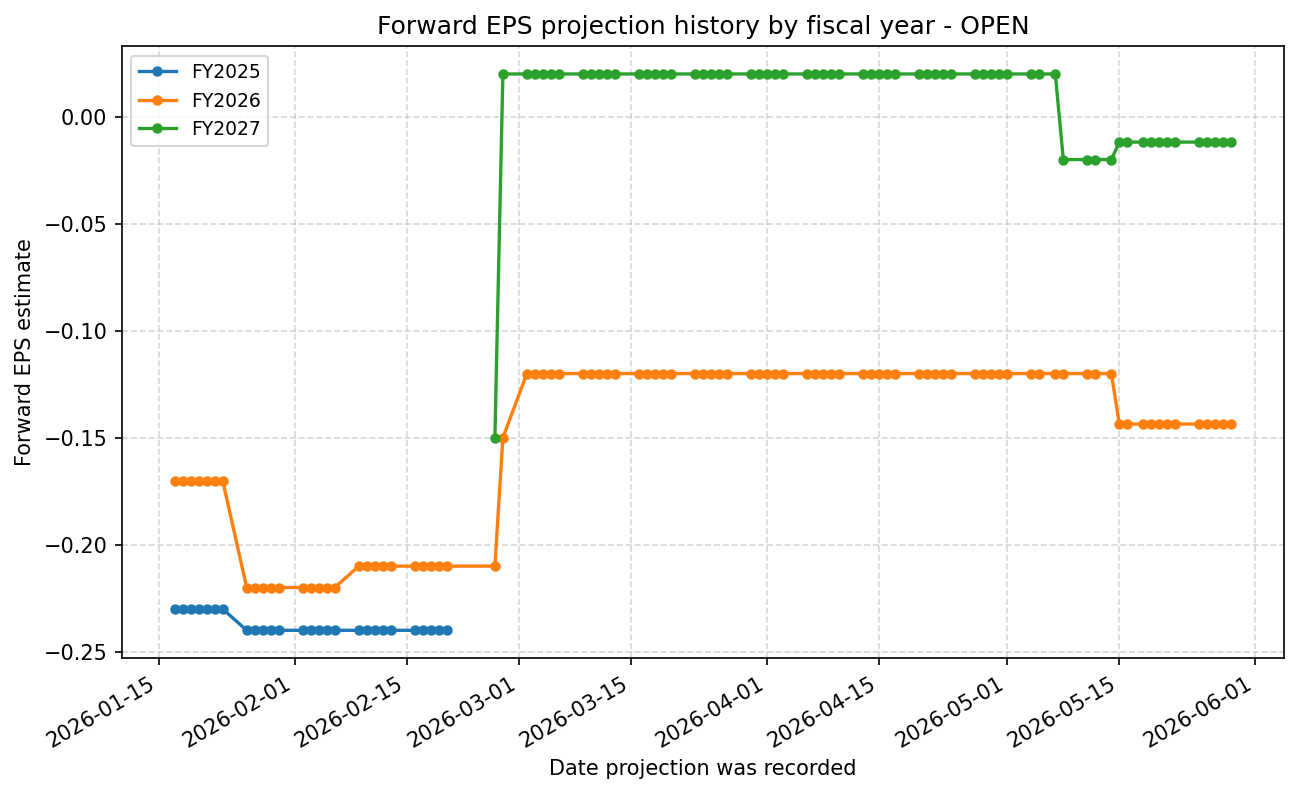
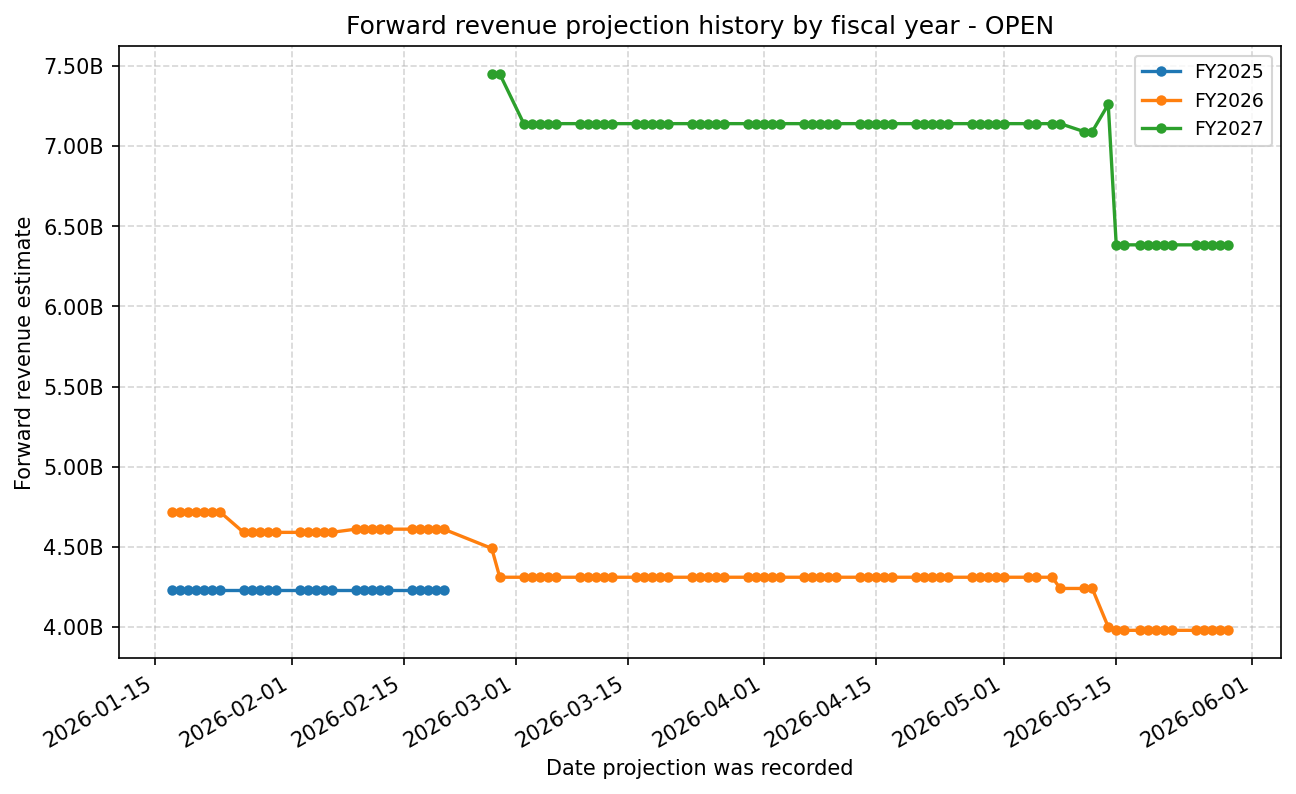
Forward Estimate History
How the next-FY EPS and revenue estimates have drifted over time. One line per fiscal year – past lines end when that FY became current.
Expenses

| Year | Revenue ($) | Cost of Revenue ($) | R&D ($) | Sales & Marketing ($) | G&A ($) | SG&A ($) | Facilities / D&A ($) |
|---|---|---|---|---|---|---|---|
| 2022 | $15.6B | $14.8B | $169.0M | $1.0B | $346.0M | $1.4B | $90.0M |
| 2023 | $6.9B | $6.4B | $167.0M | $486.0M | $206.0M | $692.0M | $72.0M |
| 2024 | $5.2B | $4.7B | $141.0M | $413.0M | $182.0M | $595.0M | $53.0M |
| 2025 | $4.4B | $4.0B | $79.0M | $310.0M | $238.0M | $548.0M | $46.0M |
| TTM | $3.9B | $3.6B | $82.0M | $282.0M | $342.0M | $624.0M | $43.0M |

| Year | Revenue Change (%) | Cost of Revenue Change (%) | R&D Change (%) | Sales & Marketing Change (%) | G&A Change (%) | SG&A Change (%) | Facilities / D&A Change (%) |
|---|---|---|---|---|---|---|---|
| 2023 | -55.38 | -56.87 | -1.18 | -51.69 | -40.46 | -48.82 | -20.00 |
| 2024 | -25.81 | -26.93 | -15.57 | -15.02 | -11.65 | -14.02 | -26.39 |
| 2025 | -15.18 | -14.83 | -43.97 | -24.94 | 30.77 | -7.90 | -13.21 |
| TTM | -9.91 | -10.14 | 3.80 | -9.03 | 43.70 | 13.87 | -6.52 |
No unmapped expenses.
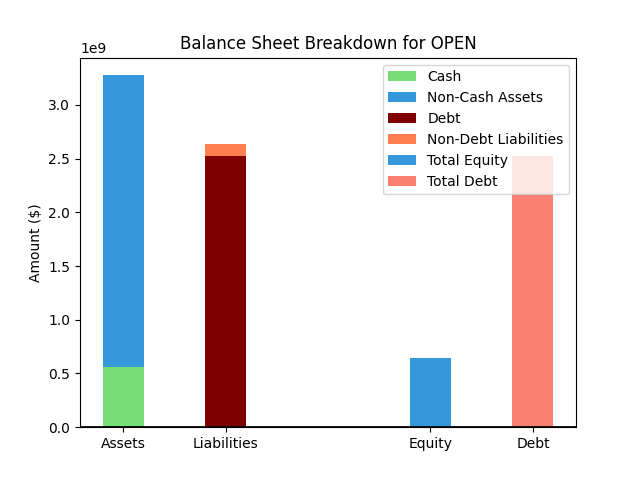
Balance Sheet
| Metric | Value | |
|---|---|---|
| 0 | Total Assets | $2,407M |
| 1 | Cash | $962M |
| 2 | Total Liabilities | $1,402M |
| 3 | Total Debt | $1,320M |
| 4 | Total Equity | $1,005M |
| 5 | Debt to Equity Ratio | 1.31 |
EPS & Dividend

Valuation
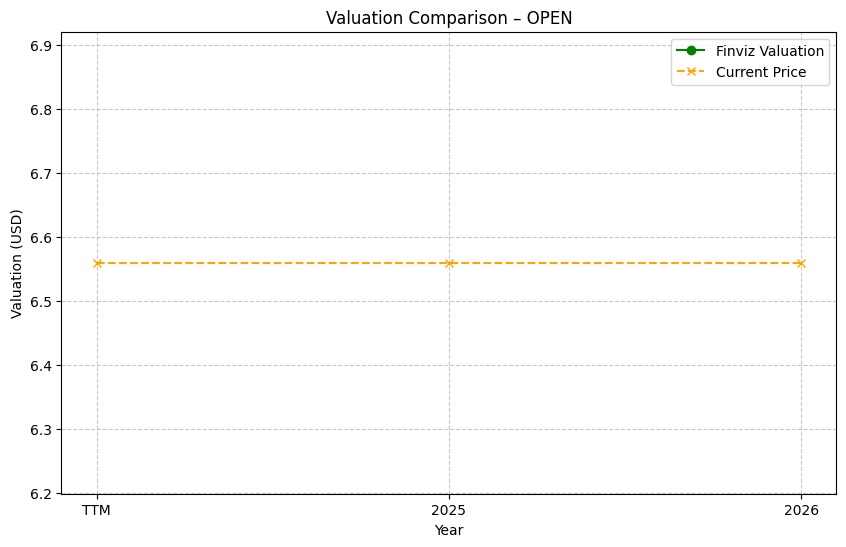
| Share Price | Treasury Yield | Estimates | Fair Value (P/E) | Fair Value (P/S) | Current P/S | Current P/E |
|---|---|---|---|---|---|---|
| $5.04 | 4.5% | FINVIZ Growth: 48% | Nicks: 6 Finviz: 382 |
Nick's: 0.000 | 1.2 | - |
| Basis | Year | Nicks Valuation | Nicks vs Share Price | Finviz Valuation | Finviz vs Share Price |
|---|---|---|---|---|---|
| $4.08 Revenue | TTM | $0.00 | -100.0% | - | - |
| $4.12 Revenue | 2026 | $0.00 | -100.0% | - | - |
| $6.62 Revenue | 2027 | $0.00 | -100.0% | - | - |
Implied Growth

No implied growth data available.