NVIDIA Corporation — NVDA
| Close Price | Market Cap | P/E Ratio | Forward P/E Ratio | Implied Growth* | Implied Forward Growth* | Dividend | P/B Ratio |
|---|---|---|---|---|---|---|---|
| $211.14 | $5.11T | 32.3 | 16.7 | 16.9% | 9.7% | $1.00 0.5% | 32.6 |
Latest Headlines
- · Why POET Technologies Stock Keeps Falling
- · Amazon is Cutting Even More Jobs, Following the Mass Layoffs in January. Can It Maintain Its Cloud Dominance as Employees Exit?
- · Nvidia Dropped a Cryptic Clue About Its Next Big Move Ahead of GTC Event
- · These 2 Tech Titans Just Declared Dividend Raises. Should You Buy One or Both?
- · 2 Tech ETFs for Nearly Every Corner of the Digital Economy: From Semiconductors to Robotics
- · Brookfield Corporation or Brookfield Asset Management: Which One Is the Smarter Buy?
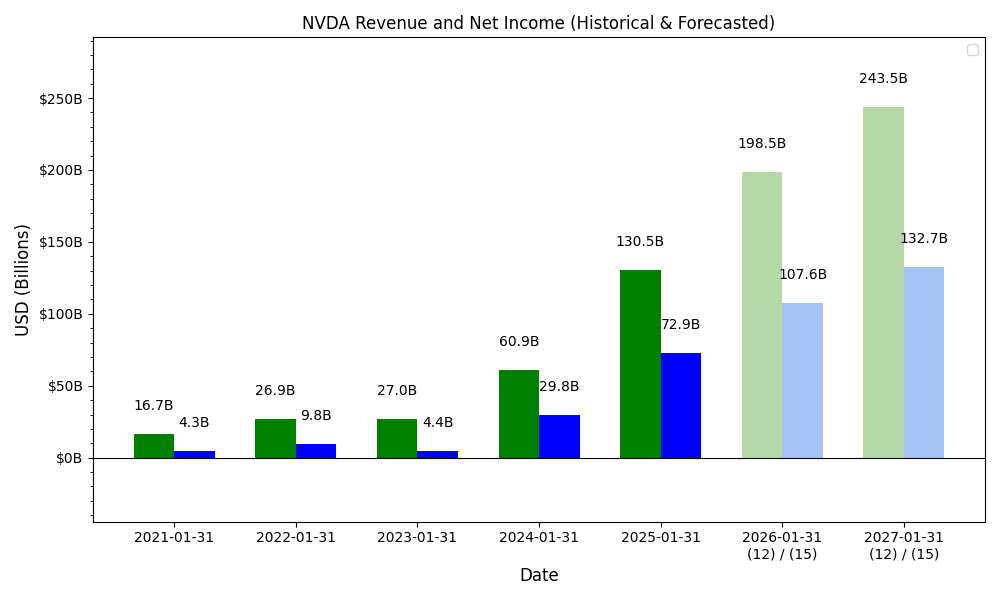
Revenue & Net Income
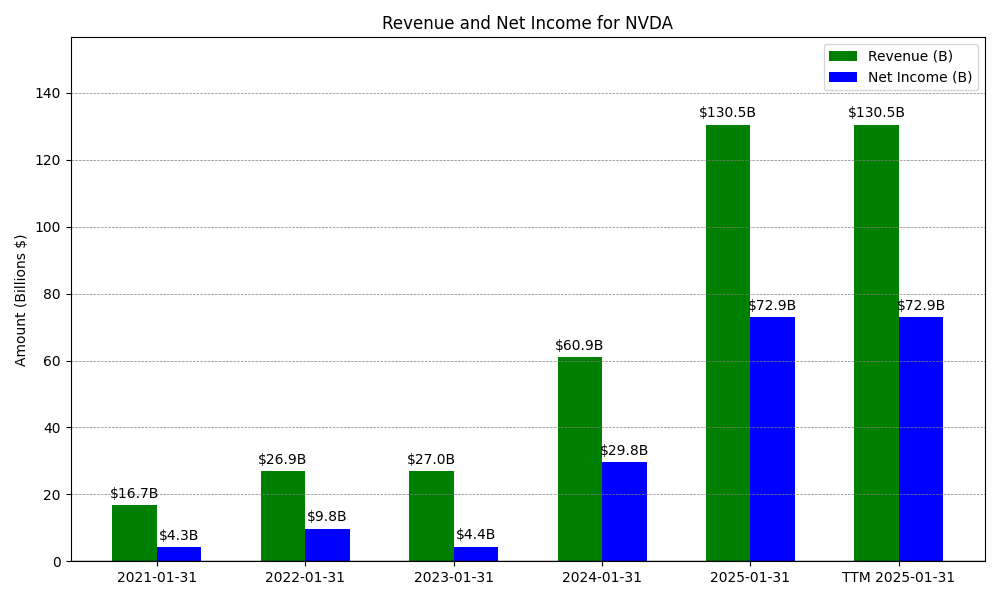
| Date | Revenue | Net_Income | EPS | Last_Updated | Revenue_Change | Net_Income_Change | EPS_Change | |
|---|---|---|---|---|---|---|---|---|
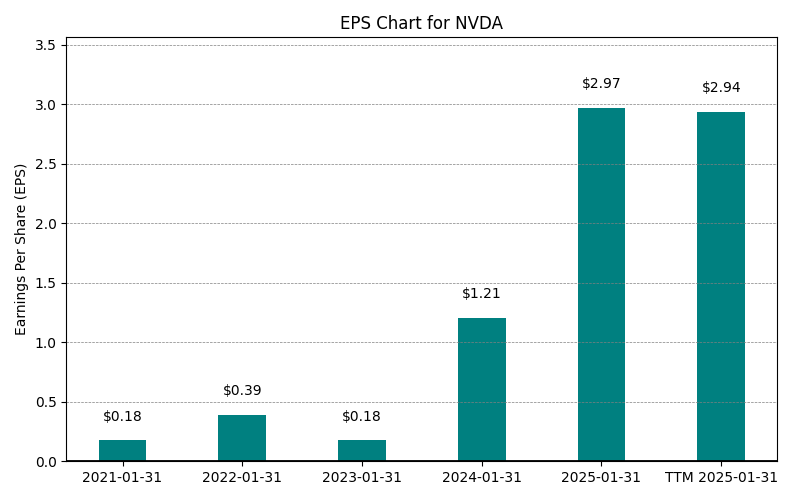
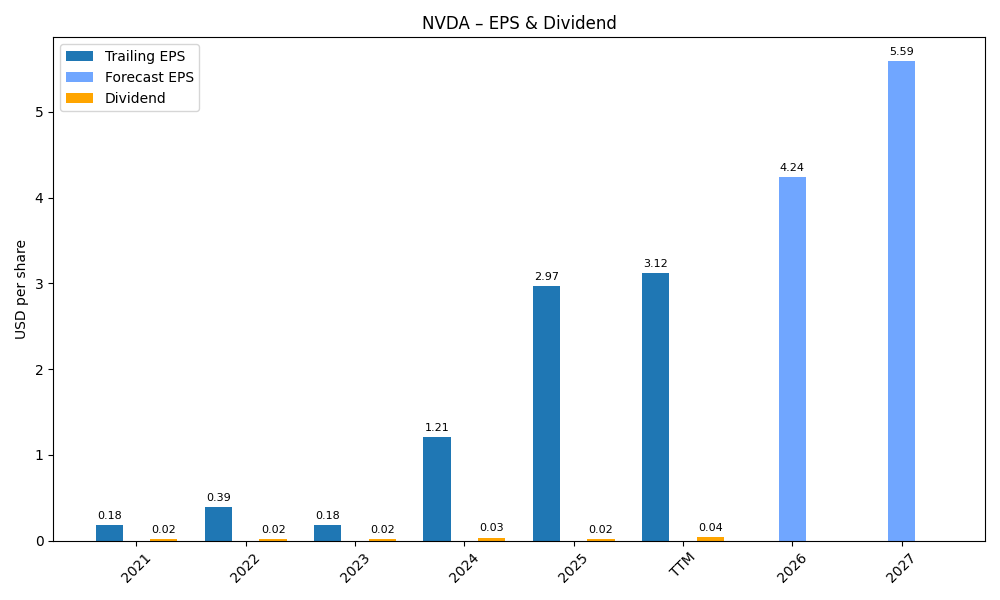
| 0 | 2021-01-31 | $16,675M | $4,332M | $0.18 | 2024-02-04 04:18:35 | N/A | N/A | N/A |
| 1 | 2022-01-31 | $26,914M | $9,752M | $0.39 | 2026-02-27 13:34:49 | 61.4% | 125.1% | 122.8% |
| 2 | 2023-01-31 | $26,974M | $4,368M | $0.18 | 2026-05-29 09:12:54 | 0.2% | -55.2% | -55.0% |
| 3 | 2024-01-31 | $60,922M | $29,760M | $1.21 | 2026-05-29 09:12:54 | 125.9% | 581.3% | 587.5% |
| 4 | 2025-01-31 | $130,497M | $72,880M | $2.97 | 2026-05-29 09:12:54 | 114.2% | 144.9% | 145.5% |
| 5 | 2026-01-31 | $215,938M | $120,067M | $4.93 | 2026-05-29 09:12:54 | 65.5% | 64.7% | 66.0% |
| 6 | TTM 2026-04-30 | $253,491M | $159,613M | $6.53 | 2026-05-22 09:10:29 | 17.4% | 32.9% | 32.5% |
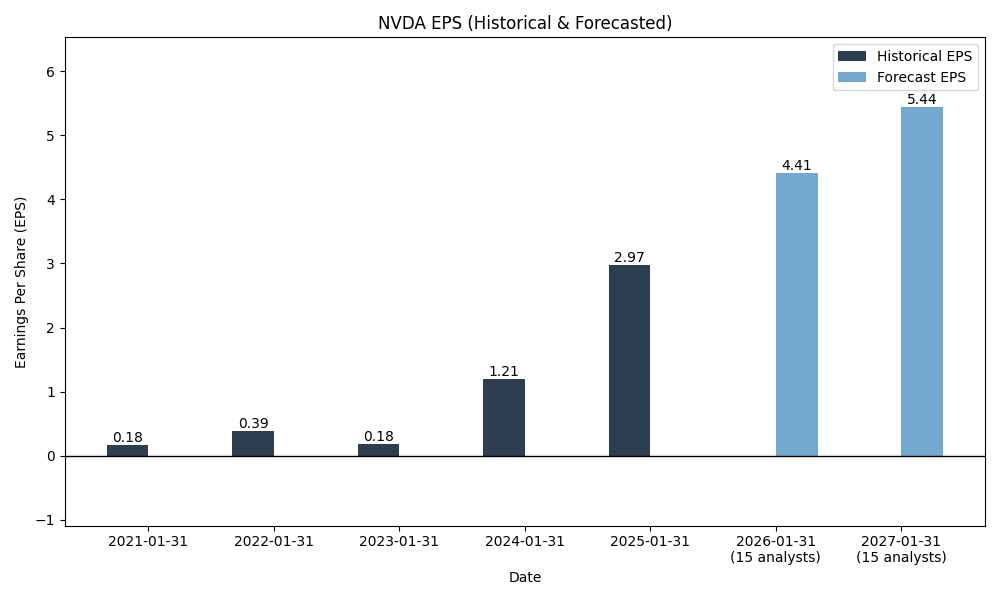
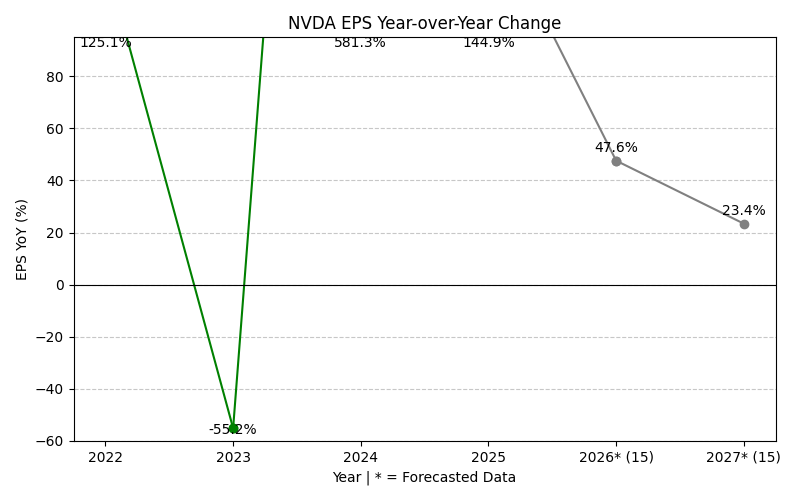
EPS
Forecasts
Y/Y % Change
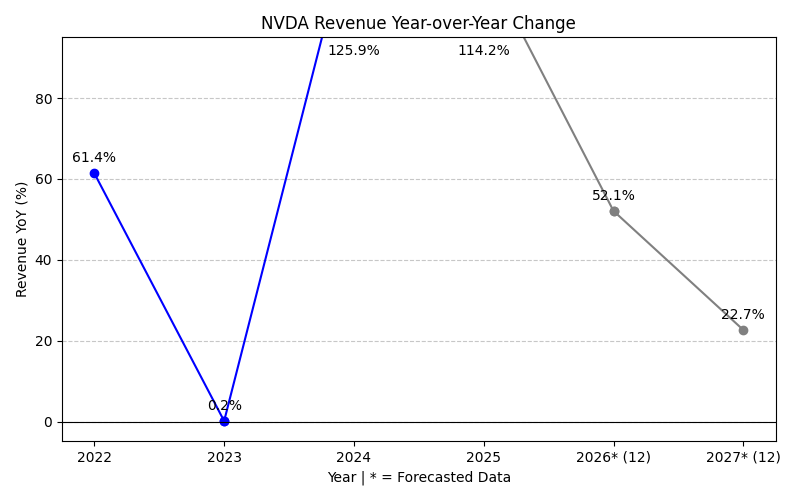
NVDA Year-over-Year Growth
| 2021 | 2022 | 2023 | 2024 | 2025 | 2026 | 2027 | 2028 | Average | |
|---|---|---|---|---|---|---|---|---|---|
| Revenue Growth (%) | 61.4% | 0.2% | 125.9% | 114.2% | 65.5% | 81.3% | 39.9% | 69.8% | |
| Revenue Analysts (#) | 0 | 0 | 0 | 0 | 0 | 0 | 49 | 54 | |
| EPS Growth (%) | 125.1% | -55.2% | 581.3% | 144.9% | 64.7% | 80.4% | 41.5% | 140.4% | |
| EPS Analysts (#) | 0 | 0 | 0 | 0 | 0 | 0 | 47 | 48 |
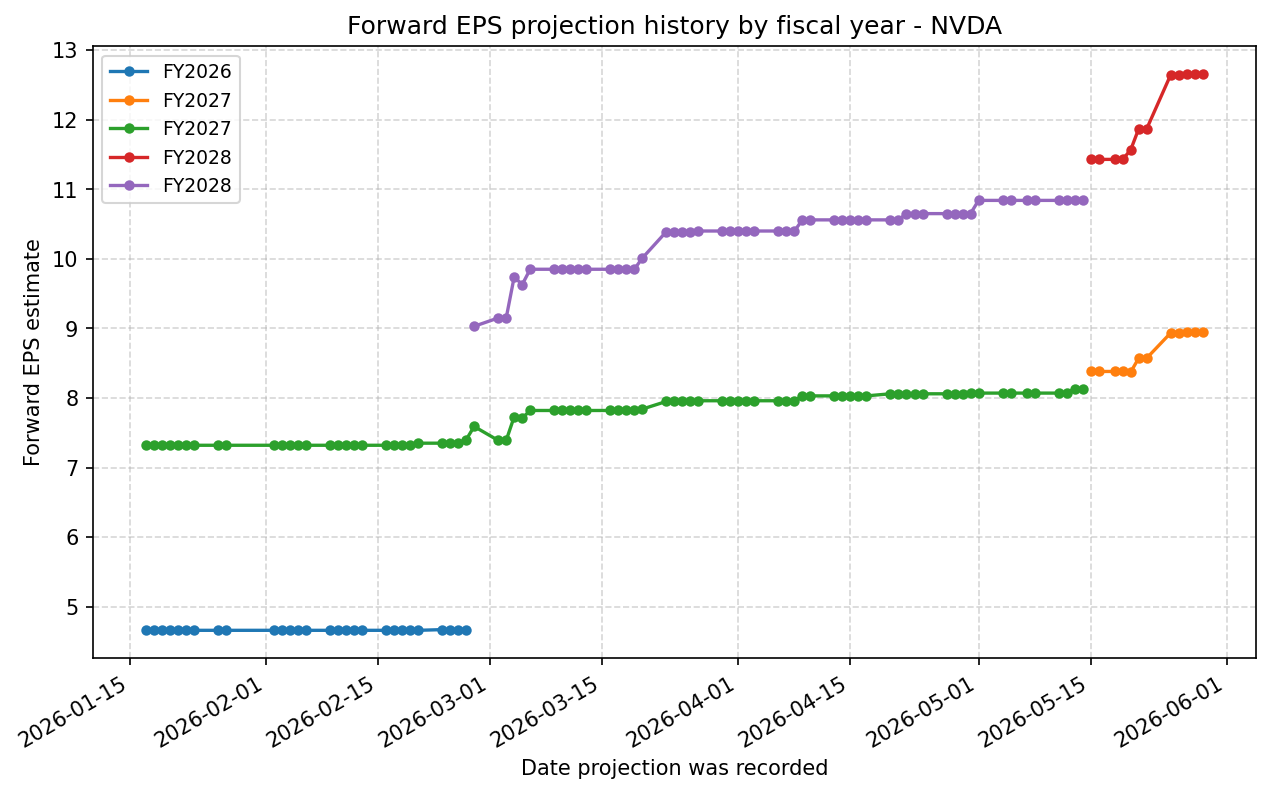
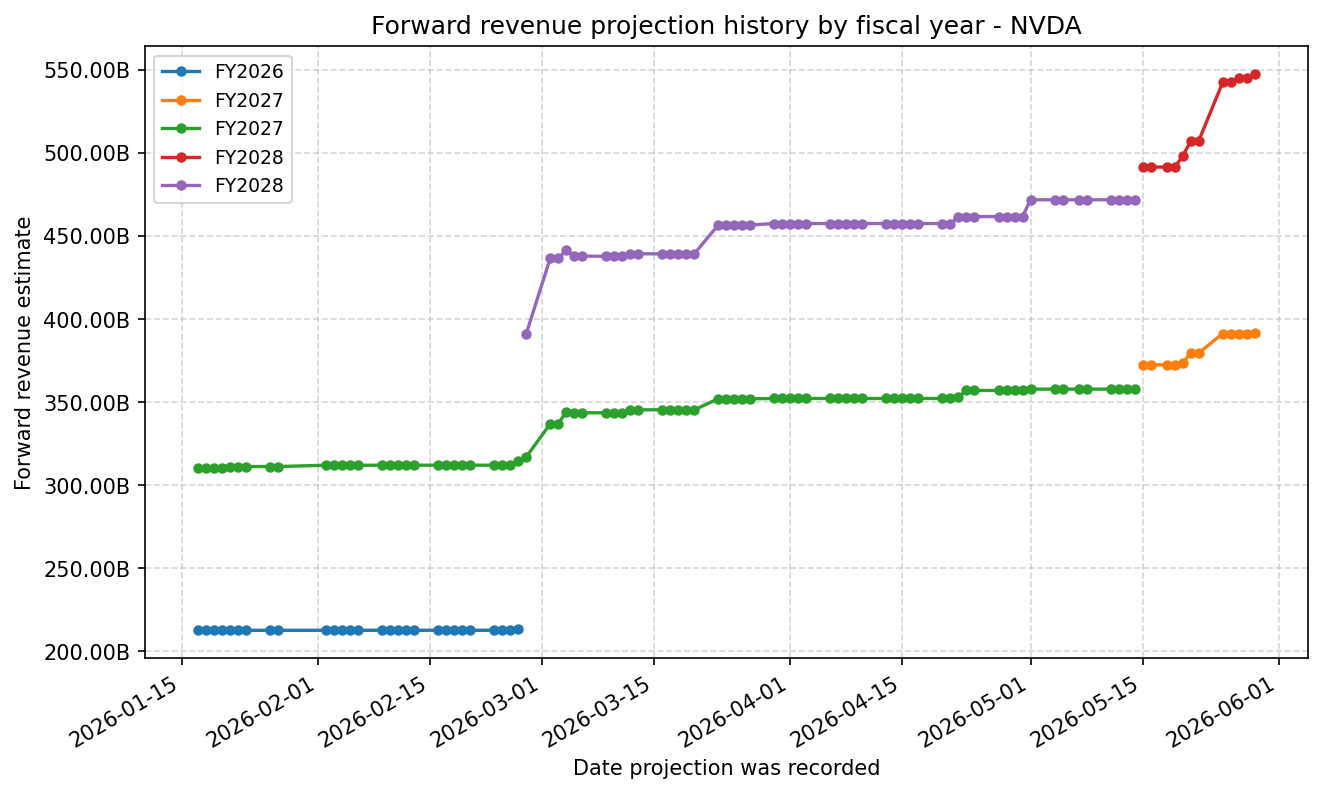
Forward Estimate History
How the next-FY EPS and revenue estimates have drifted over time. One line per fiscal year – past lines end when that FY became current.
Expenses
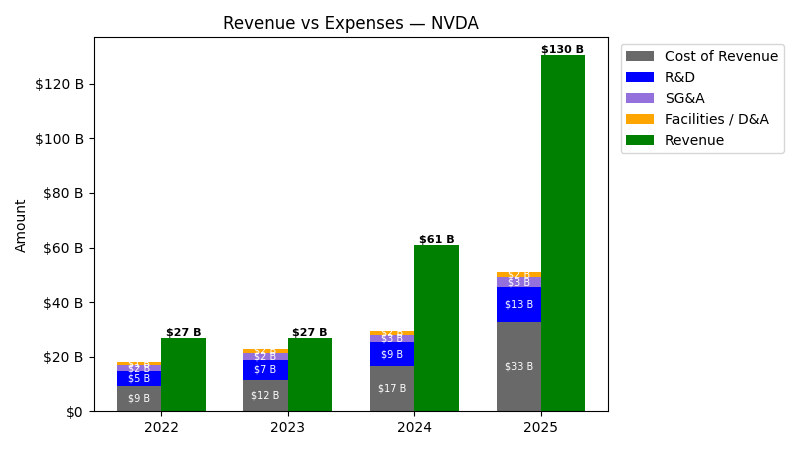
| Year | Revenue ($) | Cost of Revenue ($) | R&D ($) | SG&A ($) | Facilities / D&A ($) |
|---|---|---|---|---|---|
| 2023 | $27.0B | $10.1B | $7.3B | $2.4B | $1.5B |
| 2024 | $60.9B | $15.1B | $8.7B | $2.7B | $1.5B |
| 2025 | $130.5B | $30.8B | $12.9B | $3.5B | $1.9B |
| 2026 | $215.9B | $59.6B | $18.5B | $4.6B | $2.8B |
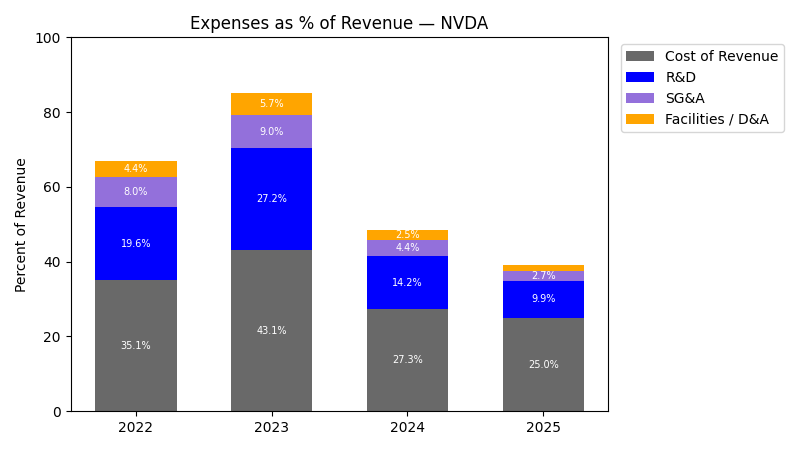
| Year | Revenue Change (%) | Cost of Revenue Change (%) | R&D Change (%) | SG&A Change (%) | Facilities / D&A Change (%) |
|---|---|---|---|---|---|
| 2024 | 125.85 | 50.00 | 18.20 | 8.77 | -2.27 |
| 2025 | 114.20 | 103.63 | 48.86 | 31.54 | 23.61 |
| 2026 | 65.47 | 93.77 | 43.23 | 31.17 | 52.52 |
No unmapped expenses.
Segment Performance
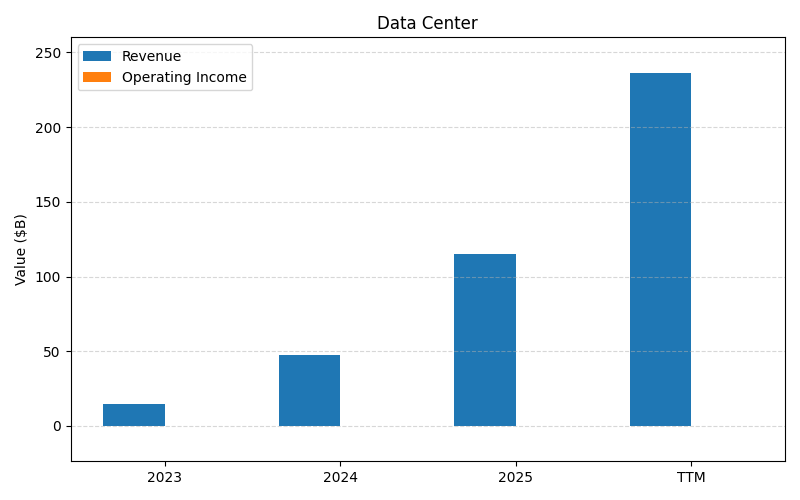
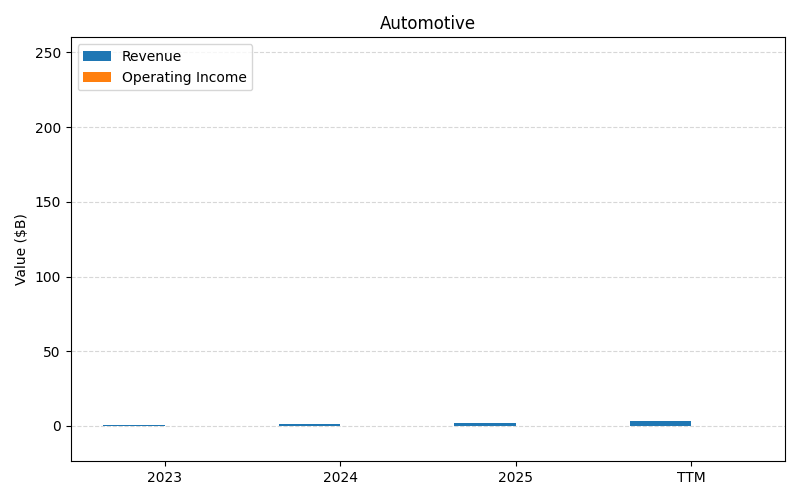
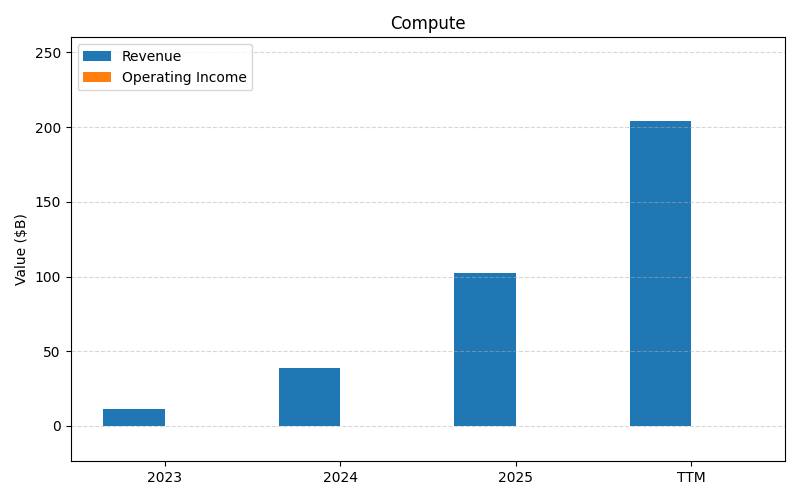
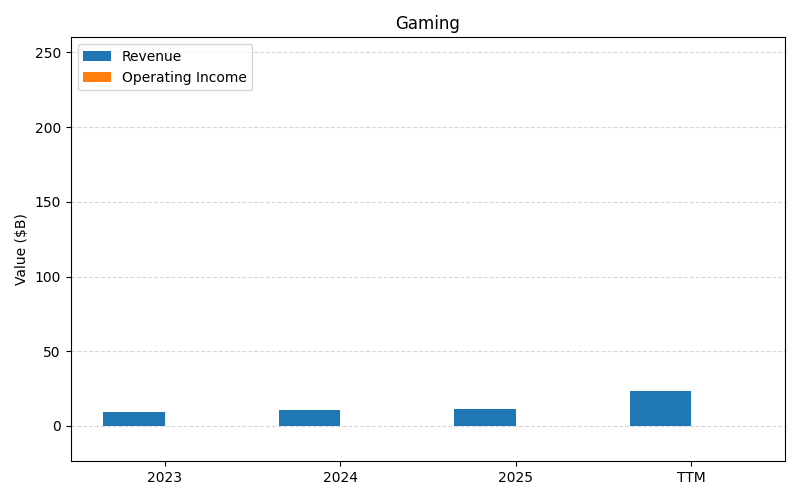
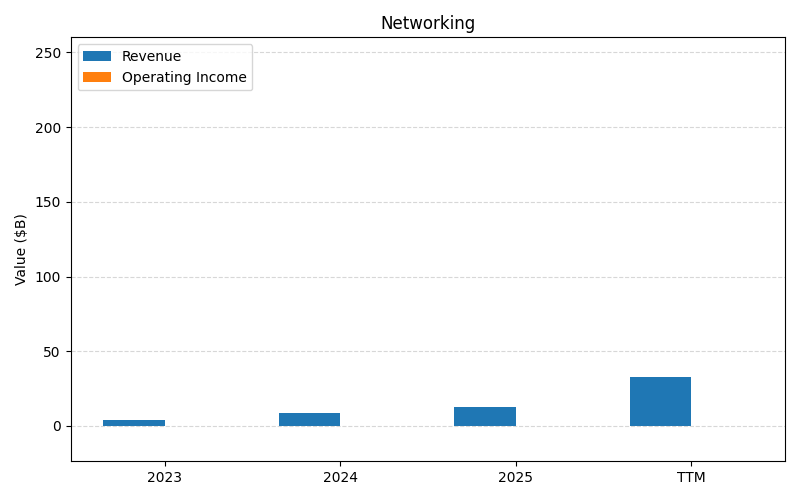
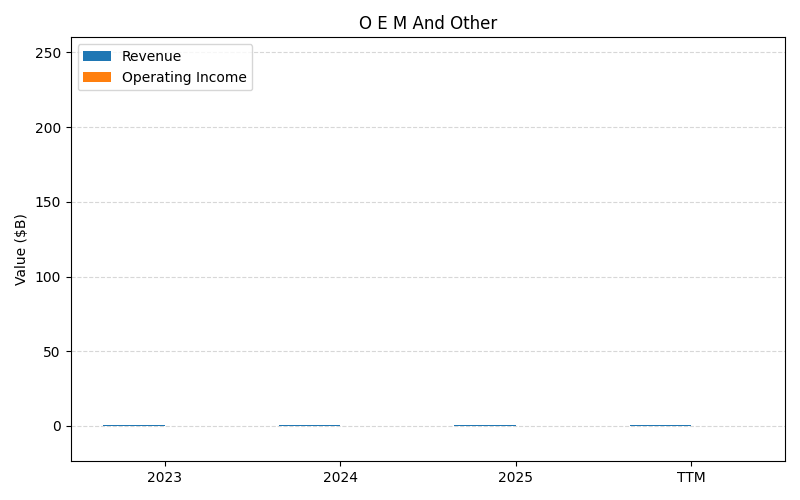
SEGMENTS v2025-09-09 · 2026-05-29 09:12 UTC — Units: $B. Rows list fiscal years (last 3 + TTM) with revenue for each segment; the final row shows the TTM revenue mix (operating income columns display “—” where mix is not applicable).
| Year | Data Center Rev | Automotive Rev | Compute Rev | Gaming Rev | Networking Rev | O E M And Other Rev | Professional Visualization Rev | Total Rev |
|---|---|---|---|---|---|---|---|---|
| 2024 | 47.5B | 1.09B | 39B | 10.4B | 8.57B | 0.31B | 1.55B | 108.4B |
| 2025 | 115.2B | 1.69B | 102.2B | 11.3B | 13B | 0.39B | 1.88B | 245.7B |
| 2026 | 193.7B | 2.35B | 162.4B | 16B | 31.4B | 0.62B | 3.19B | 409.7B |
| TTM | 423.3B | – | – | – | – | – | – | 423.3B |
| % of Total (TTM) | 100.0% | – | – | – | – | – | – | 100% |
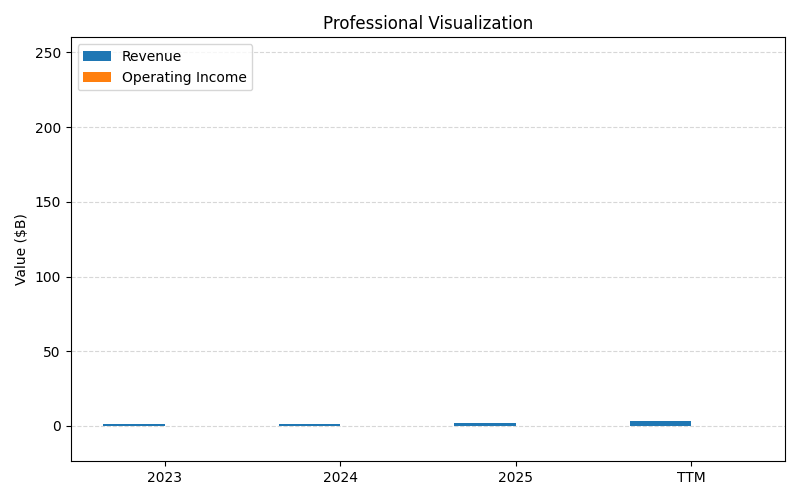
Segment Performance (Axis 2)
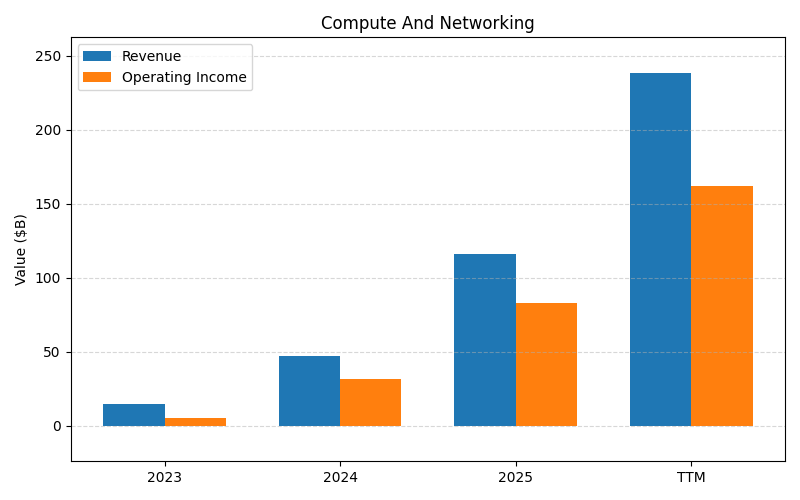
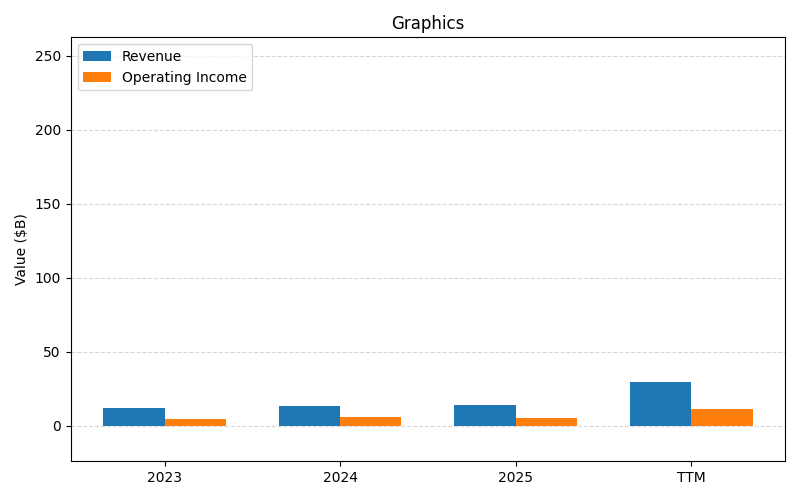
SEGMENTS v2025-09-09 · 2026-05-29 09:12 UTC — Units: $B. Rows list fiscal years (last 3 + TTM) with revenue and operating income for each segment; the final row shows the TTM revenue mix (operating income columns display “—” where mix is not applicable).
| Year | Compute And Networking Rev | Compute And Networking OI | Graphics Rev | Graphics OI | Total Rev | Total OI |
|---|---|---|---|---|---|---|
| 2024 | 47.4B | 32B | 13.5B | 5.85B | 60.9B | 37.9B |
| 2025 | 116.2B | 82.9B | 14.3B | 5.08B | 130.5B | 88B |
| 2026 | 193.5B | 130.1B | 22.5B | 9.16B | 215.9B | 139.3B |
| TTM | 423.8B | 288.4B | 48.3B | 18.8B | 472.1B | 307.2B |
| % of Total (TTM) | 89.8% | — | 10.2% | — | 100% | — |
Balance Sheet
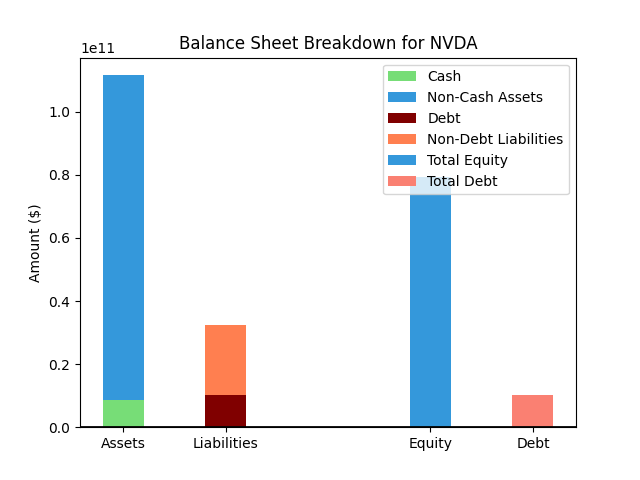
| Metric | Value | |
|---|---|---|
| 0 | Total Assets | $259,474M |
| 1 | Cash | $13,237M |
| 2 | Total Liabilities | $64,000M |
| 3 | Total Debt | $12,348M |
| 4 | Total Equity | $195,474M |
| 5 | Debt to Equity Ratio | 0.06 |
EPS & Dividend
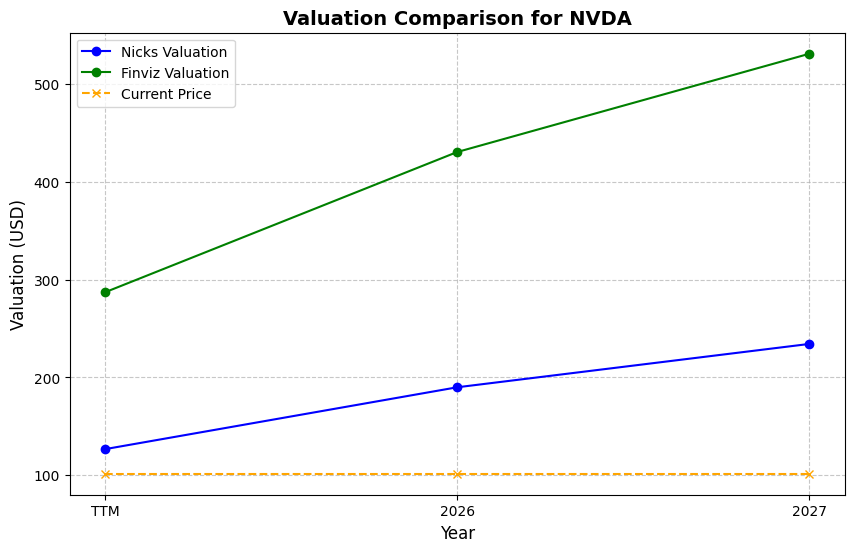
Valuation
| Share Price | Treasury Yield | Estimates | Fair Value (P/E) | Fair Value (P/S) | Current P/S | Current P/E |
|---|---|---|---|---|---|---|
| $211.14 | 4.5% | Nicks Growth: 20% Nick's Expected Margin: 30% FINVIZ Growth: 44% |
Nicks: 42 Finviz: 281 |
Nick's: 12.726 | 20.2 | 32.3 |
| Basis | Year | Nicks Valuation | Nicks vs Share Price | Finviz Valuation | Finviz vs Share Price |
|---|---|---|---|---|---|
| $6.53 EPS | TTM | $277.01 | 31.2% | $1835.16 | 769.2% |
| $8.94 EPS | 2027 | $379.36 | 79.7% | $2513.21 | 1090.3% |
| $12.66 EPS | 2028 | $536.95 | 154.3% | $3557.20 | 1584.8% |
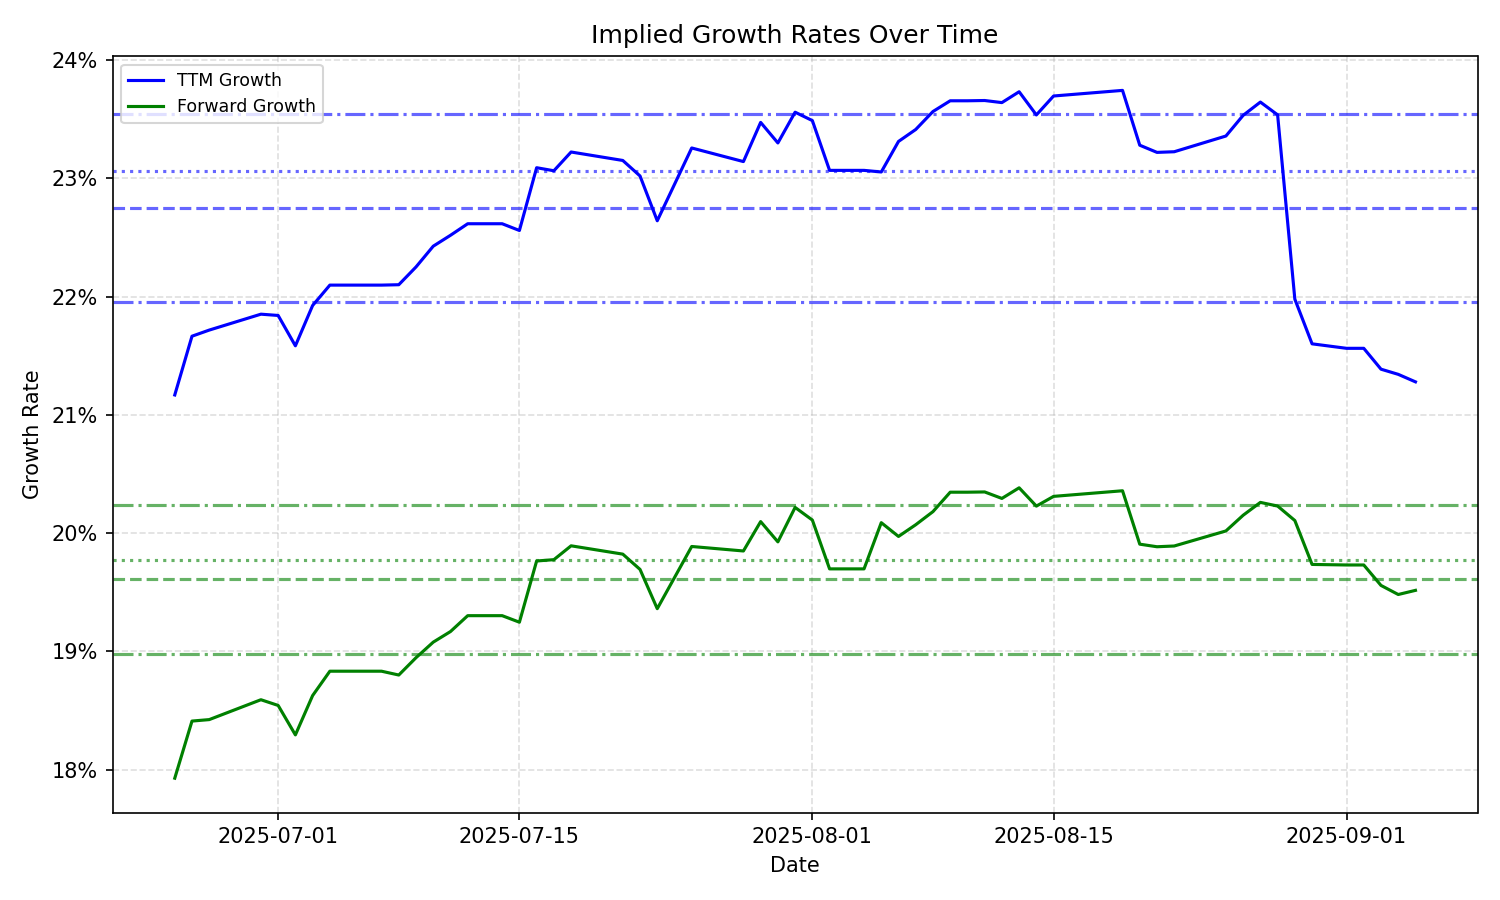
Implied Growth
| Average | Median | Std Dev | Current | Percentile | ||||||
|---|---|---|---|---|---|---|---|---|---|---|
| TTM | Forward | TTM | Forward | TTM | Forward | TTM | Forward | TTM | Forward | |
| Timeframe | ||||||||||
| 1 Year | 20.97% | 16.00% | 20.97% | 18.83% | 1.74% | 4.48% | 17.07% | 9.86% | 0.8% | 14.5% |
| 3 Years | 20.97% | 16.00% | 20.97% | 18.83% | 1.74% | 4.48% | 17.07% | 9.86% | 0.8% | 14.5% |
| 5 Years | 20.97% | 16.00% | 20.97% | 18.83% | 1.74% | 4.48% | 17.07% | 9.86% | 0.8% | 14.5% |
| 10 Years | 20.97% | 16.00% | 20.97% | 18.83% | 1.74% | 4.48% | 17.07% | 9.86% | 0.8% | 14.5% |