Nucor Corporation — NUE
| Close Price | Market Cap | P/E Ratio | Forward P/E Ratio | Implied Growth* | Implied Forward Growth* | Dividend | P/B Ratio |
|---|---|---|---|---|---|---|---|
| $250.00 | $56.94B | 24.8 | 15.8 | 14.0% | 9.2% | $2.24 0.9% | 2.7 |
Latest Headlines
- · Are You Looking for a Top Momentum Pick? Why Nucor (NUE) is a Great Choice
- · What Makes CF Industries Stock a Solid Investment Option Now?
- · Buy 5 Non-AI Stocks That Have Surged Year to Date to Tap Market Rally
- · Why Is Nucor (NUE) Up 6.7% Since Last Earnings Report?
- · The Best Warren Buffett Stocks to Buy With $300 Right Now
- · Here Are Tuesday’s Top Wall Street Analyst Research Calls: Albemarle, Booz Allen Hamilton, Cigna, DT Midstream, GE Vernova, Intel, Okta, Travelers, Occidental Petroleum, and More
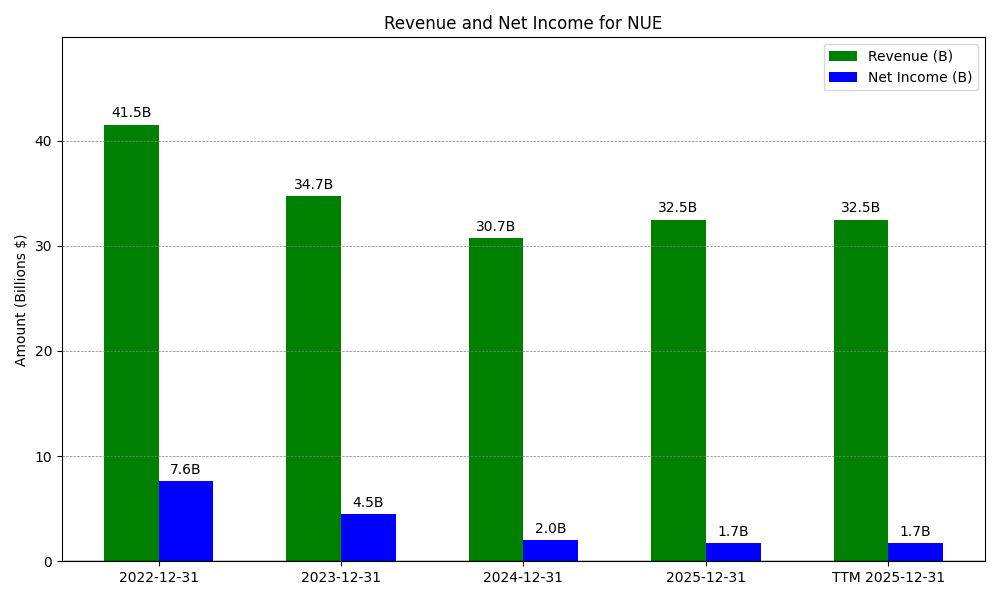
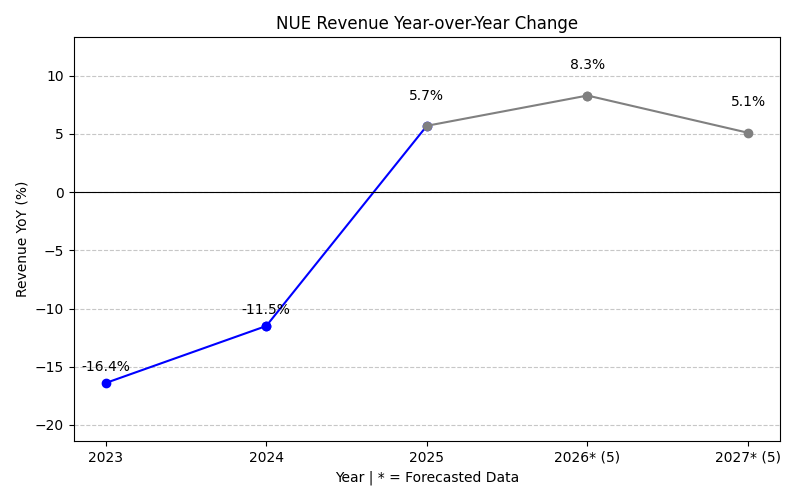
Revenue & Net Income
| Date | Revenue | Net_Income | EPS | Last_Updated | Revenue_Change | Net_Income_Change | EPS_Change | |
|---|---|---|---|---|---|---|---|---|
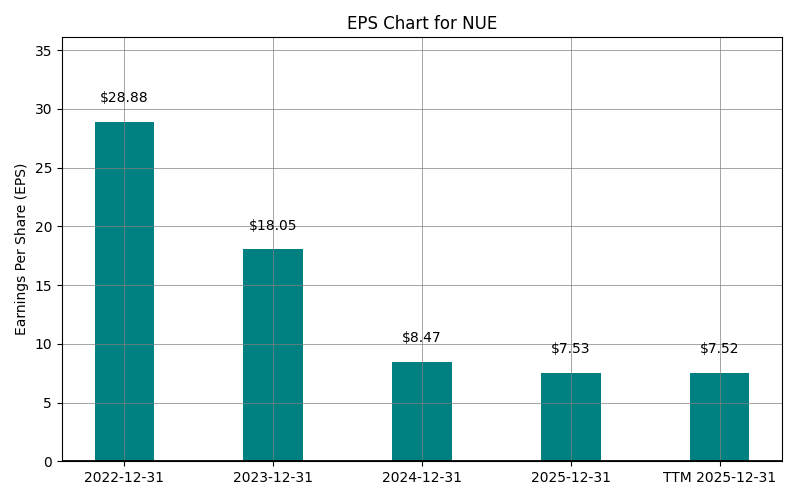
| 0 | 2022-12-31 | $41,512M | $7,607M | $28.88 | 2026-05-29 09:12:45 | N/A | N/A | N/A |
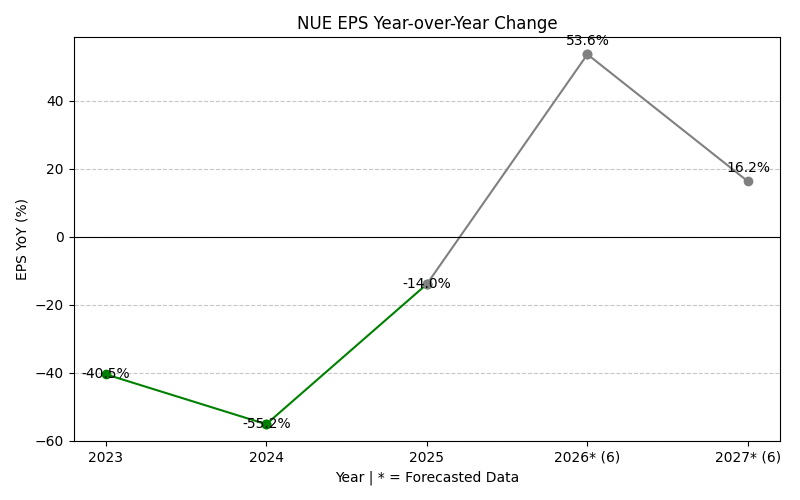
| 1 | 2023-12-31 | $34,714M | $4,525M | $18.05 | 2026-05-29 09:12:45 | -16.4% | -40.5% | -37.5% |
| 2 | 2024-12-31 | $30,734M | $2,027M | $8.47 | 2026-05-29 09:12:45 | -11.5% | -55.2% | -53.1% |
| 3 | 2025-12-31 | $32,494M | $1,744M | $7.53 | 2026-05-29 09:12:45 | 5.7% | -14.0% | -11.1% |
| 4 | TTM 2026-03-31 | $34,160M | $2,331M | $10.07 | 2026-04-29 08:52:12 | 5.1% | 33.7% | 33.7% |
EPS
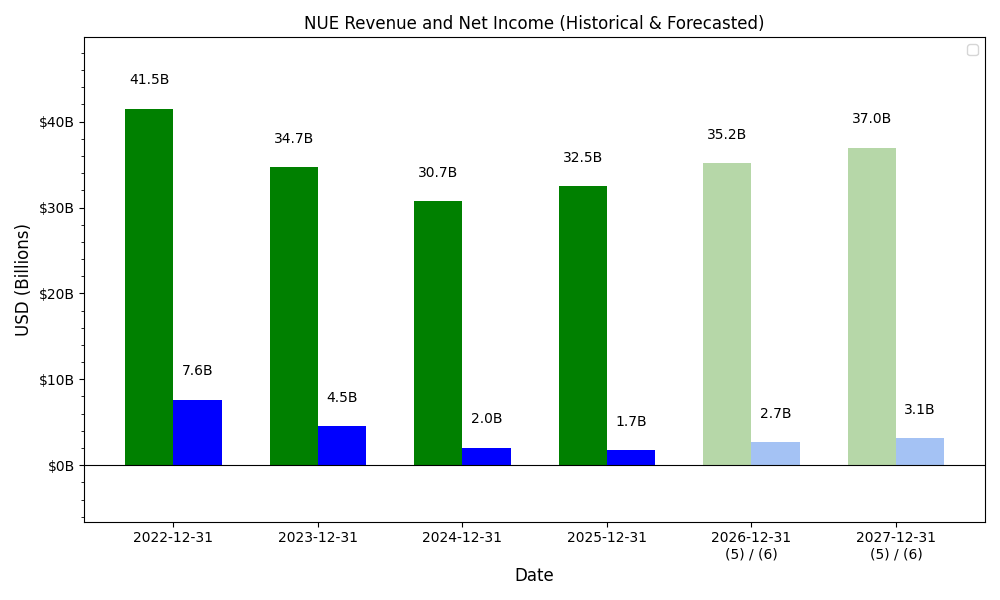
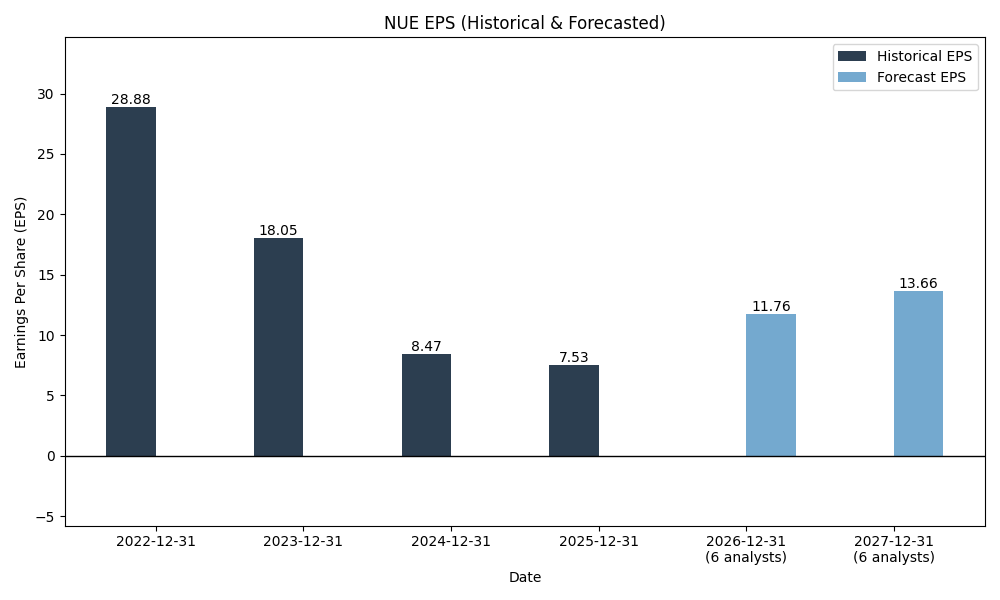
Forecasts
Y/Y % Change
NUE Year-over-Year Growth
| 2022 | 2023 | 2024 | 2025 | 2026 | 2027 | Average | |
|---|---|---|---|---|---|---|---|
| Revenue Growth (%) | -16.4% | -11.5% | 5.7% | 17.1% | 1.8% | -0.7% | |
| Revenue Analysts (#) | 0 | 0 | 0 | 0 | 13 | 13 | |
| EPS Growth (%) | -40.5% | -55.2% | -14.0% | 90.8% | 8.1% | -2.2% | |
| EPS Analysts (#) | 0 | 0 | 0 | 0 | 13 | 12 |
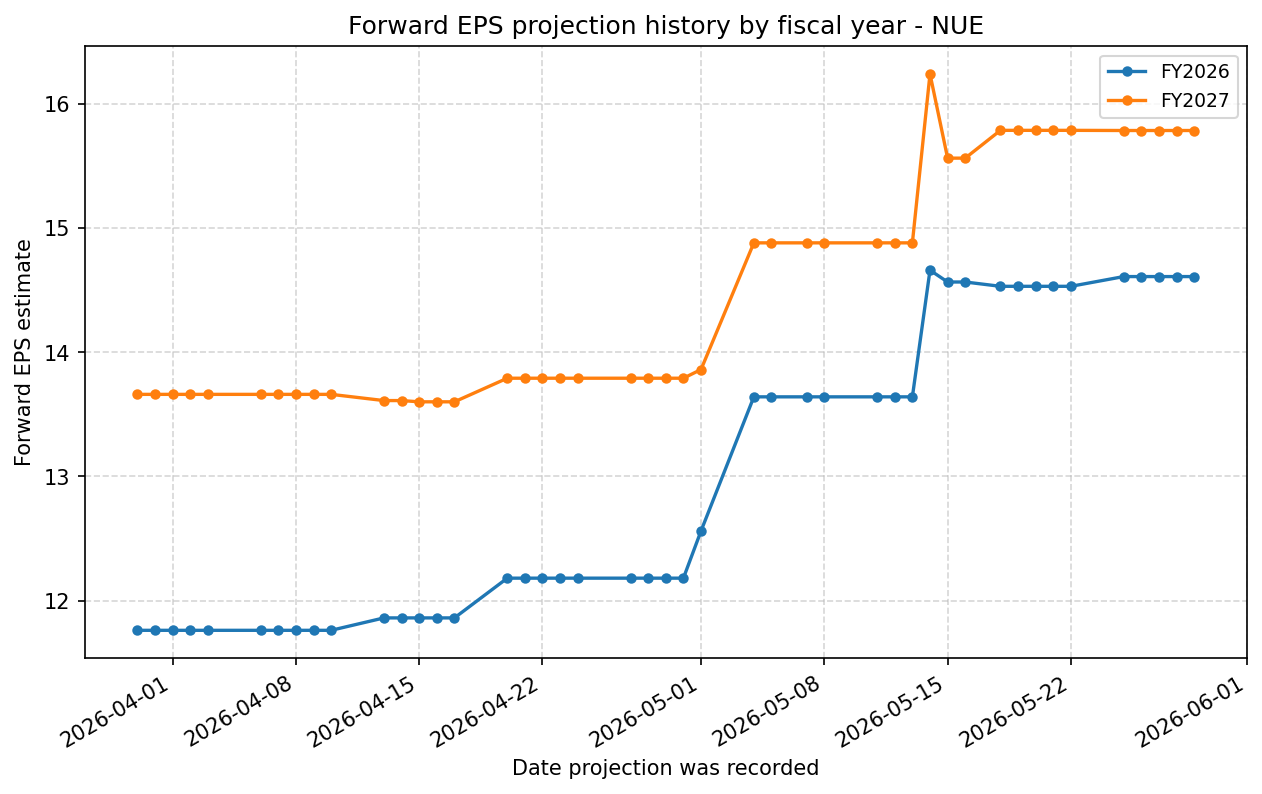
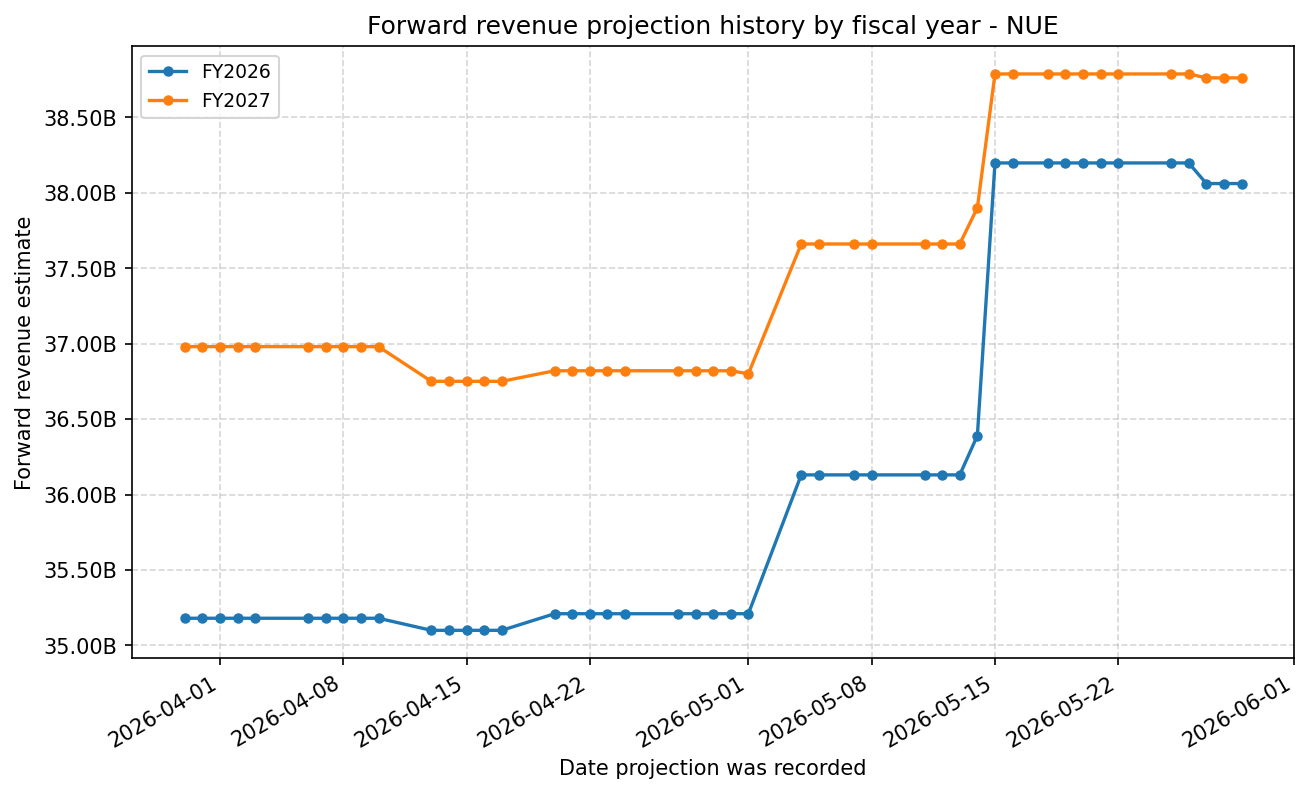
Forward Estimate History
How the next-FY EPS and revenue estimates have drifted over time. One line per fiscal year – past lines end when that FY became current.
Expenses
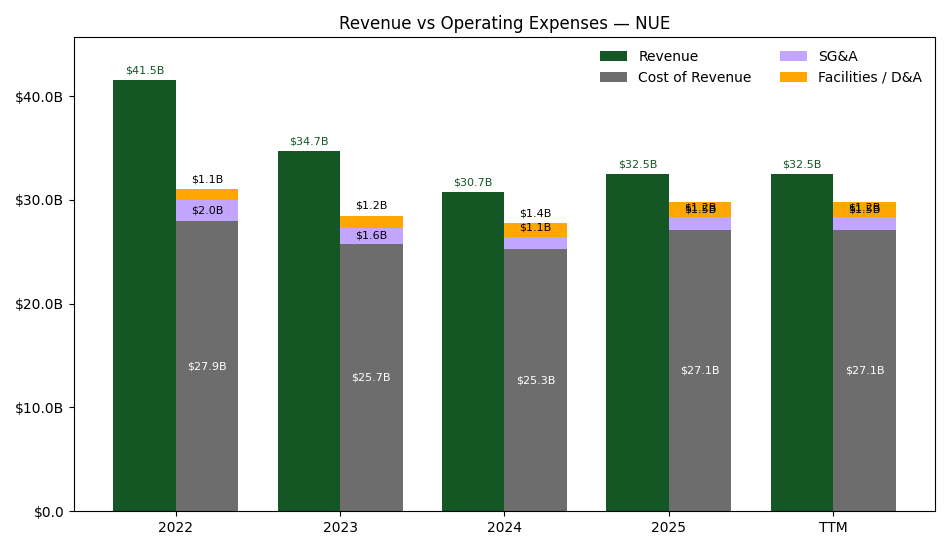
| Year | Revenue ($) | Cost of Revenue ($) | SG&A ($) | Facilities / D&A ($) |
|---|---|---|---|---|
| 2022 | $41.5B | $27.9B | $2.0B | $1.1B |
| 2023 | $34.7B | $25.7B | $1.6B | $1.2B |
| 2024 | $30.7B | $25.3B | $1.1B | $1.4B |
| 2025 | $32.5B | $27.1B | $1.2B | $1.5B |
| TTM | $34.2B | $27.9B | $1.3B | $1.5B |
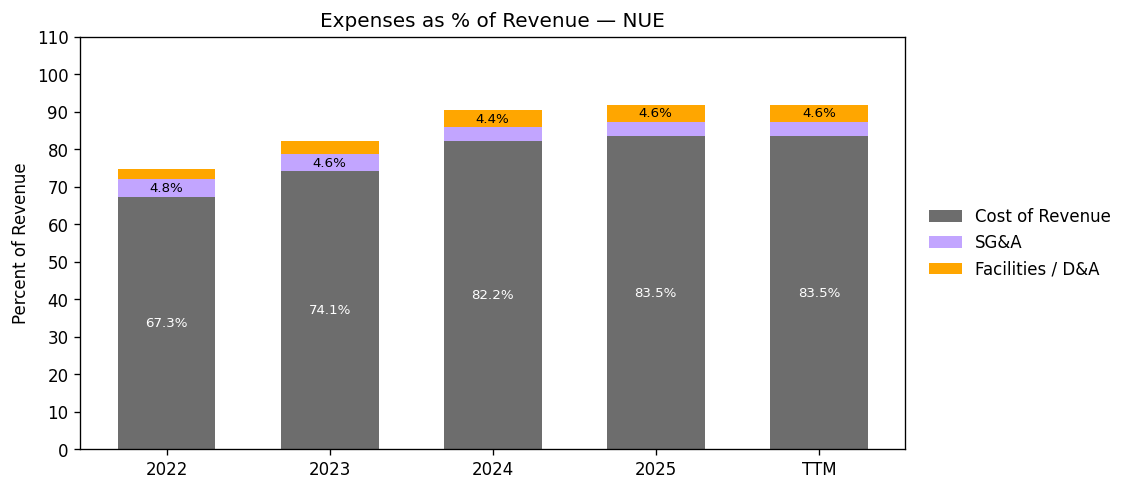
| Year | Revenue Change (%) | Cost of Revenue Change (%) | SG&A Change (%) | Facilities / D&A Change (%) |
|---|---|---|---|---|
| 2023 | -16.38 | -7.93 | -20.63 | 10.08 |
| 2024 | -11.47 | -1.76 | -29.15 | 16.00 |
| 2025 | 5.73 | 7.36 | 8.55 | 9.14 |
| TTM | 5.13 | 2.78 | 7.96 | 1.08 |
No unmapped expenses.
Segment Performance
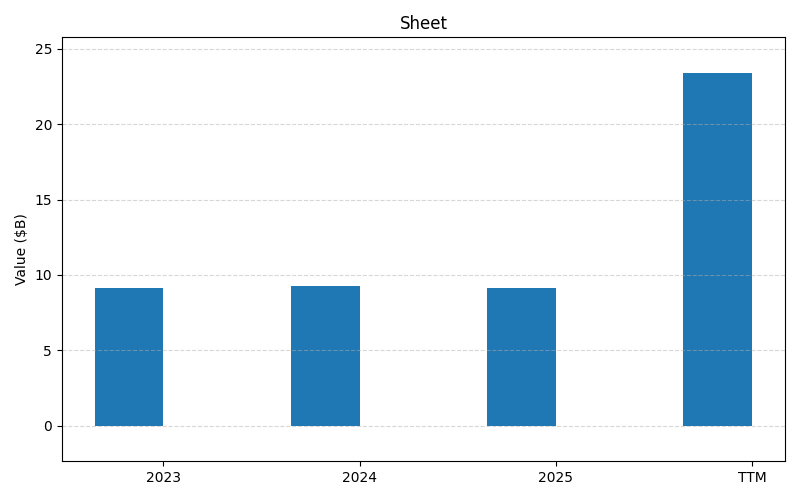
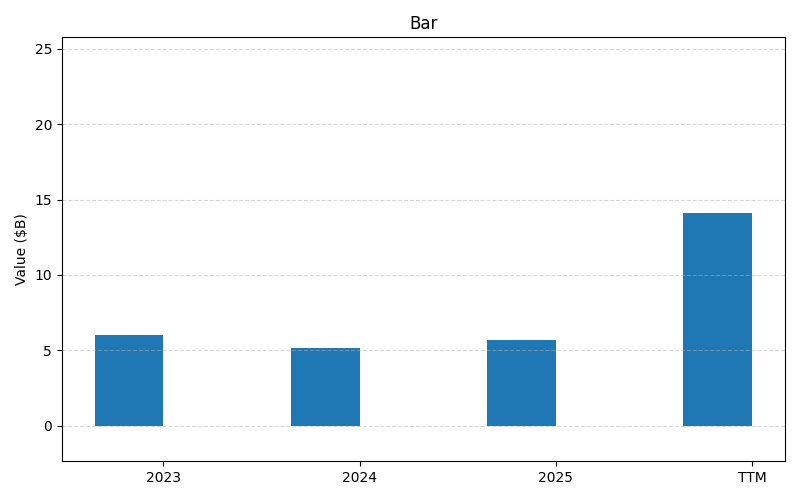
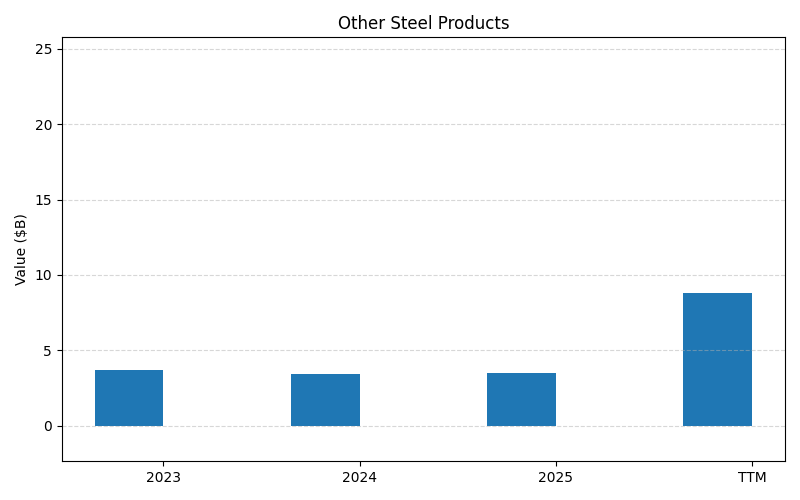
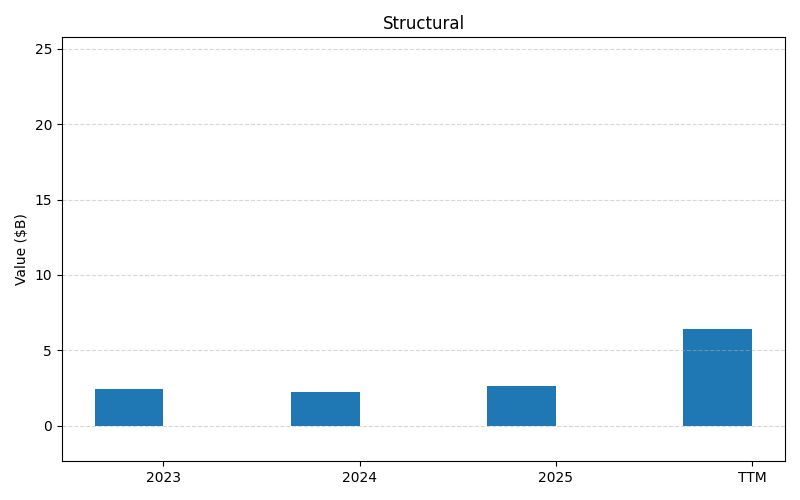
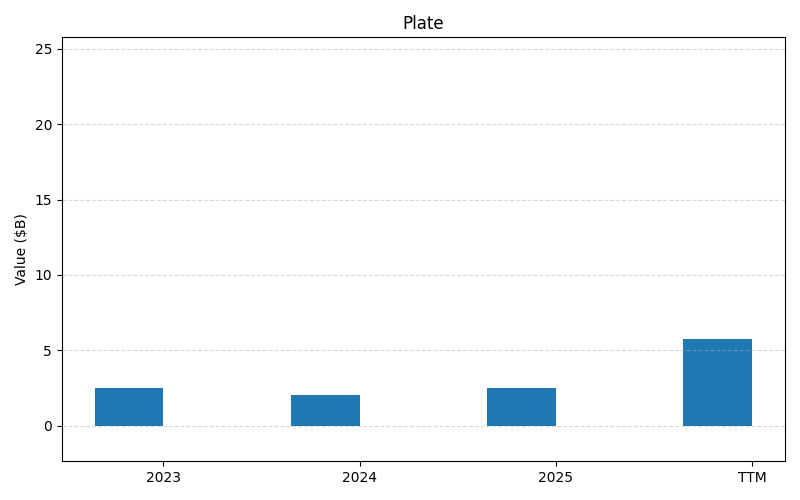
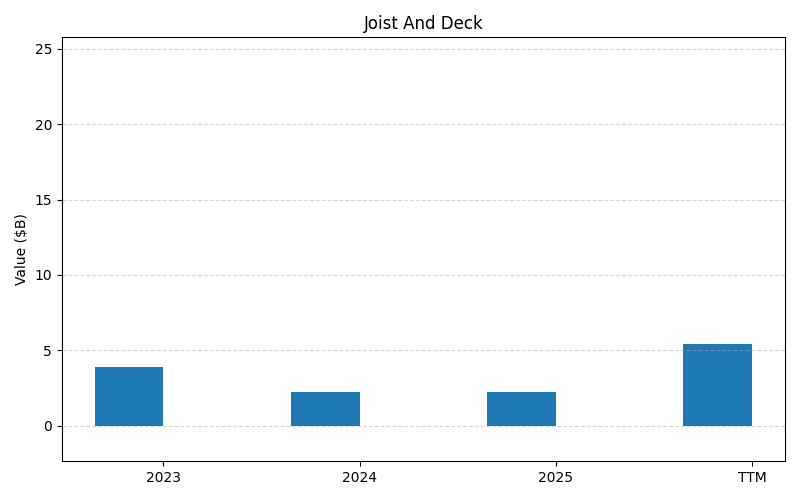
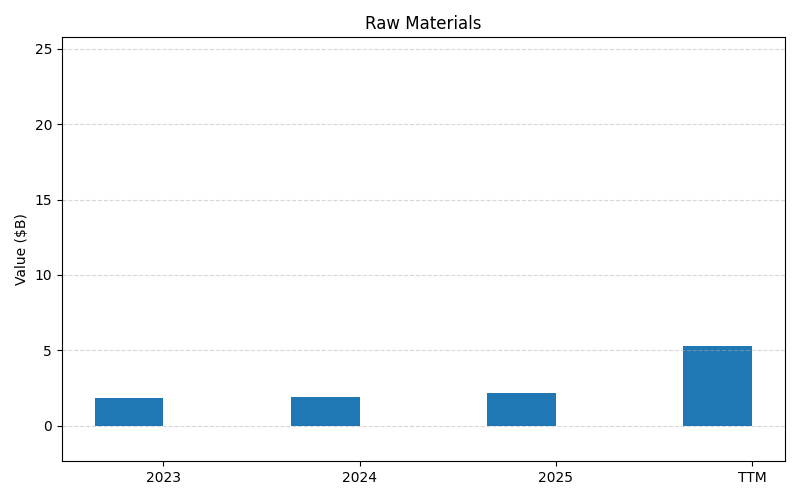
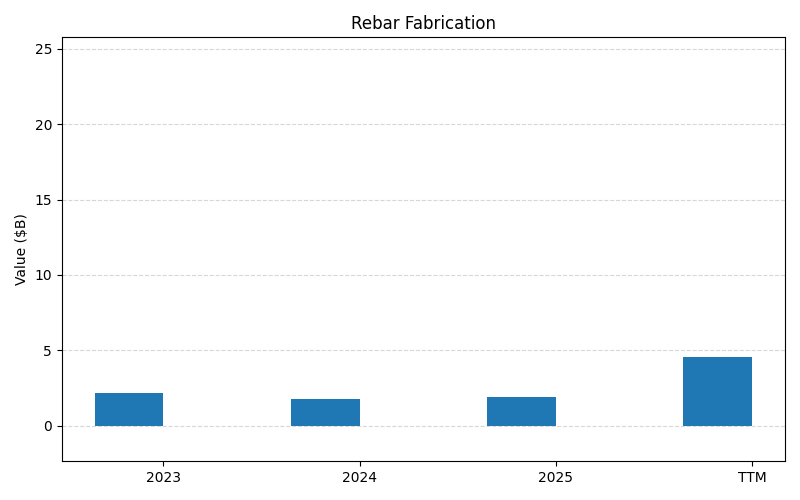
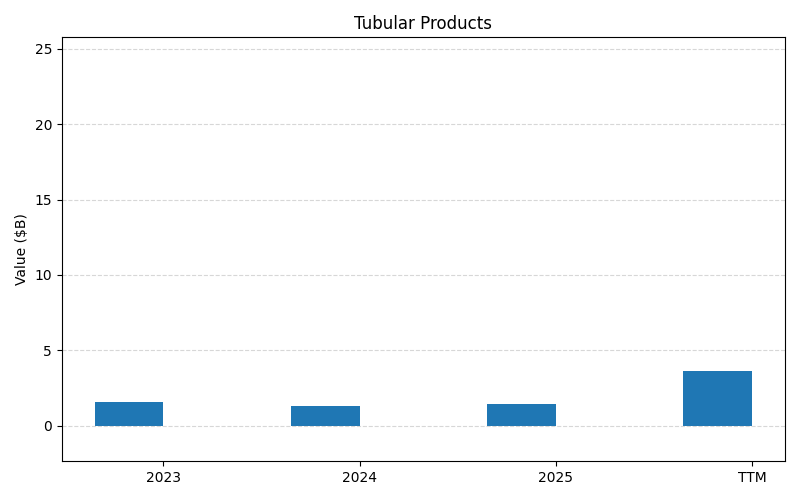
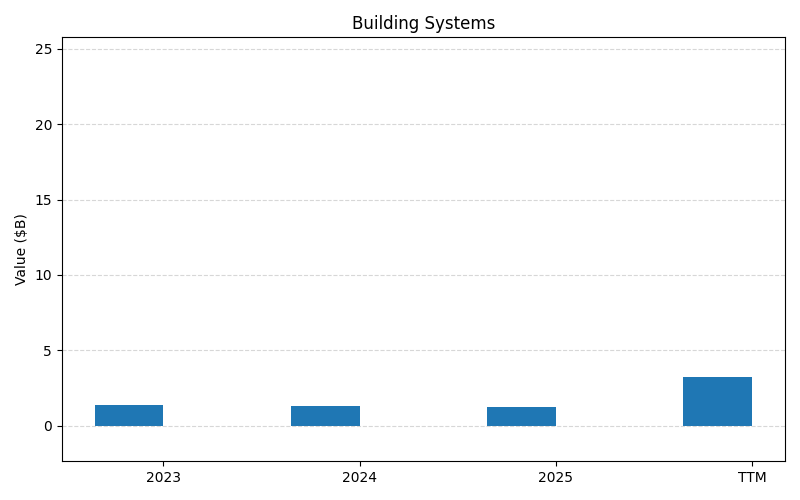
SEGMENTS v2025-09-09 · 2026-05-29 09:12 UTC — Units: $B. Rows list fiscal years (last 3 + TTM) with revenue for each segment; the final row shows the TTM revenue mix (operating income columns display “—” where mix is not applicable).
| Year | Sheet Rev | Bar Rev | Other Steel Products Rev | Structural Rev | Plate Rev | Joist And Deck Rev | Raw Materials Rev | Rebar Fabrication Rev | Tubular Products Rev | Building Systems Rev | Total Rev |
|---|---|---|---|---|---|---|---|---|---|---|---|
| 2023 | 9.15B | 5.99B | 3.69B | 2.43B | 2.52B | 3.92B | 1.86B | 2.18B | 1.59B | 1.38B | 34.7B |
| 2024 | 9.25B | 5.19B | 3.44B | 2.28B | 2.02B | 2.23B | 1.92B | 1.78B | 1.29B | 1.35B | 30.7B |
| 2025 | 9.16B | 5.72B | 3.52B | 2.63B | 2.49B | 2.22B | 2.16B | 1.91B | 1.43B | 1.25B | 32.5B |
| TTM | 23.4B | 14.1B | 8.81B | 6.41B | 5.78B | 5.40B | 5.27B | 4.57B | 3.61B | 3.21B | 80.6B |
| % of Total (TTM) | 29.1% | 17.5% | 10.9% | 8.0% | 7.2% | 6.7% | 6.5% | 5.7% | 4.5% | 4.0% | 100% |
Segment Performance (Axis 2)
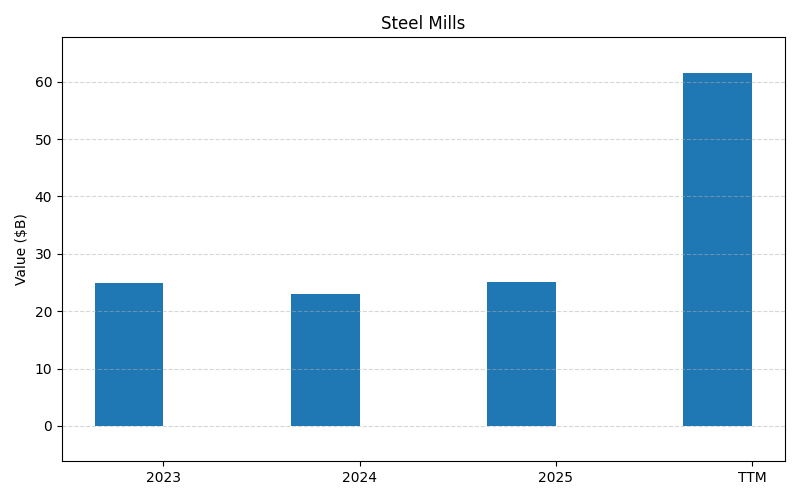
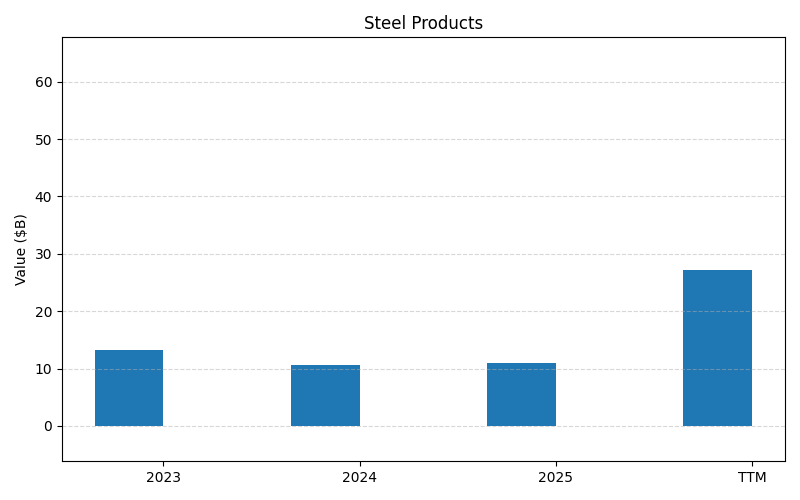
SEGMENTS v2025-09-09 · 2026-05-29 09:12 UTC — Units: $B. Rows list fiscal years (last 3 + TTM) with revenue for each segment; the final row shows the TTM revenue mix (operating income columns display “—” where mix is not applicable).
| Year | Steel Mills Rev | Steel Products Rev | Total Rev |
|---|---|---|---|
| 2023 | 24.9B | 13.2B | 38.1B |
| 2024 | 23B | 10.6B | 33.7B |
| 2025 | 25.1B | 11B | 36B |
| TTM | 61.6B | 27.2B | 88.7B |
| % of Total (TTM) | 69.4% | 30.6% | 100% |
Balance Sheet
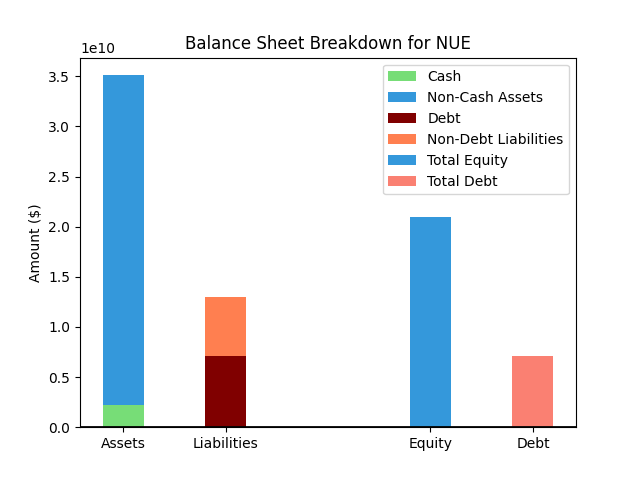
| Metric | Value | |
|---|---|---|
| 0 | Total Assets | $35,104M |
| 1 | Cash | $2,260M |
| 2 | Total Liabilities | $12,980M |
| 3 | Total Debt | $7,121M |
| 4 | Total Equity | $20,936M |
| 5 | Debt to Equity Ratio | 0.34 |
EPS & Dividend

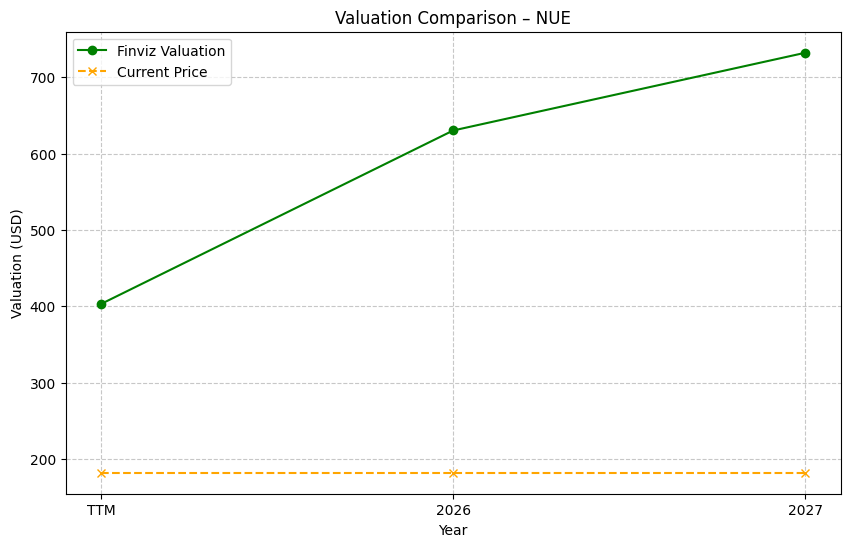
Valuation
| Share Price | Treasury Yield | Estimates | Fair Value (P/E) | Fair Value (P/S) | Current P/S | Current P/E |
|---|---|---|---|---|---|---|
| $250.00 | 4.5% | FINVIZ Growth: 29% | Nicks: 6 Finviz: 91 |
Nick's: 0.000 | 1.7 | 24.8 |
| Basis | Year | Nicks Valuation | Nicks vs Share Price | Finviz Valuation | Finviz vs Share Price |
|---|---|---|---|---|---|
| $10.07 EPS | TTM | $63.86 | -74.5% | $915.35 | 266.1% |
| $14.61 EPS | 2026 | $92.64 | -62.9% | $1327.90 | 431.2% |
| $15.78 EPS | 2027 | $100.09 | -60.0% | $1434.81 | 473.9% |
Implied Growth
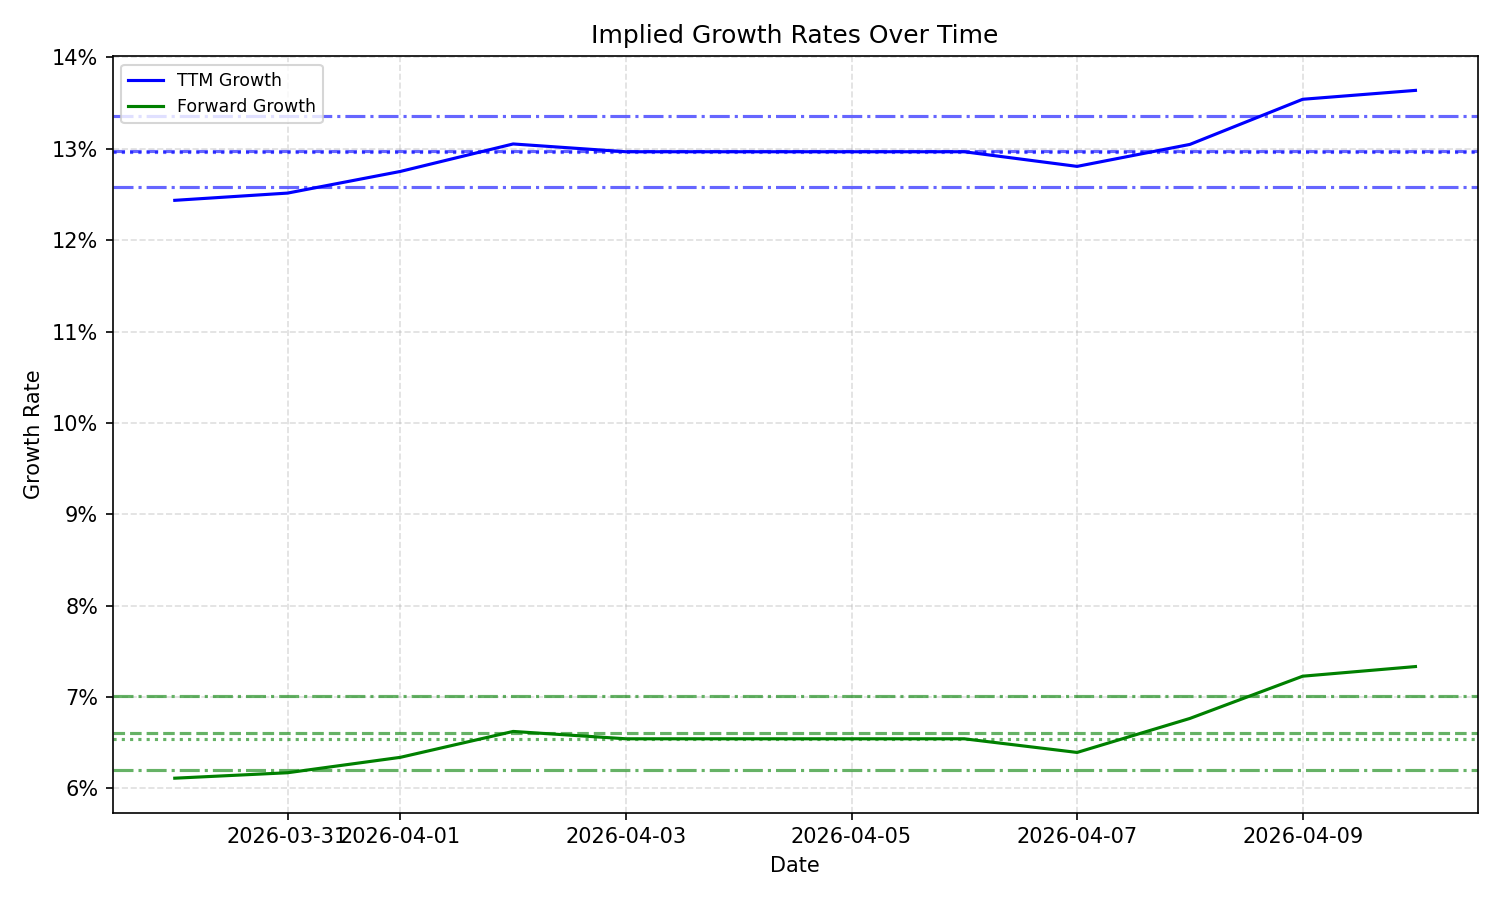
| Average | Median | Std Dev | Current | Percentile | ||||||
|---|---|---|---|---|---|---|---|---|---|---|
| TTM | Forward | TTM | Forward | TTM | Forward | TTM | Forward | TTM | Forward | |
| Timeframe | ||||||||||
| 1 Year | 13.39% | 7.90% | 13.05% | 8.23% | 0.77% | 0.84% | 13.94% | 9.13% | 77.8% | 100.0% |
| 3 Years | 13.39% | 7.90% | 13.05% | 8.23% | 0.77% | 0.84% | 13.94% | 9.13% | 77.8% | 100.0% |
| 5 Years | 13.39% | 7.90% | 13.05% | 8.23% | 0.77% | 0.84% | 13.94% | 9.13% | 77.8% | 100.0% |
| 10 Years | 13.39% | 7.90% | 13.05% | 8.23% | 0.77% | 0.84% | 13.94% | 9.13% | 77.8% | 100.0% |