Northrop Grumman Corporation — NOC
| Close Price | Market Cap | P/E Ratio | Forward P/E Ratio | Implied Growth* | Implied Forward Growth* | Dividend | P/B Ratio |
|---|---|---|---|---|---|---|---|
| $563.68 | $80.06B | 17.7 | 18.7 | 10.3% | 10.9% | $9.40 1.7% | 4.7 |
Latest Headlines
- · RTX Is Set to Revolutionize Munitions Manufacturing
- · RTX (RTX)’s The Javelin Joint Venture Makes its First LWCLU Delivery
- · This High-Yield Defense Stock Just Hiked Its Dividend Nearly 7%
- · The SpaceX Halo Effect: What’s Next For Sky-High Redwire Stock?
- · Northrop Grumman Extends Sensors And Missile Role With European Defense Push
- · 3 Defense Giants Boosting Dividends as Shares Take a Ride
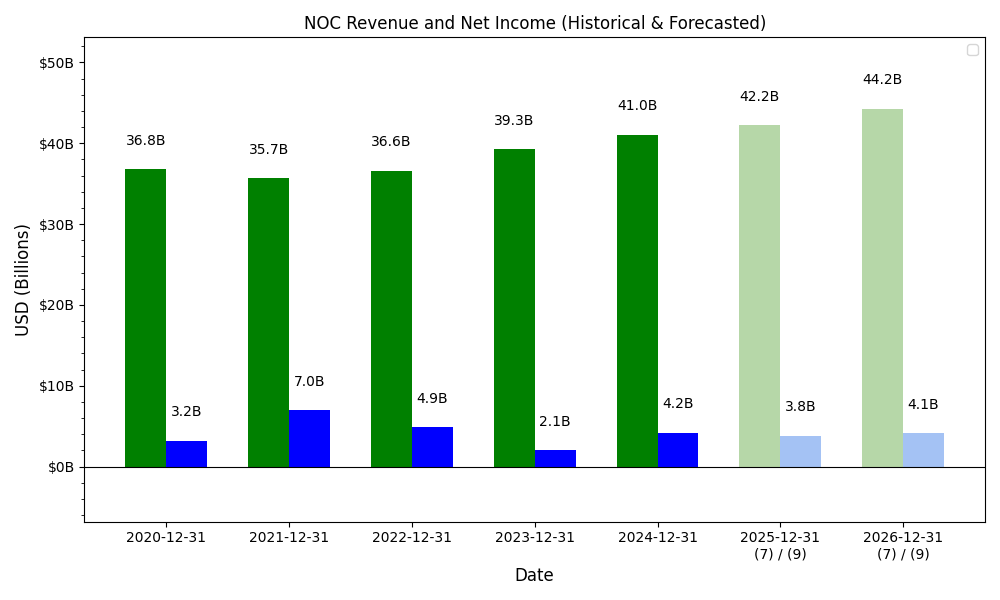
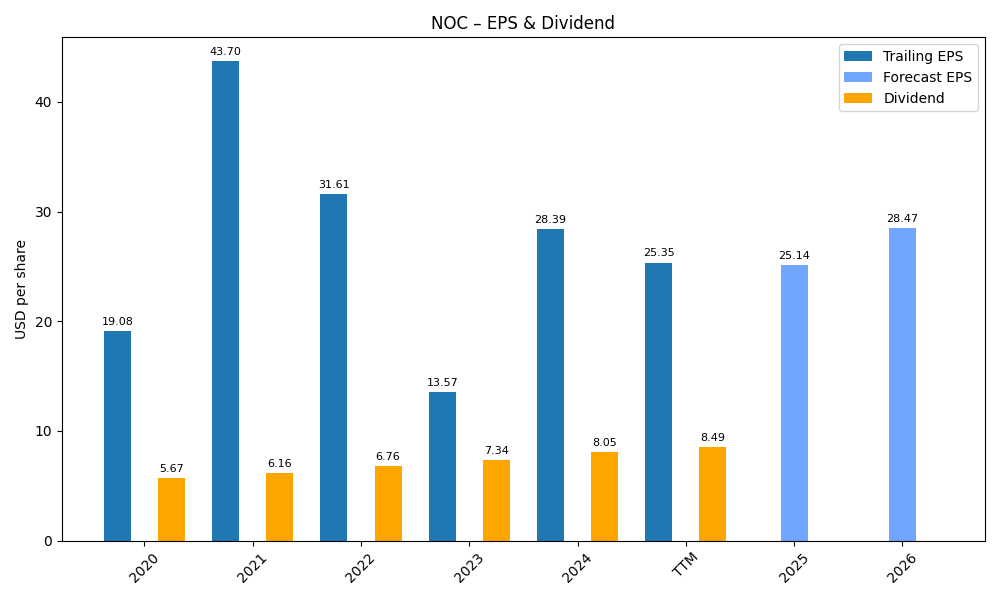
Revenue & Net Income
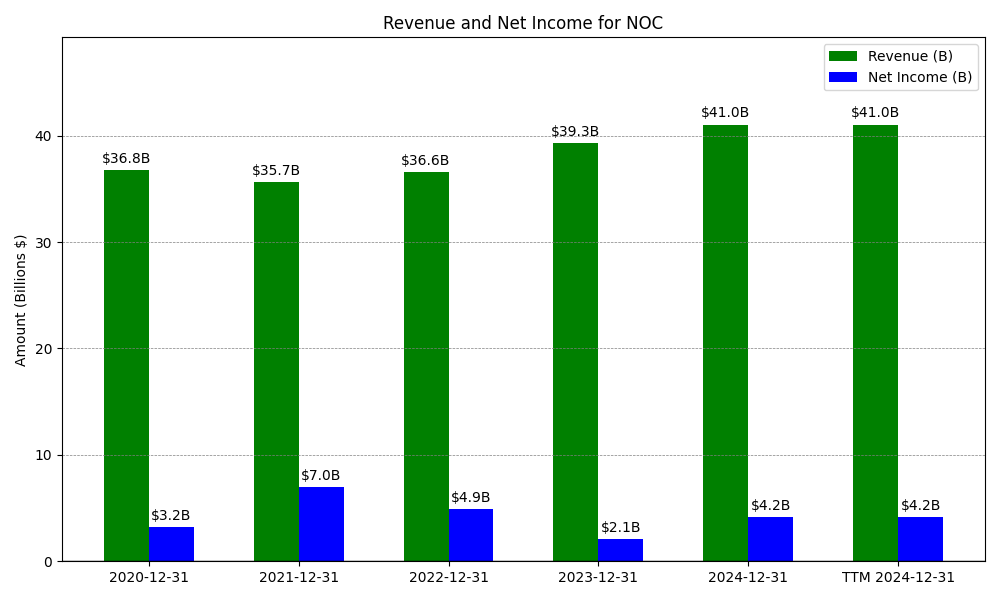
| Date | Revenue | Net_Income | EPS | Last_Updated | Revenue_Change | Net_Income_Change | EPS_Change | |
|---|---|---|---|---|---|---|---|---|
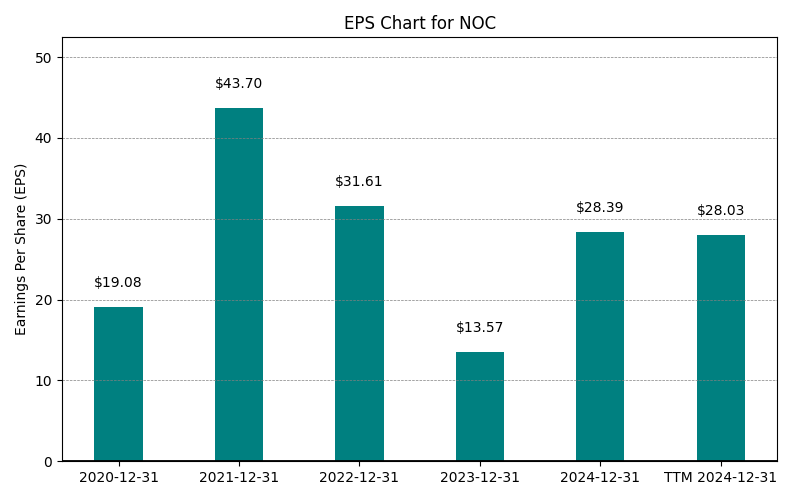
| 0 | 2020-12-31 | $36,799M | $3,189M | $19.08 | 2024-02-09 04:07:16 | N/A | N/A | N/A |
| 1 | 2021-12-31 | $35,667M | $7,005M | $43.70 | 2024-02-09 04:07:16 | -3.1% | 119.7% | 129.0% |
| 2 | 2022-12-31 | $36,602M | $4,896M | $31.61 | 2026-05-29 09:12:38 | 2.6% | -30.1% | -27.7% |
| 3 | 2023-12-31 | $39,290M | $2,056M | $13.57 | 2026-05-29 09:12:38 | 7.3% | -58.0% | -57.1% |
| 4 | 2024-12-31 | $41,033M | $4,174M | $28.39 | 2026-05-29 09:12:38 | 4.4% | 103.0% | 109.2% |
| 5 | 2025-12-31 | $41,954M | $4,182M | $29.14 | 2026-05-29 09:12:38 | 2.2% | 0.2% | 2.6% |
| 6 | TTM 2026-03-31 | $42,367M | $4,576M | $31.88 | 2026-04-22 08:42:05 | 1.0% | 9.4% | 9.4% |
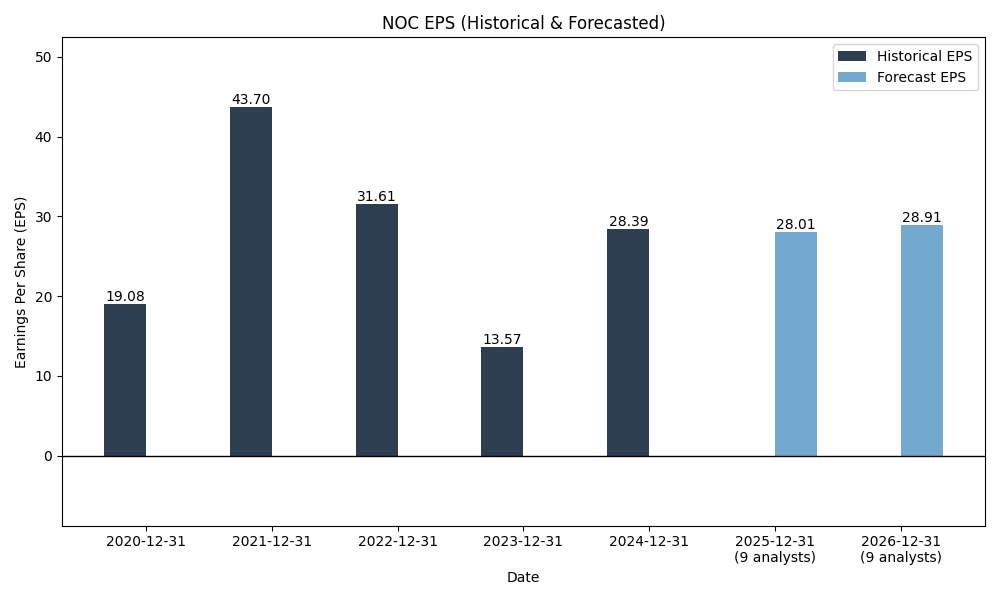
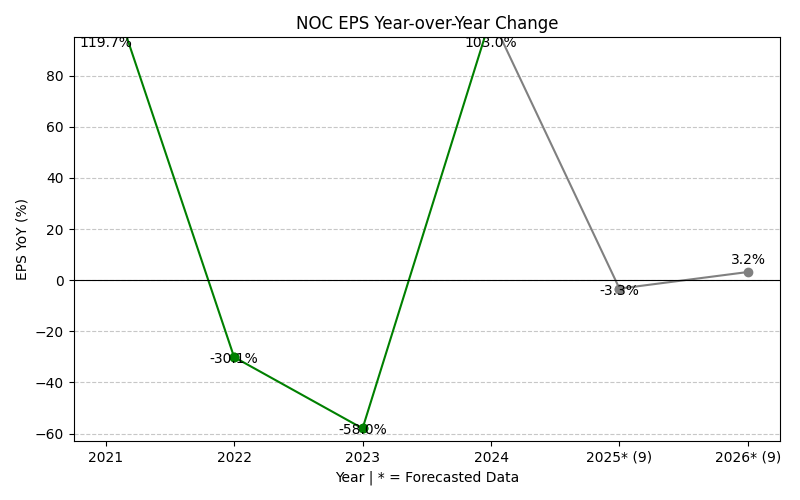
EPS
Forecasts
Y/Y % Change
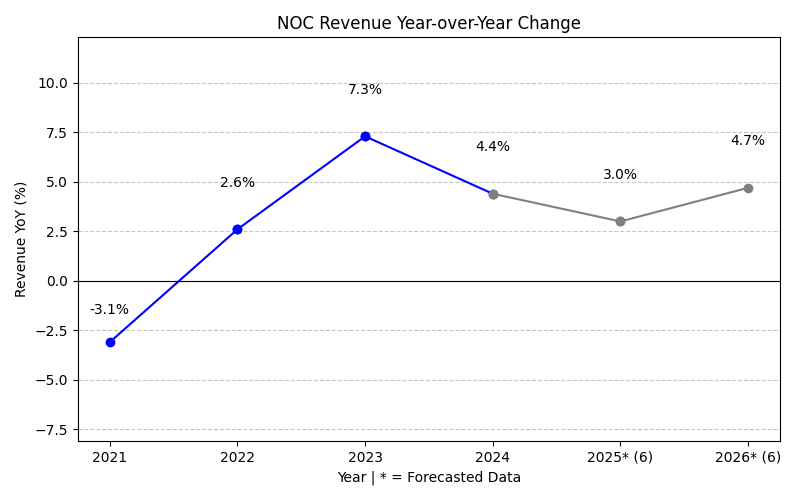
NOC Year-over-Year Growth
| 2020 | 2021 | 2022 | 2023 | 2024 | 2025 | 2026 | 2027 | Average | |
|---|---|---|---|---|---|---|---|---|---|
| Revenue Growth (%) | -3.1% | 2.6% | 7.3% | 4.4% | 2.2% | 4.8% | 6.5% | 3.5% | |
| Revenue Analysts (#) | 0 | 0 | 0 | 0 | 0 | 0 | 21 | 21 | |
| EPS Growth (%) | 119.7% | -30.1% | -58.0% | 103.0% | 0.2% | -5.1% | 7.9% | 19.7% | |
| EPS Analysts (#) | 0 | 0 | 0 | 0 | 0 | 0 | 21 | 21 |
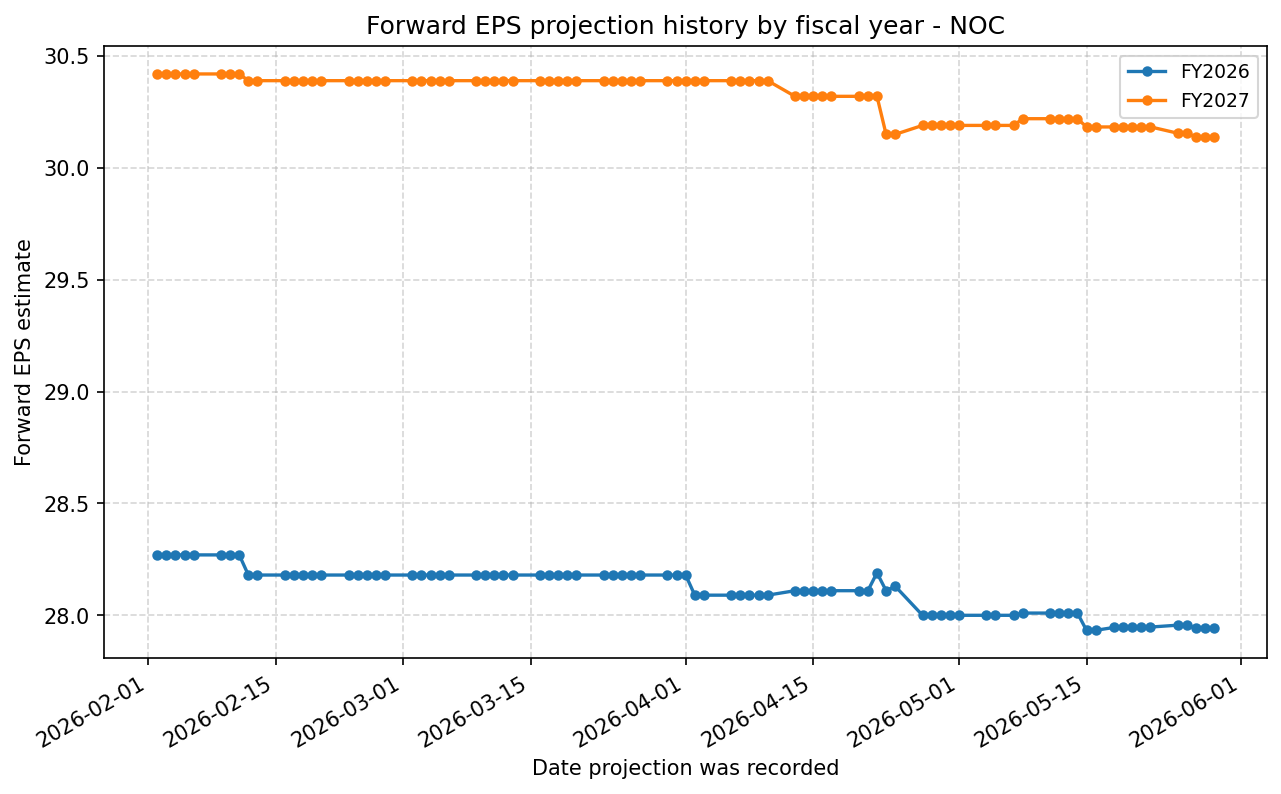
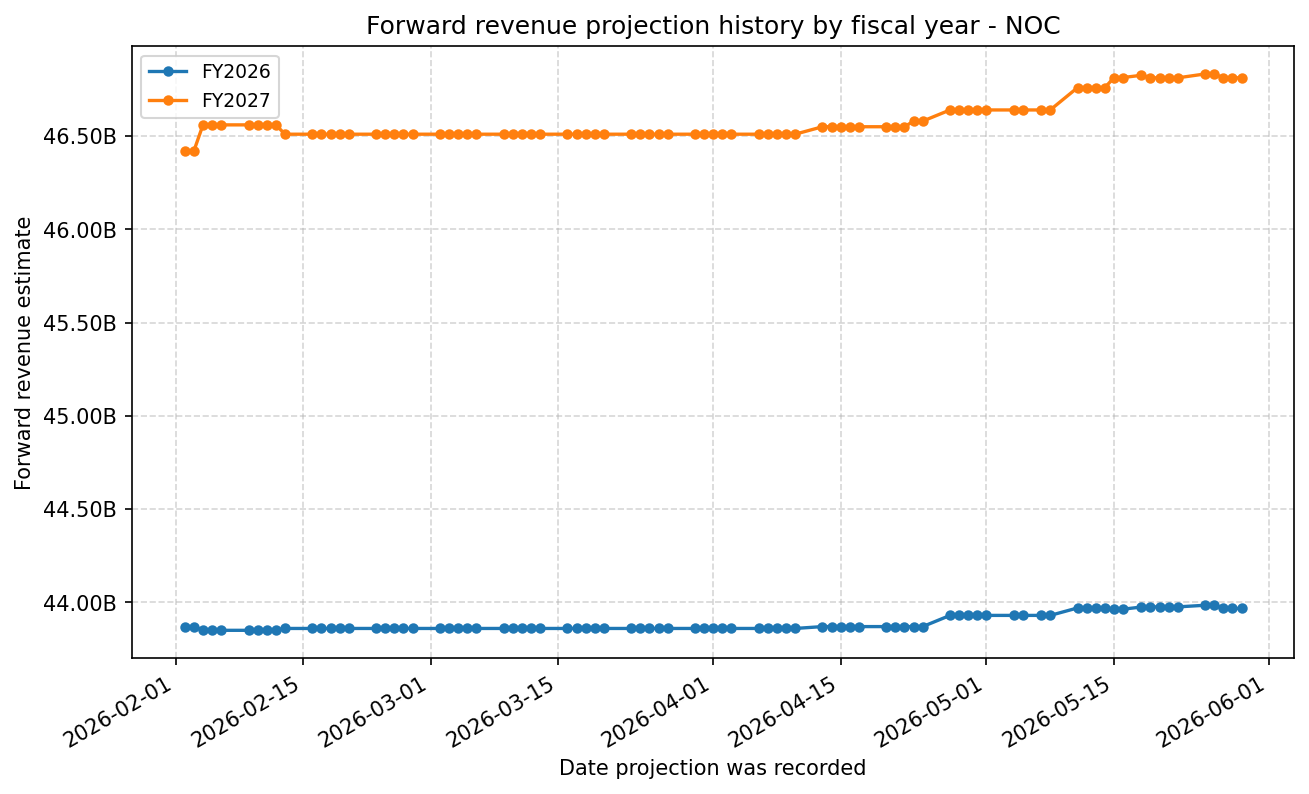
Forward Estimate History
How the next-FY EPS and revenue estimates have drifted over time. One line per fiscal year – past lines end when that FY became current.
Expenses
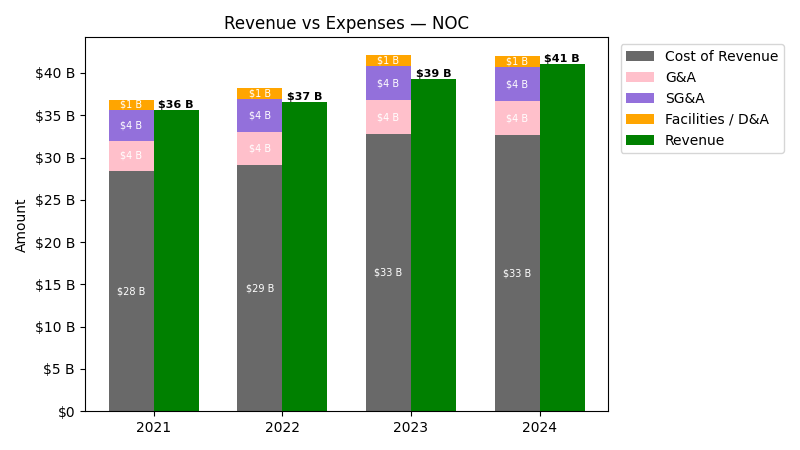
| Year | Revenue ($) | Cost of Revenue ($) | G&A ($) | SG&A ($) | Facilities / D&A ($) |
|---|---|---|---|---|---|
| 2021 | $35.7B | $27.2B | $3.6B | $3.6B | $1.2B |
| 2022 | $36.6B | $27.8B | $3.9B | $3.9B | $1.3B |
| 2023 | $39.3B | $31.4B | $4.0B | $4.0B | $1.3B |
| 2024 | $41.0B | $31.3B | $4.0B | $4.0B | $1.4B |
| 2025 | $42.0B | $32.2B | $4.0B | $4.0B | $1.5B |
| TTM | $42.4B | $32.2B | $4.0B | $4.0B | $1.5B |
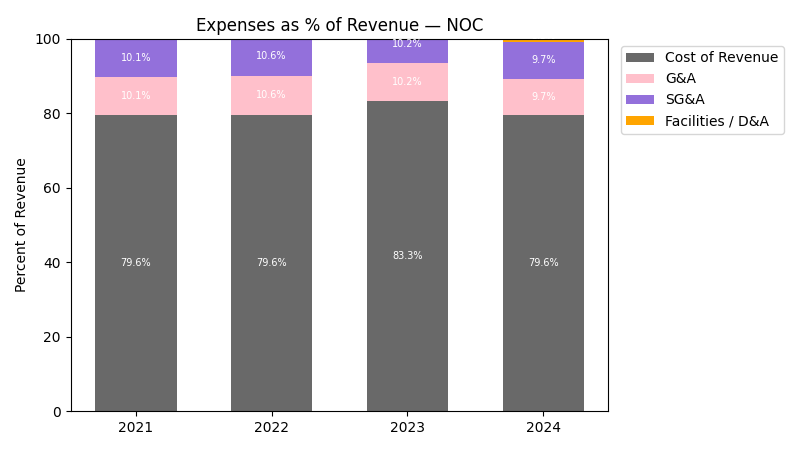
| Year | Revenue Change (%) | Cost of Revenue Change (%) | G&A Change (%) | SG&A Change (%) | Facilities / D&A Change (%) |
|---|---|---|---|---|---|
| 2022 | 2.62 | 2.30 | 7.67 | 7.67 | 8.31 |
| 2023 | 7.34 | 13.01 | 3.64 | 3.64 | -0.30 |
| 2024 | 4.44 | -0.32 | -0.55 | -0.55 | 2.39 |
| 2025 | 2.24 | 2.77 | 1.03 | 1.03 | 7.45 |
| TTM | 0.98 | -0.01 | -0.89 | -0.89 | 2.38 |
No unmapped expenses.
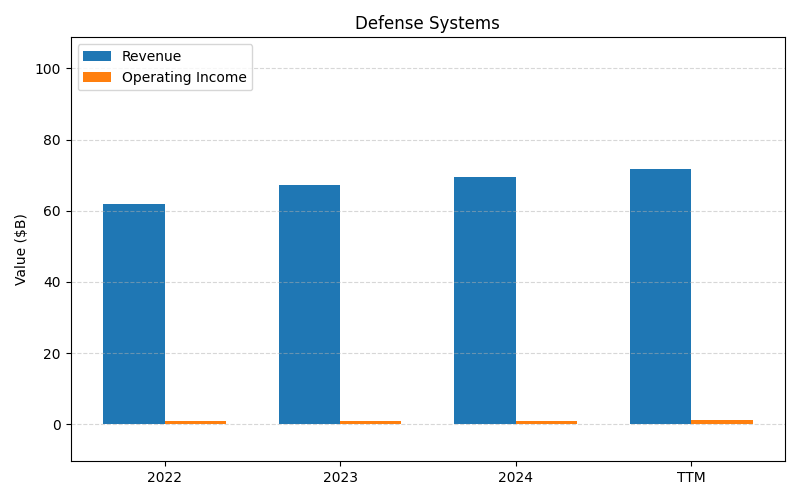
Segment Performance
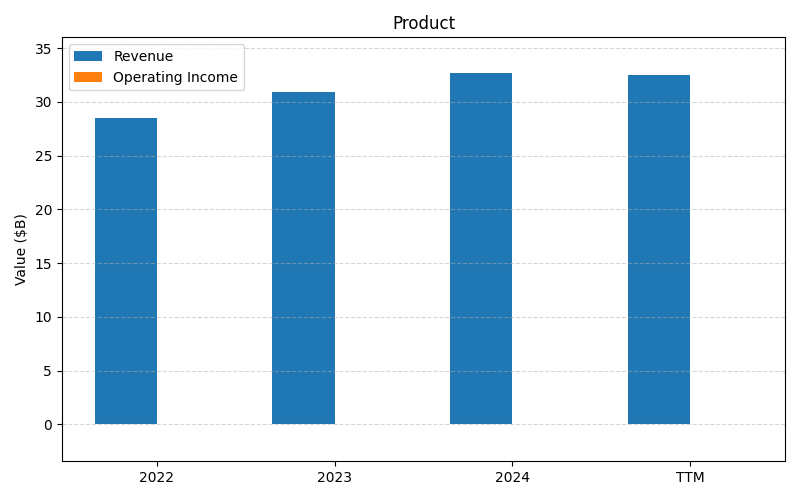
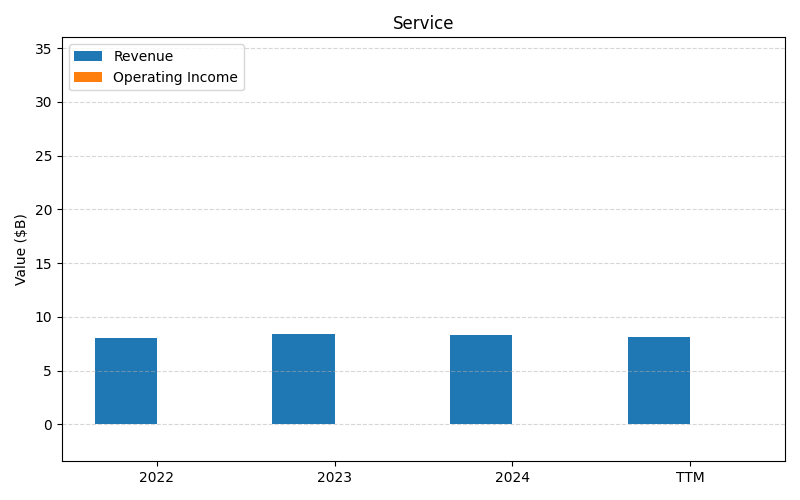
SEGMENTS v2025-09-09 · 2026-05-29 09:12 UTC — Units: $B. Rows list fiscal years (last 3 + TTM) with revenue and operating income for each segment; the final row shows the TTM revenue mix (operating income columns display “—” where mix is not applicable).
| Year | Prod Rev | Prod OI | Services Rev | Services OI | B21 Program L R I P Option1 Rev | B21 Program L R I P Option1 OI | B21 Program L R I P Options12 Rev | B21 Program L R I P Options12 OI | H A L O Program Rev | H A L O Program OI | Restricted Microelectronics Portfolio Rev | Restricted Microelectronics Portfolio OI | Sentinel E M D Phase Rev | Sentinel E M D Phase OI | Total Rev | Total OI |
|---|---|---|---|---|---|---|---|---|---|---|---|---|---|---|---|---|
| 2023 | 30.9B | – | 8.39B | – | – | -0.14B | – | – | – | -0.10B | – | – | – | – | 39.3B | -0.24B |
| 2024 | 32.7B | – | 8.31B | – | – | – | – | – | – | 0.04B | – | – | – | – | 41B | 0.04B |
| 2025 | 33.7B | – | 8.21B | – | – | – | – | 0.35B | – | – | – | 0.14B | – | 0.08B | 42B | 0.56B |
| TTM | 81.9B | 0.00B | 20.4B | 0.00B | – | – | – | – | – | – | – | – | – | – | 102.3B | 0.00B |
| % of Total (TTM) | 80.1% | — | 19.9% | — | – | — | – | — | – | — | – | — | – | — | 100% | — |
Segment Performance (Axis 2)
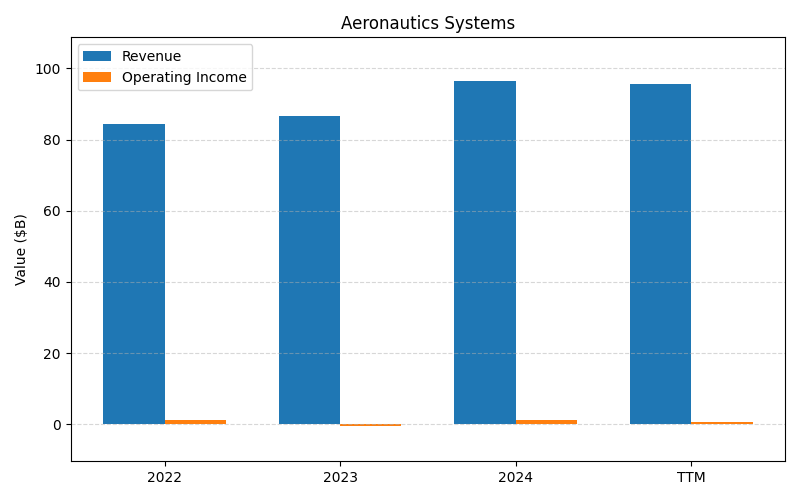
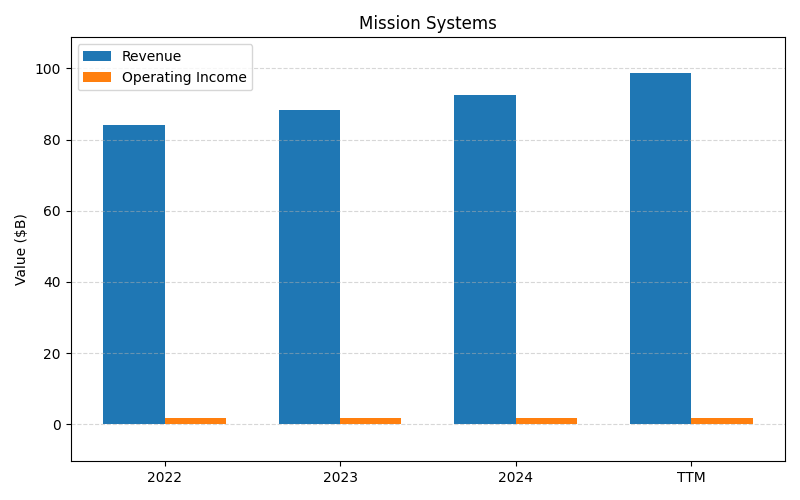
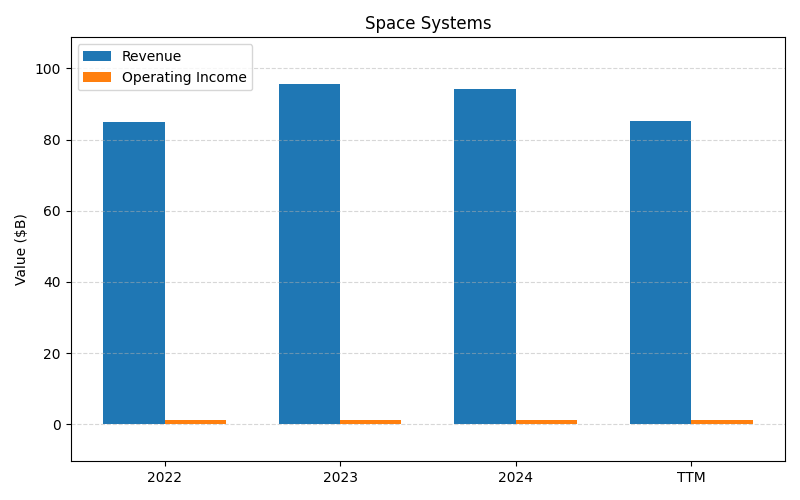
SEGMENTS v2025-09-09 · 2026-05-29 09:12 UTC — Units: $B. Rows list fiscal years (last 3 + TTM) with revenue and operating income for each segment; the final row shows the TTM revenue mix (operating income columns display “—” where mix is not applicable).
| Year | Aeronautics Systems Rev | Aeronautics Systems OI | Mission Systems Rev | Mission Systems OI | Space Systems Rev | Space Systems OI | Defense Systems Rev | Defense Systems OI | Total Rev | Total OI |
|---|---|---|---|---|---|---|---|---|---|---|
| 2023 | 89.5B | -0.41B | 88.2B | 1.78B | 95.5B | 1.18B | 57.6B | 0.70B | 330.8B | 3.25B |
| 2024 | 99.3B | 1.25B | 92.4B | 1.78B | 94.3B | 1.30B | 59.4B | 0.74B | 345.3B | 5.06B |
| 2025 | 104.1B | 0.83B | 101.5B | 2.05B | 86.7B | 1.24B | 64.2B | 0.90B | 356.5B | 5.01B |
| TTM | 246.1B | 2.20B | 233.5B | 4.62B | 216.3B | 3.05B | 149.5B | 2.00B | 845.4B | 11.9B |
| % of Total (TTM) | 29.1% | — | 27.6% | — | 25.6% | — | 17.7% | — | 100% | — |
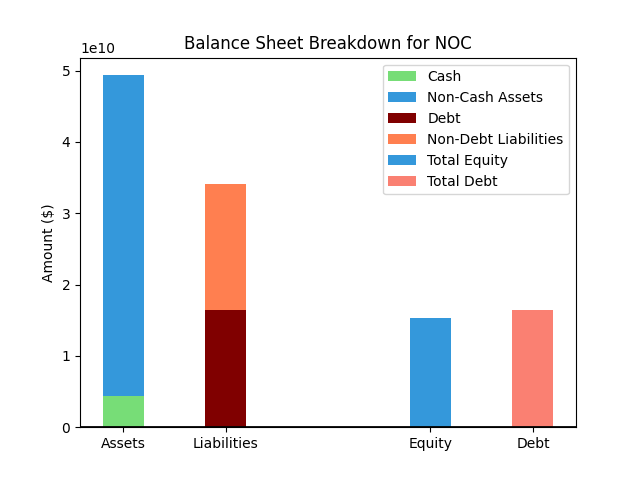
Balance Sheet
| Metric | Value | |
|---|---|---|
| 0 | Total Assets | $50,007M |
| 1 | Cash | $2,090M |
| 2 | Total Liabilities | $32,892M |
| 3 | Total Debt | $16,316M |
| 4 | Total Equity | $17,115M |
| 5 | Debt to Equity Ratio | 0.95 |
EPS & Dividend
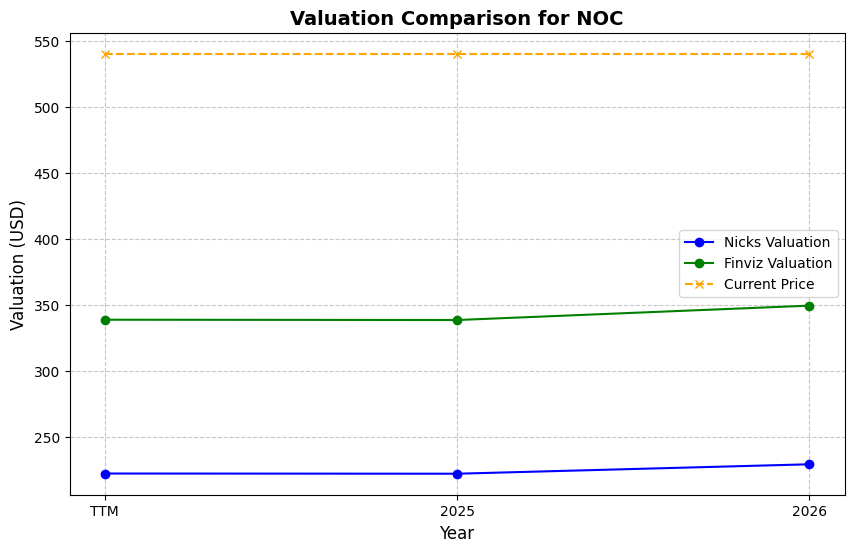
Valuation
| Share Price | Treasury Yield | Estimates | Fair Value (P/E) | Fair Value (P/S) | Current P/S | Current P/E |
|---|---|---|---|---|---|---|
| $563.68 | 4.5% | Nicks Growth: 2% Nick's Expected Margin: 10% FINVIZ Growth: 7% |
Nicks: 8 Finviz: 13 |
Nick's: 0.780 | 1.9 | 17.7 |
| Basis | Year | Nicks Valuation | Nicks vs Share Price | Finviz Valuation | Finviz vs Share Price |
|---|---|---|---|---|---|
| $31.88 EPS | TTM | $248.69 | -55.9% | $426.24 | -24.4% |
| $27.94 EPS | 2026 | $217.97 | -61.3% | $373.60 | -33.7% |
| $30.14 EPS | 2027 | $235.10 | -58.3% | $402.96 | -28.5% |
Implied Growth
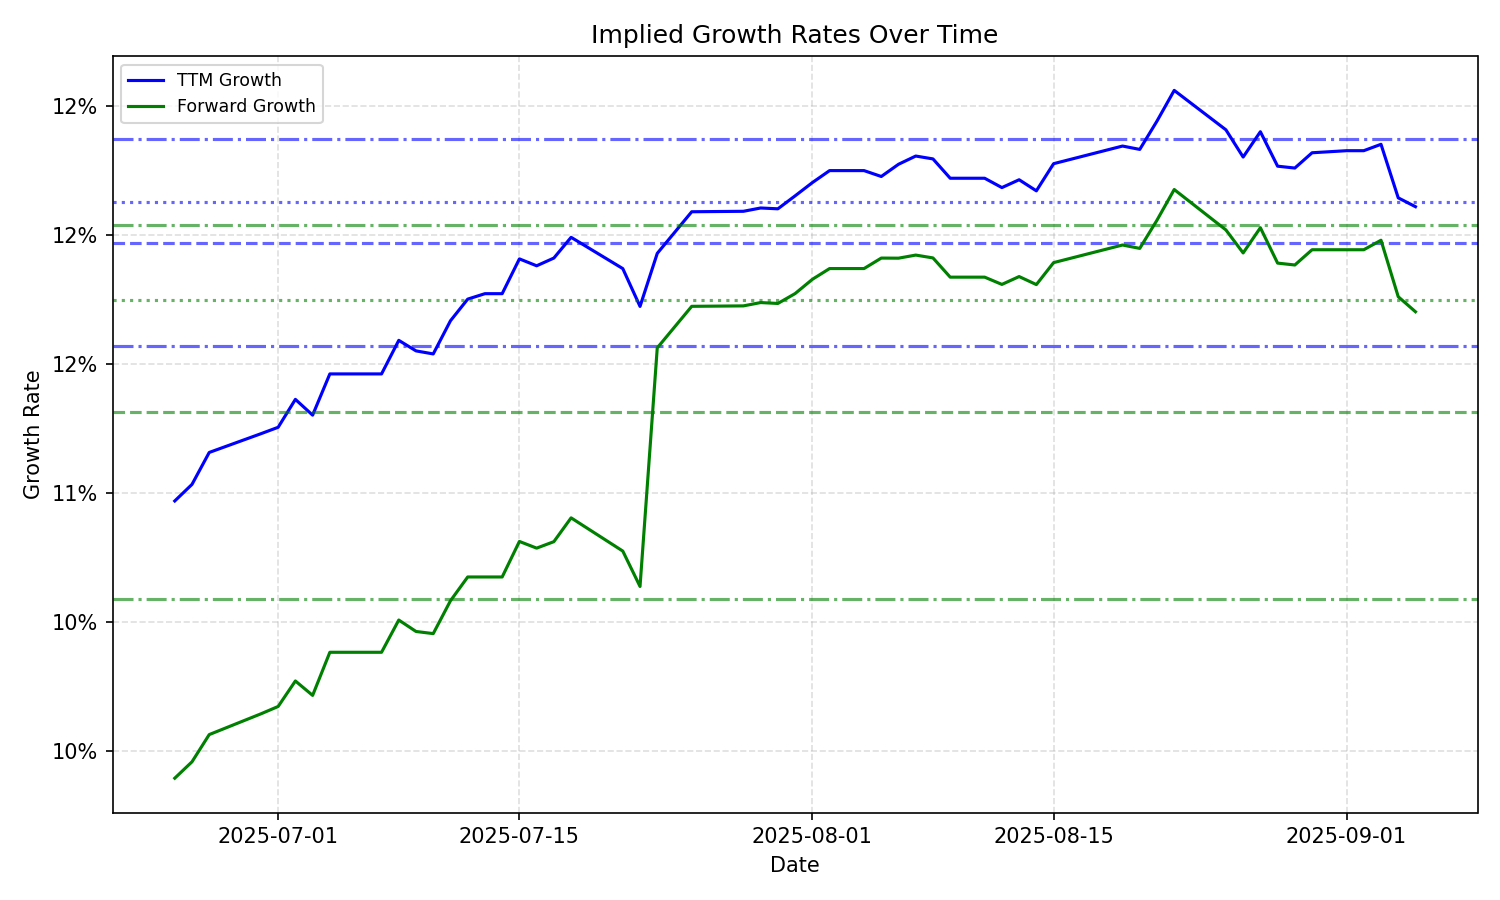
| Average | Median | Std Dev | Current | Percentile | ||||||
|---|---|---|---|---|---|---|---|---|---|---|
| TTM | Forward | TTM | Forward | TTM | Forward | TTM | Forward | TTM | Forward | |
| Timeframe | ||||||||||
| 1 Year | 11.78% | 11.44% | 11.89% | 11.54% | 0.63% | 0.58% | 10.24% | 10.83% | 5.2% | 20.1% |
| 3 Years | 11.78% | 11.44% | 11.89% | 11.54% | 0.63% | 0.58% | 10.24% | 10.83% | 5.2% | 20.1% |
| 5 Years | 11.78% | 11.44% | 11.89% | 11.54% | 0.63% | 0.58% | 10.24% | 10.83% | 5.2% | 20.1% |
| 10 Years | 11.78% | 11.44% | 11.89% | 11.54% | 0.63% | 0.58% | 10.24% | 10.83% | 5.2% | 20.1% |