Netflix, Inc. — NFLX
| Close Price | Market Cap | P/E Ratio | Forward P/E Ratio | Implied Growth* | Implied Forward Growth* | Dividend | P/B Ratio |
|---|---|---|---|---|---|---|---|
| $86.02 | $362.21B | 27.7 | 22.4 | 15.2% | 12.8% | - | 11.6 |
Latest Headlines
- · 3 Reasons to Buy Netflix Stock in June
- · If Spider-Man Wins 2026’s Box Office Crown, These Stocks Win Too
- · KnowBe4 Launches a New Family Hub Providing Cyber Safety Training for Children and Adults
- · Go Figure: 3 big marketing numbers from May
- · Netflix Buys Affleck AI Startup InterPositive To Reshape Content Economics
- · How Is Netflix’s Stock Performance Compared to Other Entertainment Stocks?
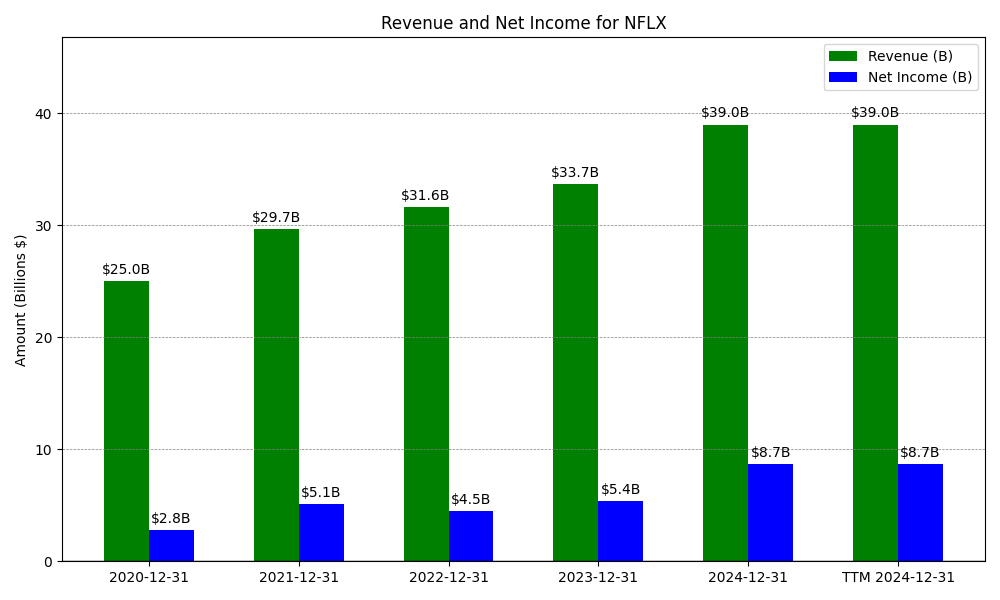
Revenue & Net Income
| Date | Revenue | Net_Income | EPS | Last_Updated | Revenue_Change | Net_Income_Change | EPS_Change | |
|---|---|---|---|---|---|---|---|---|
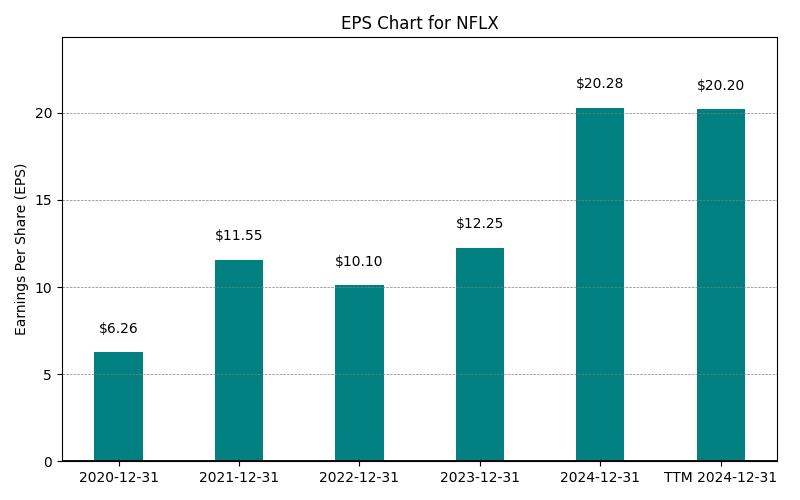
| 0 | 2020-12-31 | $24,996M | $2,761M | $0.63 | 2025-12-18 08:29:28 | N/A | N/A | N/A |
| 1 | 2021-12-31 | $29,698M | $5,116M | $1.16 | 2025-12-18 08:29:28 | 18.8% | 85.3% | 84.5% |
| 2 | 2022-12-31 | $31,616M | $4,492M | $1.01 | 2026-05-29 09:12:33 | 6.5% | -12.2% | -12.6% |
| 3 | 2023-12-31 | $33,723M | $5,408M | $1.23 | 2026-05-29 09:12:33 | 6.7% | 20.4% | 21.3% |
| 4 | 2024-12-31 | $39,001M | $8,712M | $2.03 | 2026-05-29 09:12:33 | 15.6% | 61.1% | 65.6% |
| 5 | 2025-12-31 | $45,183M | $10,981M | $2.58 | 2026-05-29 09:12:33 | 15.9% | 26.1% | 27.2% |
| 6 | TTM 2026-03-31 | $46,890M | $13,374M | $3.10 | 2026-04-20 08:51:09 | 3.8% | 21.8% | 20.2% |
EPS
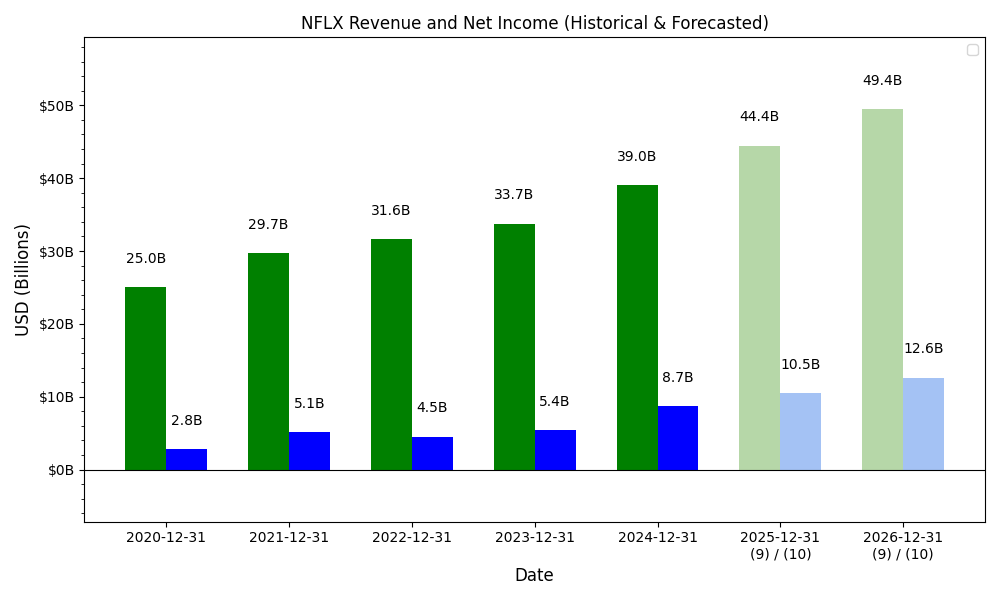
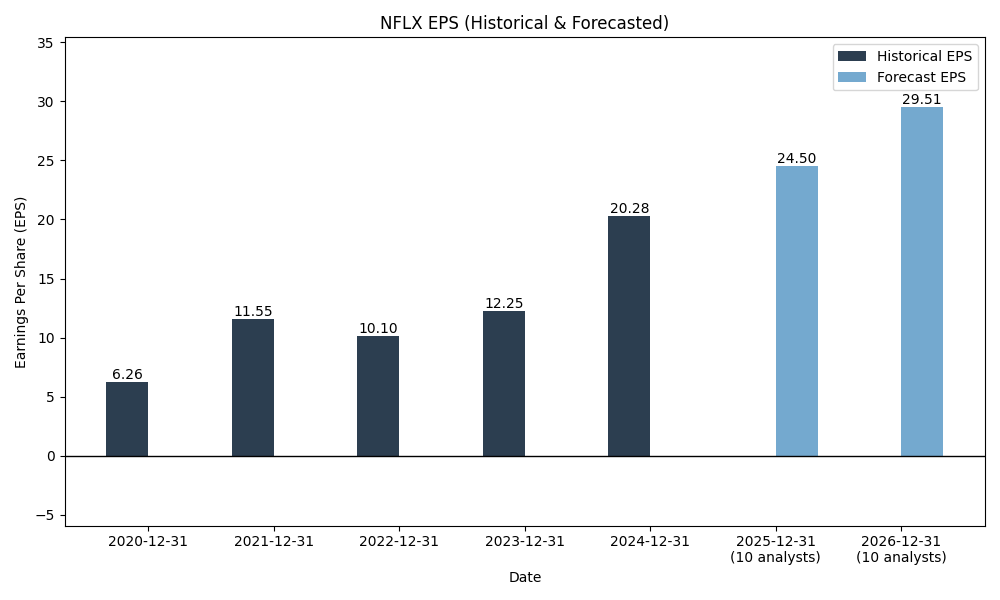
Forecasts
Y/Y % Change
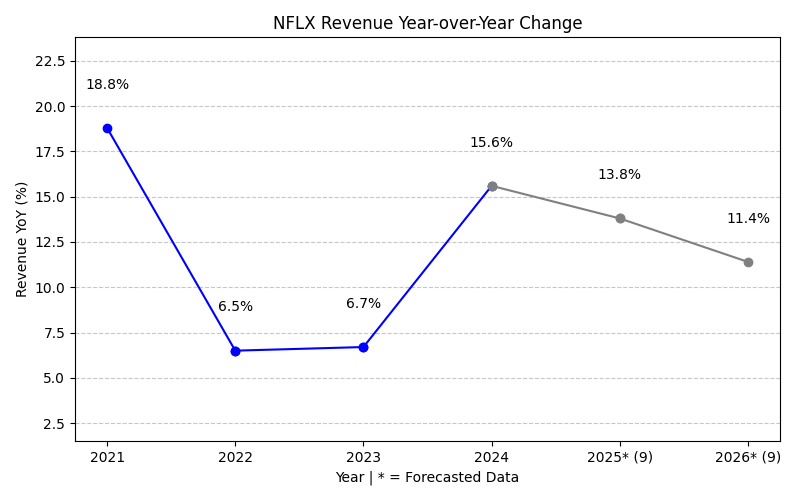
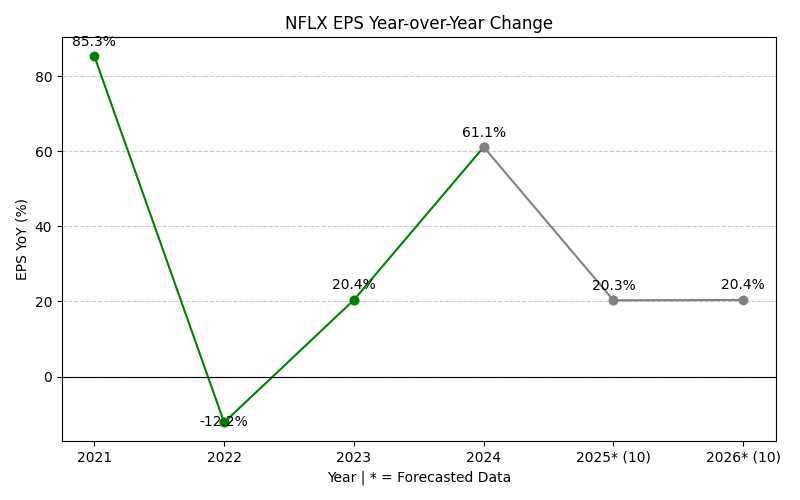
NFLX Year-over-Year Growth
| 2020 | 2021 | 2022 | 2023 | 2024 | 2025 | 2026 | 2027 | Average | |
|---|---|---|---|---|---|---|---|---|---|
| Revenue Growth (%) | 18.8% | 6.5% | 6.7% | 15.6% | 15.9% | 13.8% | 11.7% | 12.7% | |
| Revenue Analysts (#) | 0 | 0 | 0 | 0 | 0 | 0 | 46 | 45 | |
| EPS Growth (%) | 85.3% | -12.2% | 20.4% | 61.1% | 26.1% | 37.8% | 6.6% | 32.2% | |
| EPS Analysts (#) | 0 | 0 | 0 | 0 | 0 | 0 | 40 | 43 |
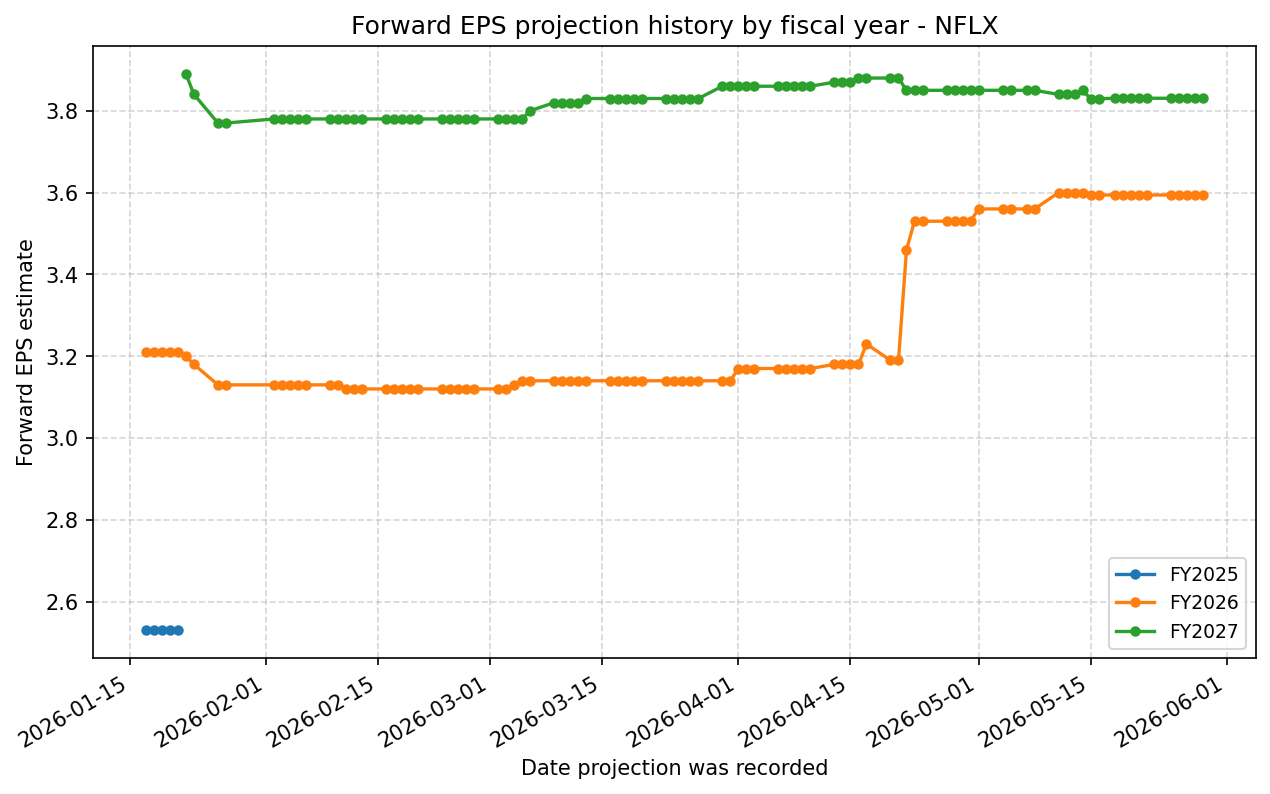
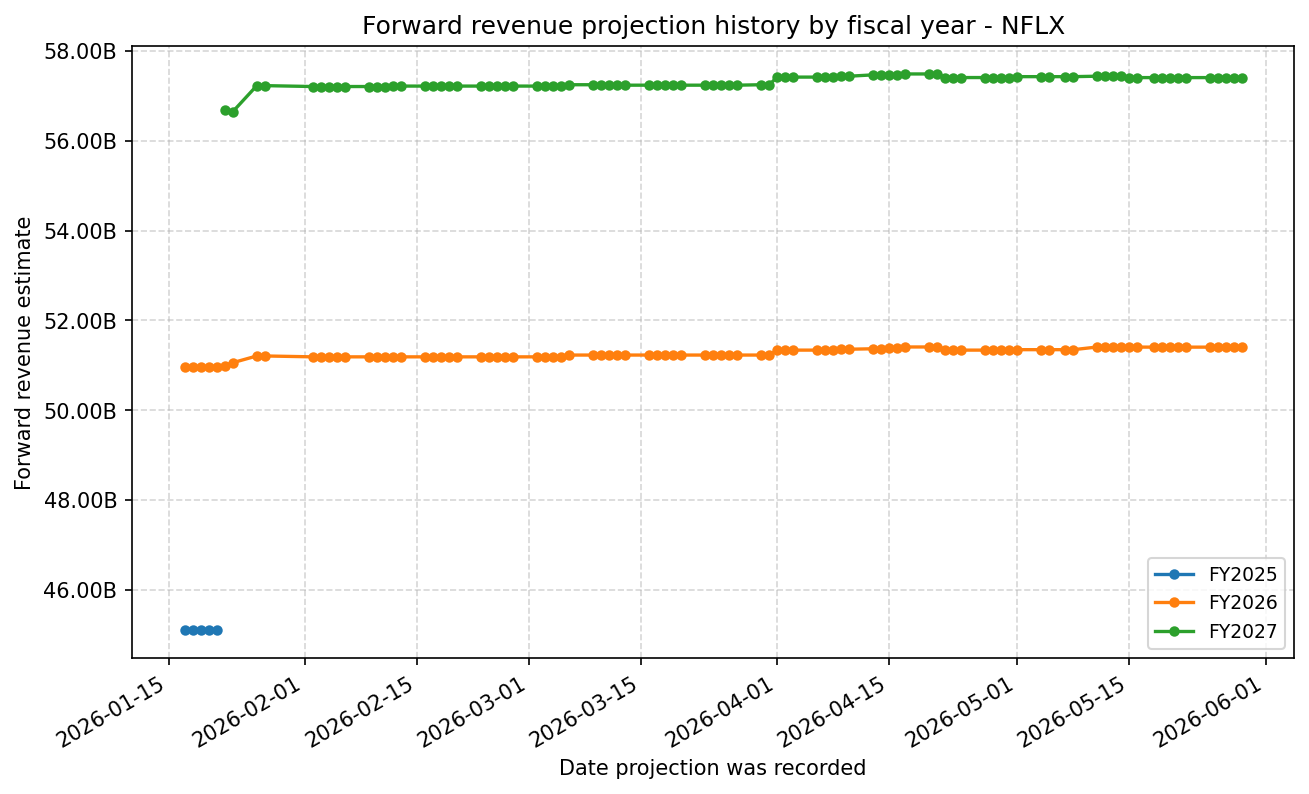
Forward Estimate History
How the next-FY EPS and revenue estimates have drifted over time. One line per fiscal year – past lines end when that FY became current.
Expenses
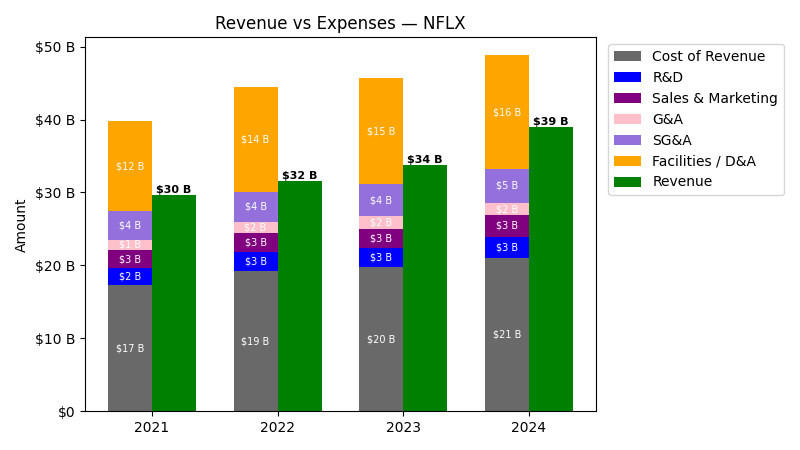
| Year | Revenue ($) | Cost of Revenue ($) | R&D ($) | Sales & Marketing ($) | G&A ($) | SG&A ($) | Facilities / D&A ($) |
|---|---|---|---|---|---|---|---|
| 2022 | $31.6B | $4.8B | $2.7B | $2.5B | $1.6B | $4.1B | $14.4B |
| 2023 | $33.7B | $5.2B | $2.7B | $2.7B | $1.7B | $4.4B | $14.6B |
| 2024 | $39.0B | $5.4B | $2.9B | $2.9B | $1.7B | $4.6B | $15.6B |
| 2025 | $45.2B | $6.5B | $3.4B | $3.3B | $1.9B | $5.2B | $16.8B |
| TTM | $46.9B | $6.7B | $3.5B | $3.5B | $2.1B | $5.5B | $17.2B |
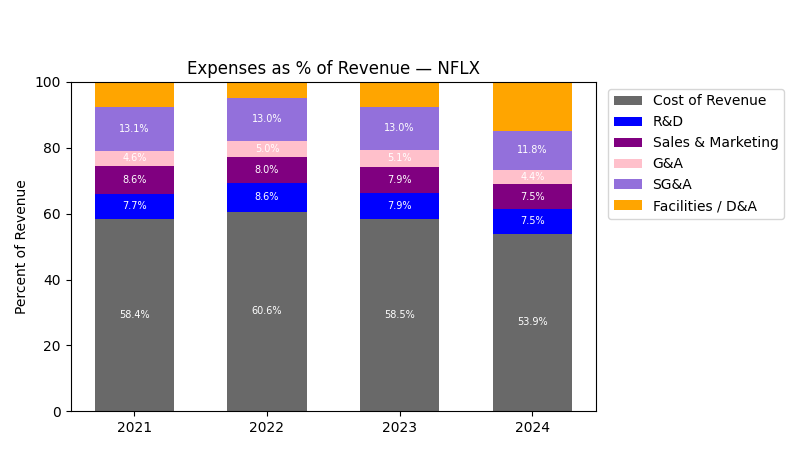
| Year | Revenue Change (%) | Cost of Revenue Change (%) | R&D Change (%) | Sales & Marketing Change (%) | G&A Change (%) | SG&A Change (%) | Facilities / D&A Change (%) |
|---|---|---|---|---|---|---|---|
| 2023 | 6.67 | 7.40 | -1.30 | 5.03 | 9.37 | 6.70 | 1.33 |
| 2024 | 15.65 | 4.79 | 9.33 | 9.77 | -1.06 | 5.51 | 7.39 |
| 2025 | 15.85 | 20.56 | 15.93 | 13.15 | 10.95 | 12.34 | 7.20 |
| TTM | 3.78 | 3.25 | 4.04 | 4.66 | 9.59 | 6.45 | 2.47 |
No unmapped expenses.
Balance Sheet
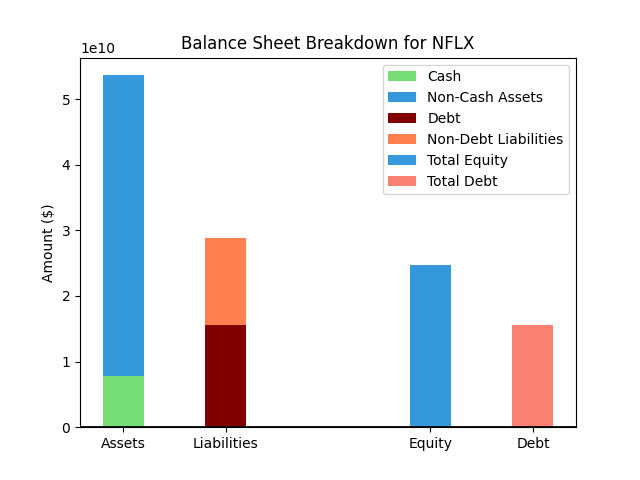
| Metric | Value | |
|---|---|---|
| 0 | Total Assets | $61,016M |
| 1 | Cash | $12,260M |
| 2 | Total Liabilities | $29,890M |
| 3 | Total Debt | $14,361M |
| 4 | Total Equity | $31,126M |
| 5 | Debt to Equity Ratio | 0.46 |
EPS & Dividend

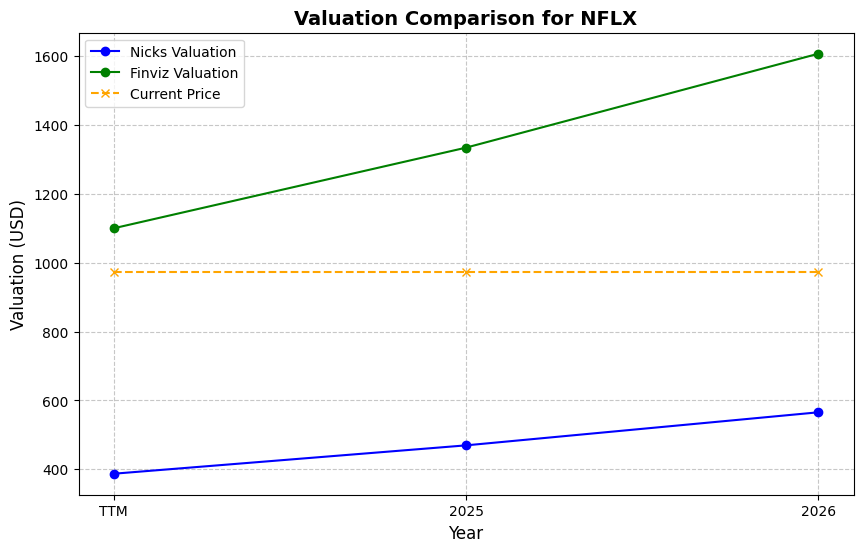
Valuation
| Share Price | Treasury Yield | Estimates | Fair Value (P/E) | Fair Value (P/S) | Current P/S | Current P/E |
|---|---|---|---|---|---|---|
| $86.02 | 4.5% | Nicks Growth: 11% Nick's Expected Margin: 14% FINVIZ Growth: 22% |
Nicks: 19 Finviz: 50 |
Nick's: 2.640 | 7.7 | 27.7 |
| Basis | Year | Nicks Valuation | Nicks vs Share Price | Finviz Valuation | Finviz vs Share Price |
|---|---|---|---|---|---|
| $3.10 EPS | TTM | $58.45 | -32.1% | $154.67 | 79.8% |
| $3.59 EPS | 2026 | $67.76 | -21.2% | $179.32 | 108.5% |
| $3.83 EPS | 2027 | $72.22 | -16.0% | $191.12 | 122.2% |
Implied Growth
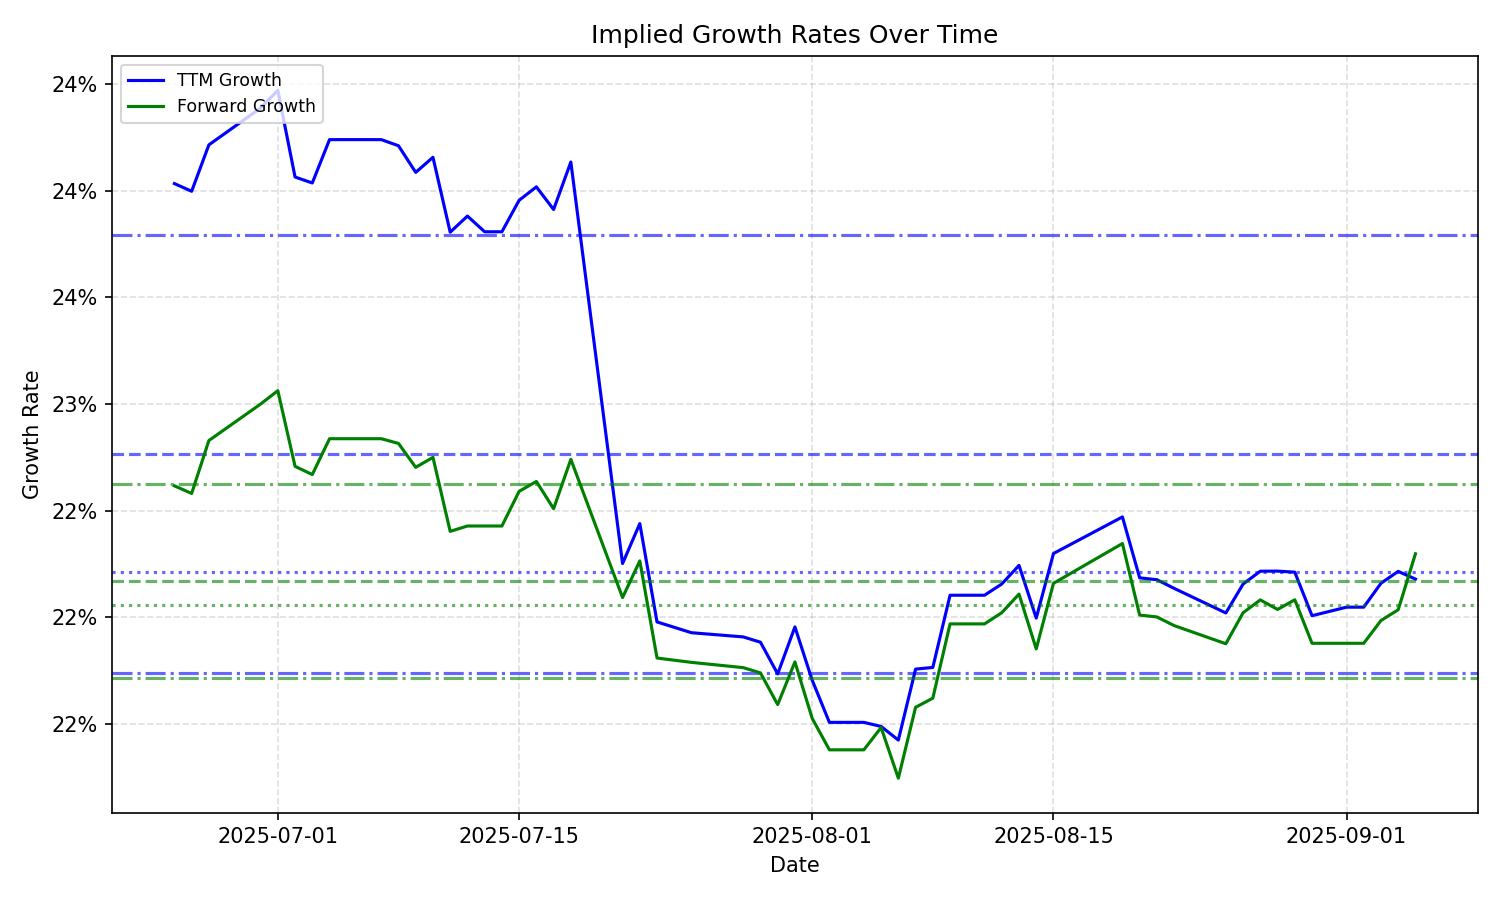
| Average | Median | Std Dev | Current | Percentile | ||||||
|---|---|---|---|---|---|---|---|---|---|---|
| TTM | Forward | TTM | Forward | TTM | Forward | TTM | Forward | TTM | Forward | |
| Timeframe | ||||||||||
| 1 Year | 19.81% | 16.05% | 20.06% | 15.06% | 2.59% | 7.05% | 15.24% | 12.89% | 0.8% | 17.4% |
| 3 Years | 19.81% | 16.05% | 20.06% | 15.06% | 2.59% | 7.05% | 15.24% | 12.89% | 0.8% | 17.4% |
| 5 Years | 19.81% | 16.05% | 20.06% | 15.06% | 2.59% | 7.05% | 15.24% | 12.89% | 0.8% | 17.4% |
| 10 Years | 19.81% | 16.05% | 20.06% | 15.06% | 2.59% | 7.05% | 15.24% | 12.89% | 0.8% | 17.4% |