Cloudflare, Inc. — NET
| Close Price | Market Cap | P/E Ratio | Forward P/E Ratio | Implied Growth* | Implied Forward Growth* | Dividend | P/B Ratio |
|---|---|---|---|---|---|---|---|
| $241.82 | $85.48B | - | 158.6 | N/A | 36.3% | - | 56.0 |
Latest Headlines
- · Stocks Supported by Middle East Peace Hopes and AI Spending
- · Stock Indexes Rally to Record Highs on Peace Deal Hopes and AI Spending
- · Why Is Cloudflare (NET) Stock Rocketing Higher Today
- · 1 Unprofitable Stock to Own for Decades and 2 Facing Headwinds
- · Fastly vs. Cloudflare: Which Edge AI Infrastructure Stock Wins?
- · Stocks Settle Mixed on Conflicting US-Iran Signals
Revenue & Net Income
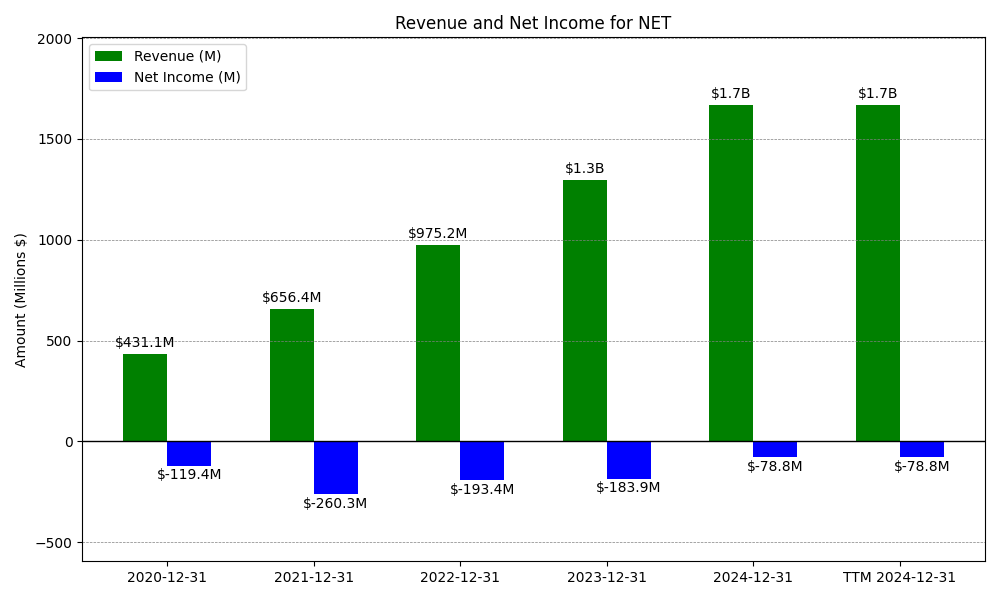
| Date | Revenue | Net_Income | EPS | Last_Updated | Revenue_Change | Net_Income_Change | EPS_Change | |
|---|---|---|---|---|---|---|---|---|
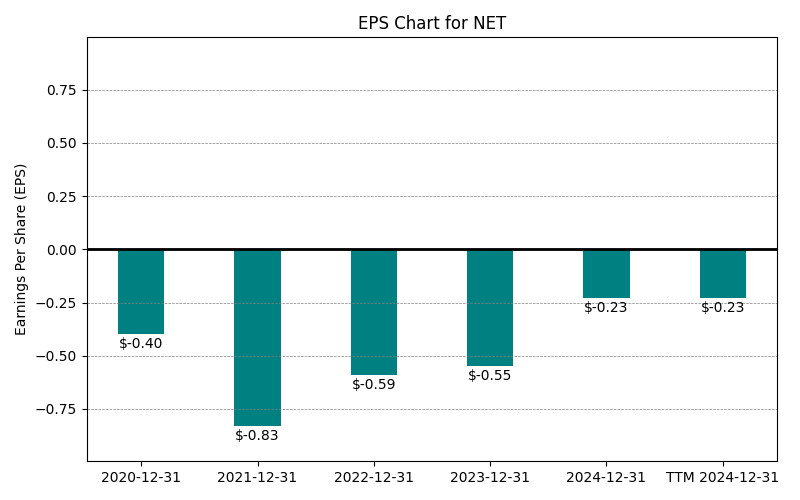
| 0 | 2020-12-31 | $431M | $-119M | $-0.40 | 2024-02-08 22:12:17 | N/A | N/A | N/A |
| 1 | 2021-12-31 | $656M | $-260M | $-0.59 | 2026-03-06 08:35:16 | 52.3% | 118.1% | 47.5% |
| 2 | 2022-12-31 | $975M | $-193M | $-0.59 | 2026-05-29 09:12:27 | 48.6% | -25.7% | 0.0% |
| 3 | 2023-12-31 | $1,297M | $-184M | $-0.55 | 2026-05-29 09:12:27 | 33.0% | -4.9% | -6.8% |
| 4 | 2024-12-31 | $1,670M | $-79M | $-0.23 | 2026-05-29 09:12:27 | 28.8% | -57.2% | -58.2% |
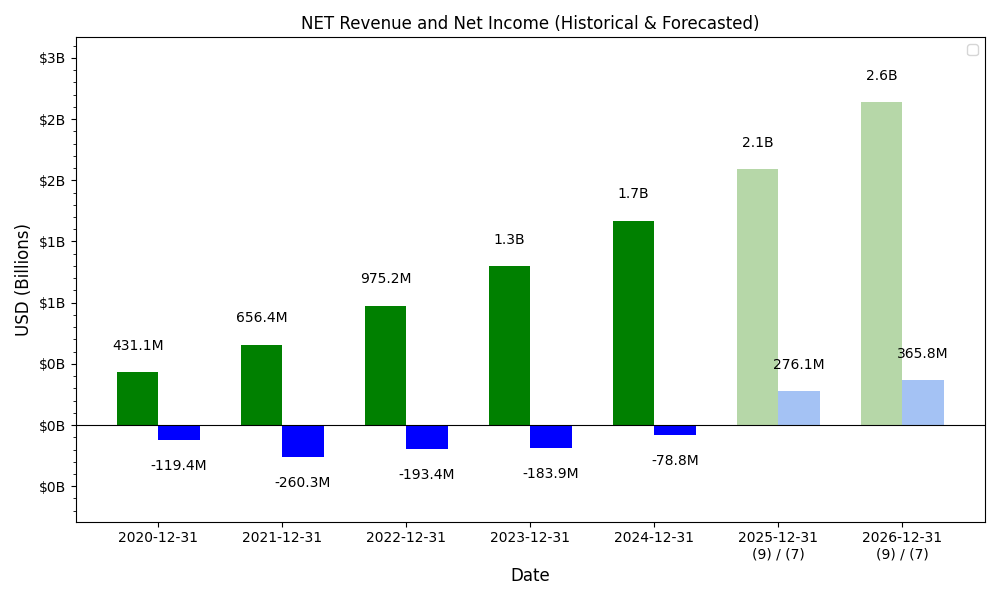
| 5 | 2025-12-31 | $2,168M | $-102M | $-0.29 | 2026-05-29 09:12:27 | 29.8% | 29.8% | 26.1% |
| 6 | TTM 2026-03-31 | $2,329M | $-87M | $-0.25 | 2026-05-11 09:12:49 | 7.4% | -15.2% | -13.8% |
EPS
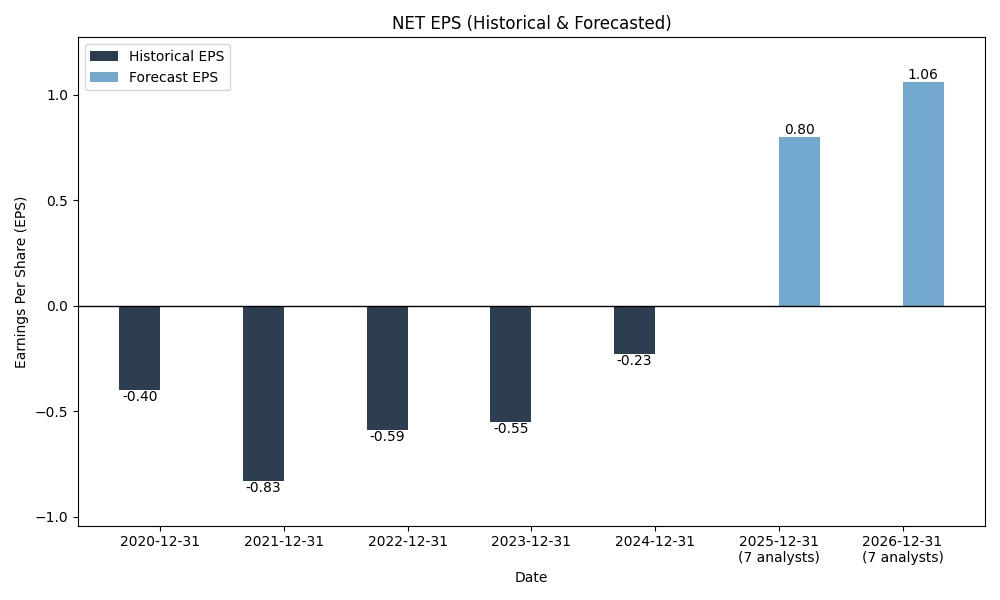
Forecasts
Y/Y % Change
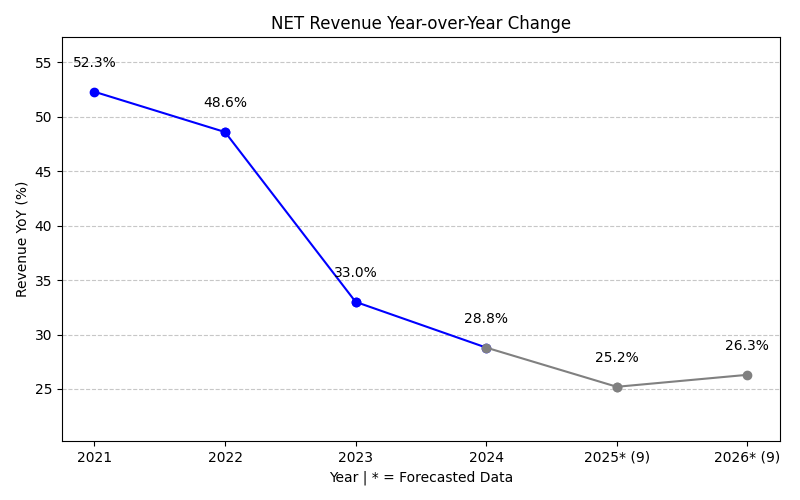
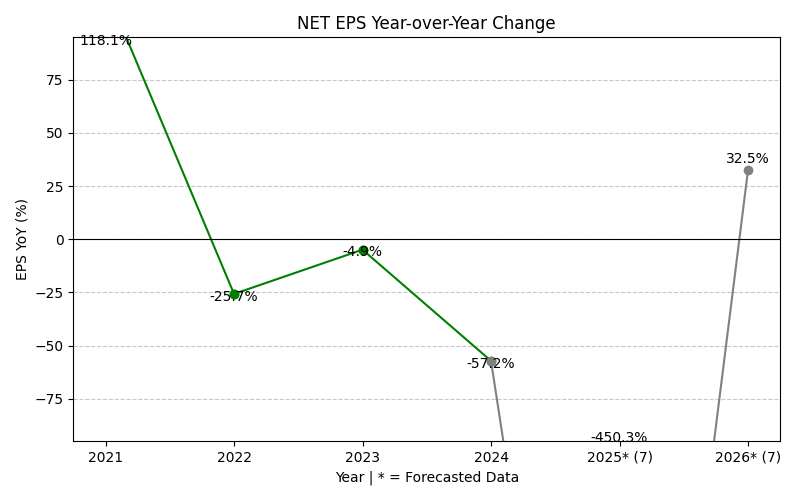
NET Year-over-Year Growth
| 2020 | 2021 | 2022 | 2023 | 2024 | 2025 | 2026 | 2027 | Average | |
|---|---|---|---|---|---|---|---|---|---|
| Revenue Growth (%) | 52.3% | 48.6% | 33.0% | 28.8% | 29.8% | 29.7% | 27.5% | 35.7% | |
| Revenue Analysts (#) | 0 | 0 | 0 | 0 | 0 | 0 | 31 | 32 | |
| EPS Growth (%) | 118.1% | -25.7% | -4.9% | -57.2% | 29.8% | -513.0% | 27.6% | -60.8% | |
| EPS Analysts (#) | 0 | 0 | 0 | 0 | 0 | 0 | 33 | 33 |
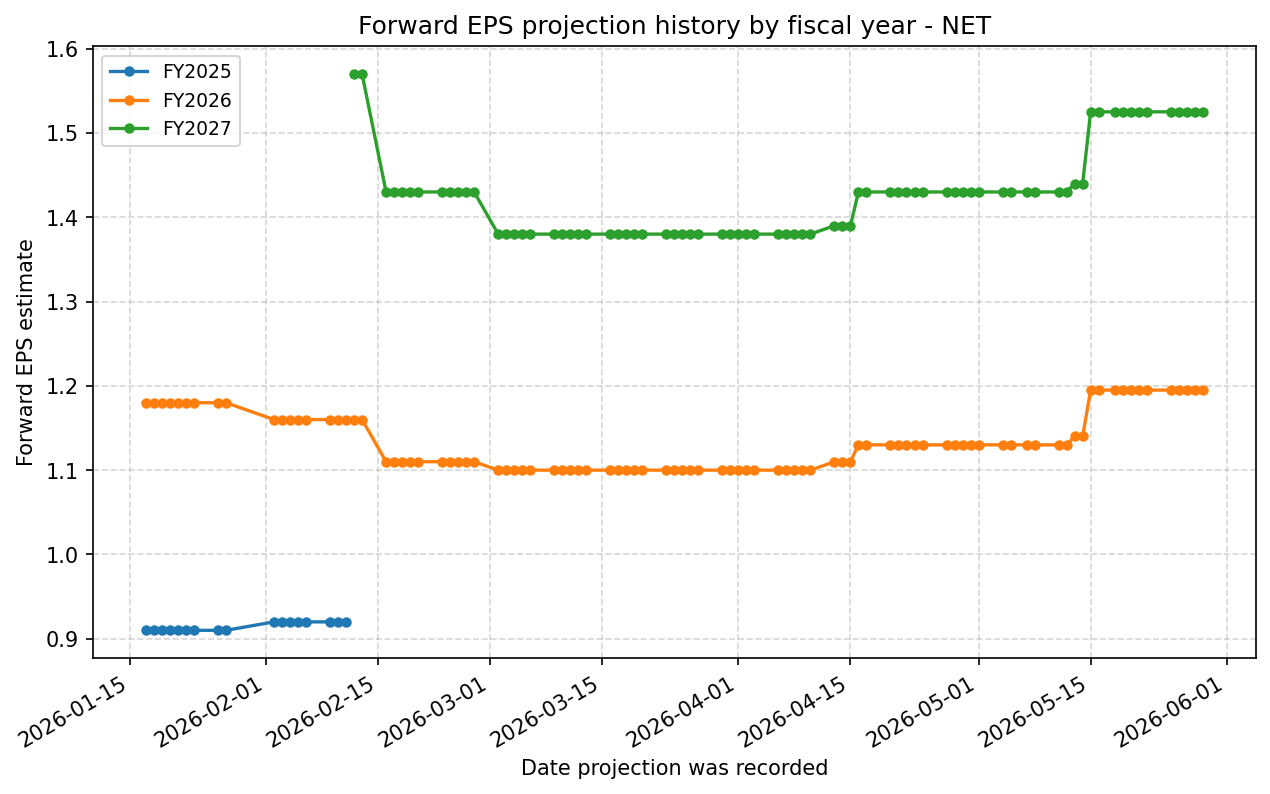
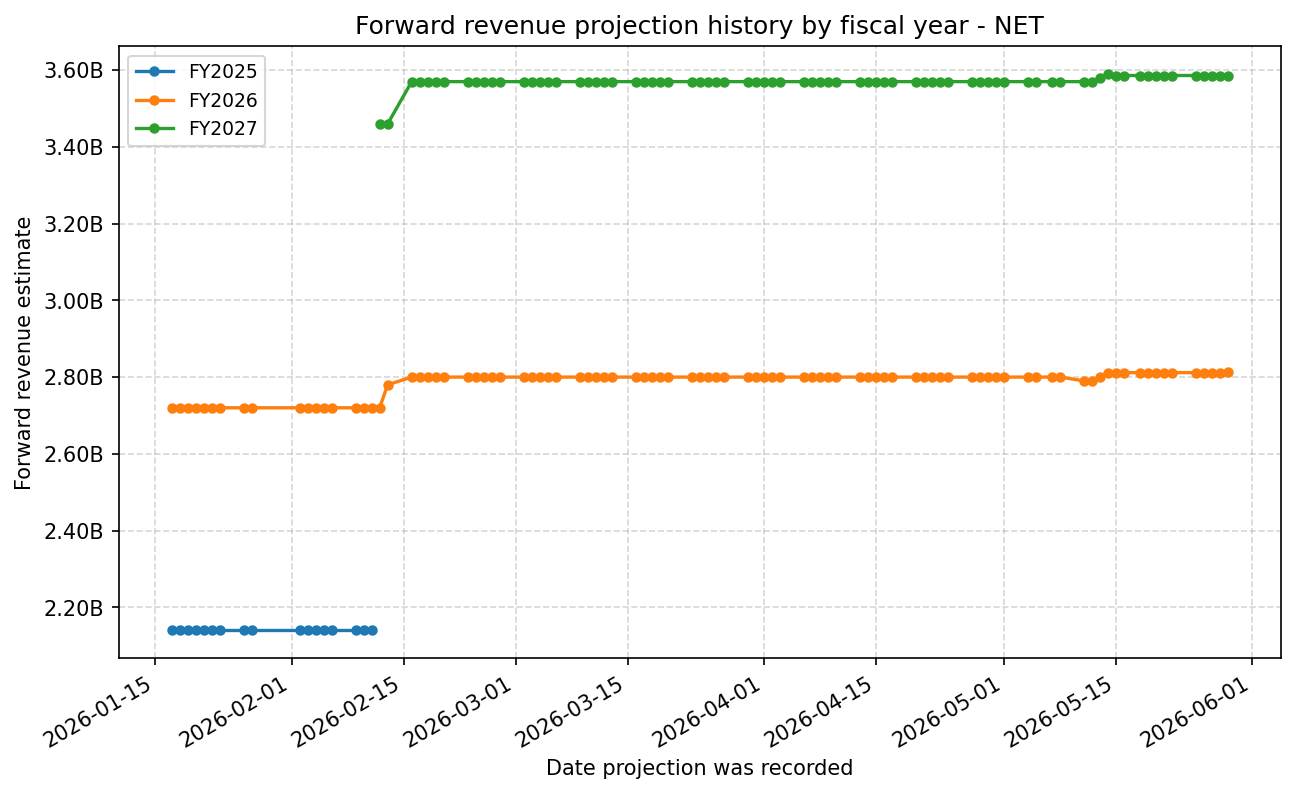
Forward Estimate History
How the next-FY EPS and revenue estimates have drifted over time. One line per fiscal year – past lines end when that FY became current.
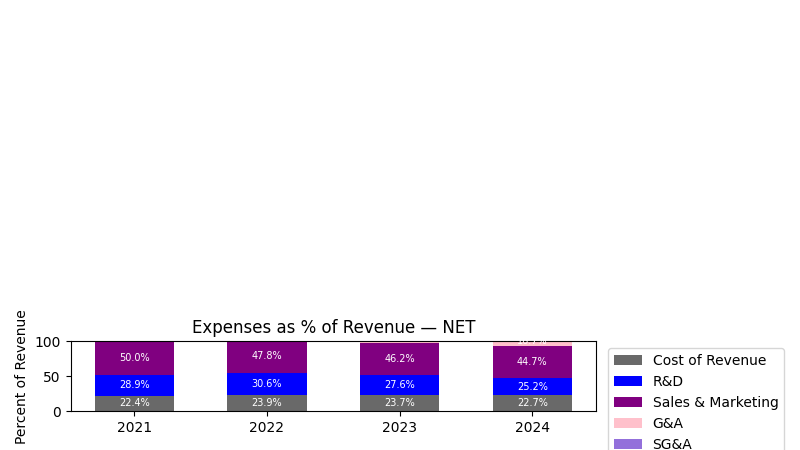
Expenses

| Year | Revenue ($) | Cost of Revenue ($) | R&D ($) | Sales & Marketing ($) | G&A ($) | SG&A ($) | Facilities / D&A ($) |
|---|---|---|---|---|---|---|---|
| 2022 | $975.2M | $130.3M | $298.3M | $465.8M | $179.8M | $645.5M | $102.3M |
| 2023 | $1.3B | $171.2M | $358.1M | $599.1M | $218.0M | $817.1M | $135.8M |
| 2024 | $1.7B | $251.0M | $421.4M | $745.8M | $278.5M | $1.0B | $127.7M |
| 2025 | $2.2B | $362.8M | $512.5M | $920.8M | $389.3M | $1.3B | $189.7M |
| TTM | $2.3B | $415.8M | $548.4M | $978.4M | $396.7M | $1.4B | $205.3M |
| Year | Revenue Change (%) | Cost of Revenue Change (%) | R&D Change (%) | Sales & Marketing Change (%) | G&A Change (%) | SG&A Change (%) | Facilities / D&A Change (%) |
|---|---|---|---|---|---|---|---|
| 2023 | 32.97 | 31.40 | 20.06 | 28.63 | 21.25 | 26.58 | 32.72 |
| 2024 | 28.76 | 46.61 | 17.66 | 24.48 | 27.78 | 25.36 | -5.96 |
| 2025 | 29.85 | 44.55 | 21.62 | 23.47 | 39.78 | 27.90 | 48.56 |
| TTM | 7.41 | 14.60 | 7.00 | 6.25 | 1.89 | 4.96 | 8.23 |
No unmapped expenses.
Balance Sheet
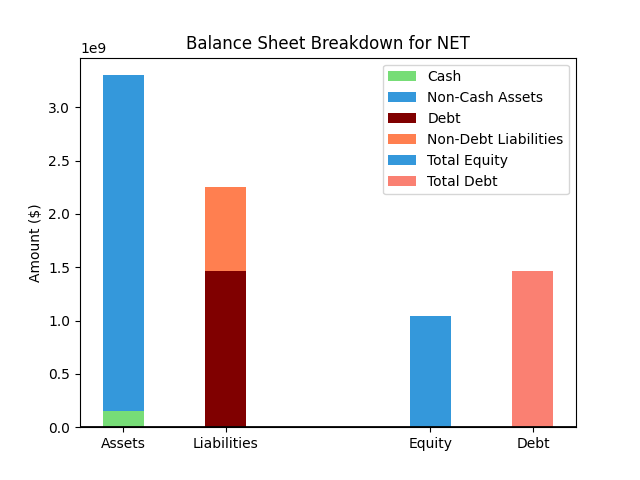
| Metric | Value | |
|---|---|---|
| 0 | Total Assets | $6,164M |
| 1 | Cash | $932M |
| 2 | Total Liabilities | $4,637M |
| 3 | Total Debt | $3,525M |
| 4 | Total Equity | $1,527M |
| 5 | Debt to Equity Ratio | 2.31 |
EPS & Dividend

Valuation
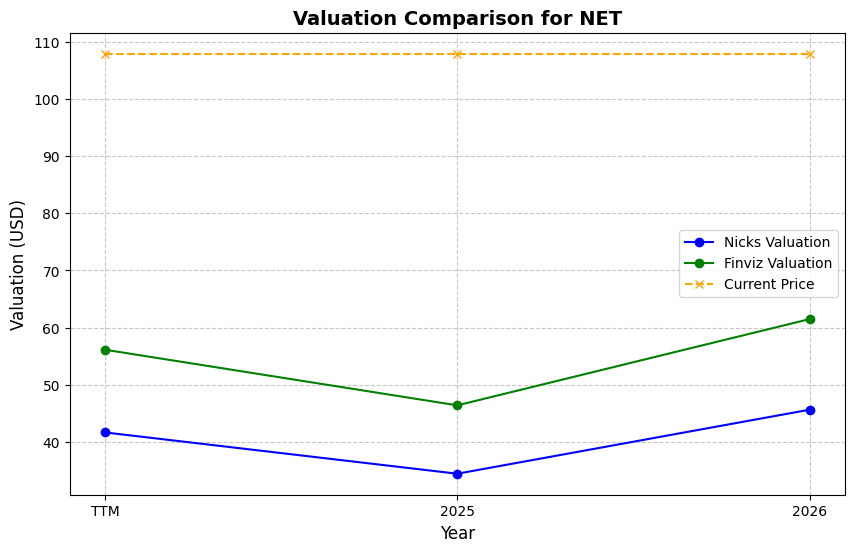
| Share Price | Treasury Yield | Estimates | Fair Value (P/E) | Fair Value (P/S) | Current P/S | Current P/E |
|---|---|---|---|---|---|---|
| $241.82 | 4.5% | Nicks Growth: 20% Nick's Expected Margin: 20% FINVIZ Growth: 28% |
Nicks: 42 Finviz: 85 |
Nick's: 8.484 | 36.7 | - |
| Basis | Year | Nicks Valuation | Nicks vs Share Price | Finviz Valuation | Finviz vs Share Price |
|---|---|---|---|---|---|
| $6.59 Revenue | TTM | $55.89 | -76.9% | $112.39 | -53.5% |
| $1.19 EPS | 2026 | $50.69 | -79.0% | $101.92 | -57.9% |
| $1.53 EPS | 2027 | $64.70 | -73.2% | $130.10 | -46.2% |
Implied Growth
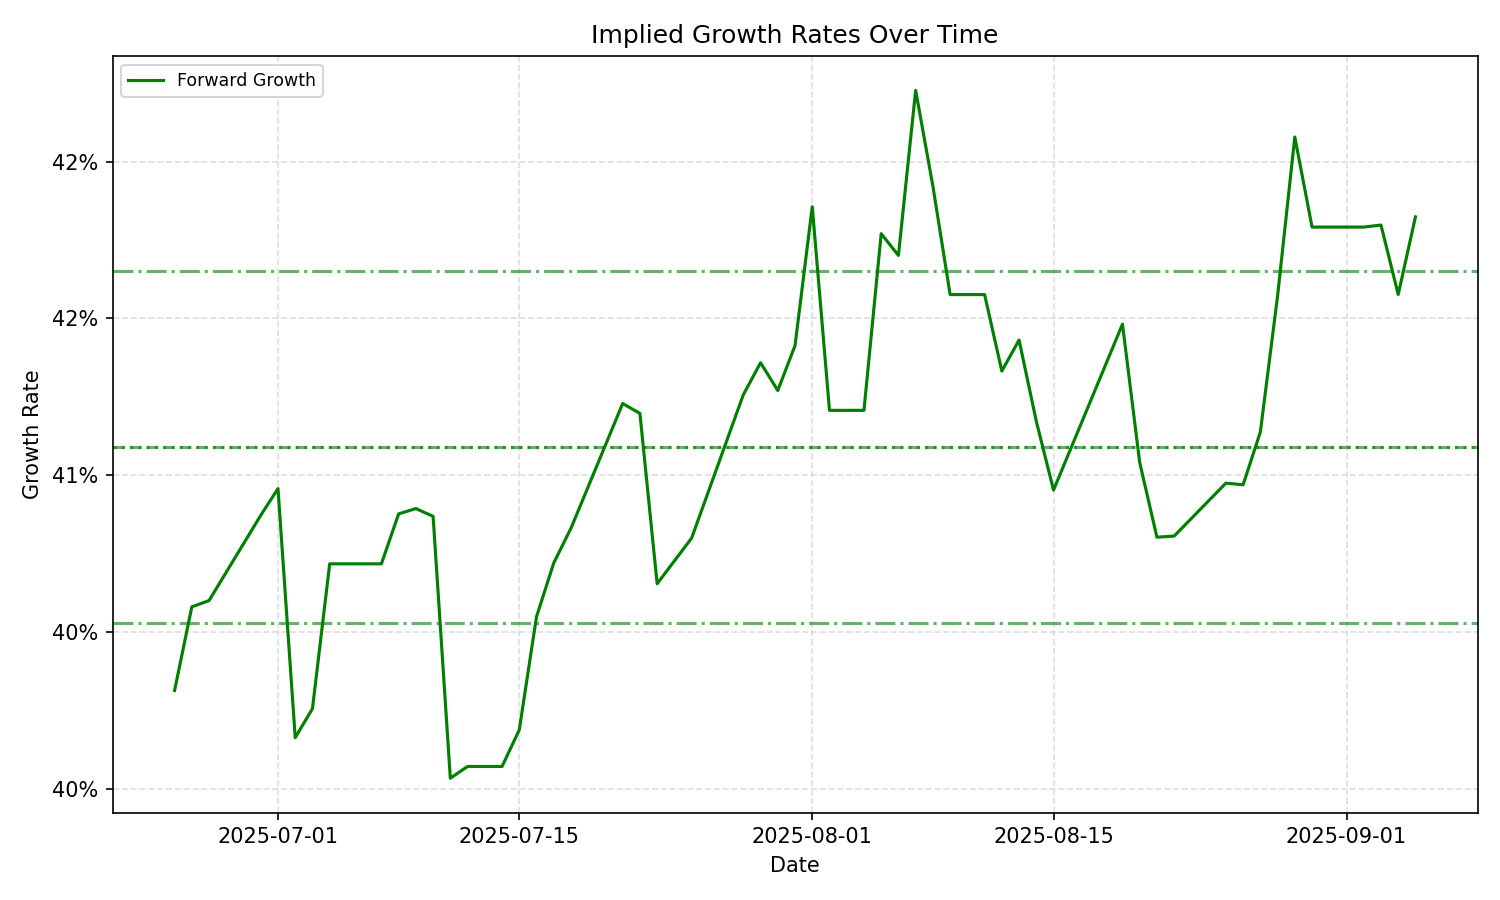
| Average | Median | Std Dev | Current | Percentile | ||||||
|---|---|---|---|---|---|---|---|---|---|---|
| TTM | Forward | TTM | Forward | TTM | Forward | TTM | Forward | TTM | Forward | |
| Timeframe | ||||||||||
| 1 Year | – | 38.52% | – | 40.40% | – | 3.58% | – | 35.52% | – | 32.2% |
| 3 Years | – | 38.52% | – | 40.40% | – | 3.58% | – | 35.52% | – | 32.2% |
| 5 Years | – | 38.52% | – | 40.40% | – | 3.58% | – | 35.52% | – | 32.2% |
| 10 Years | – | 38.52% | – | 40.40% | – | 3.58% | – | 35.52% | – | 32.2% |