Norwegian Cruise Line Holdings — NCLH
| Close Price | Market Cap | P/E Ratio | Forward P/E Ratio | Implied Growth* | Implied Forward Growth* | Dividend | P/B Ratio |
|---|---|---|---|---|---|---|---|
| $18.34 | $8.42B | 14.8 | 9.1 | 8.4% | 3.5% | - | 3.5 |
Latest Headlines
- · Did You Know That Viking Holdings Has Doubled Over the Past Year?
- · Oil Prices Fall As U.S., Iran May End 'Game Of Chicken'; S&P 500 Rises
- · 1 Small-Cap Stock Worth Your Attention and 2 We Brush Off
- · Norwegian Cruise Line Holdings Ltd. (NCLH) is Attracting Investor Attention: Here is What You Should Know
- · John Chidsey Bought 2,348% More Shares In Norwegian Cruise Line Holdings
- · Stocks Settle Mixed on Conflicting US-Iran Signals
Revenue & Net Income
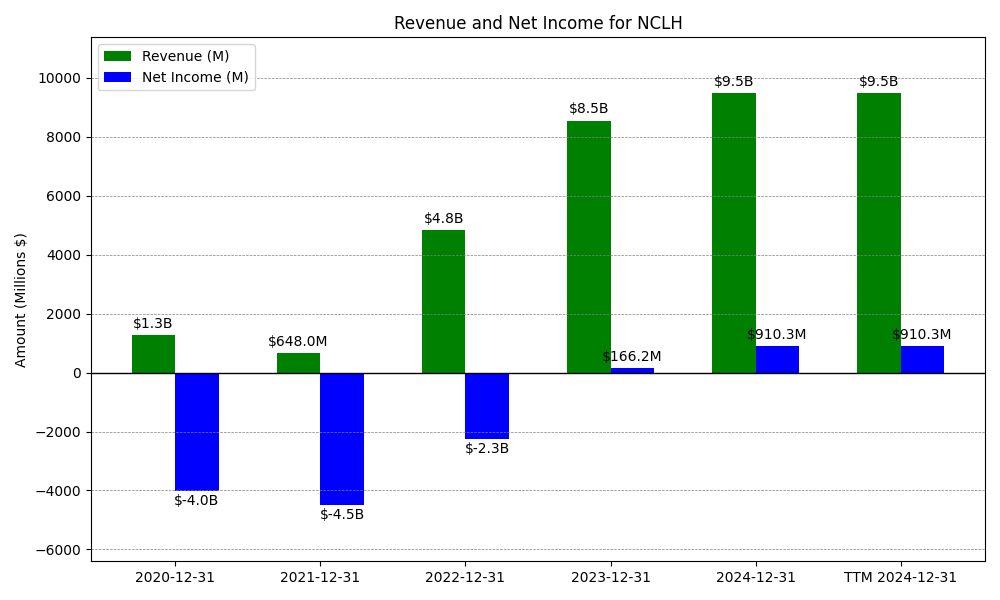
| Date | Revenue | Net_Income | EPS | Last_Updated | Revenue_Change | Net_Income_Change | EPS_Change | |
|---|---|---|---|---|---|---|---|---|
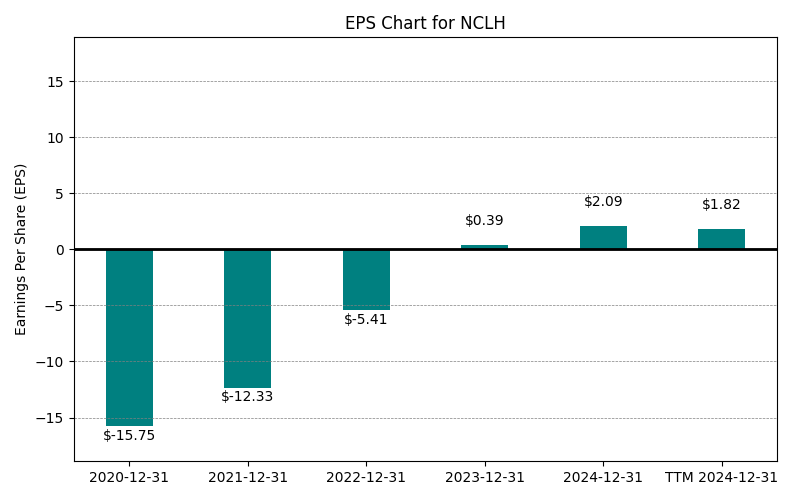
| 0 | 2020-12-31 | $1,280M | $-4,013M | $-15.75 | 2024-02-03 03:17:10 | N/A | N/A | N/A |
| 1 | 2021-12-31 | $648M | $-4,507M | $-12.33 | 2026-03-09 08:42:14 | -49.4% | 12.3% | -21.7% |
| 2 | 2022-12-31 | $4,844M | $-2,270M | $-5.41 | 2026-05-29 09:12:21 | 647.5% | -49.6% | -56.1% |
| 3 | 2023-12-31 | $8,550M | $166M | $0.39 | 2026-05-29 09:12:21 | 76.5% | -107.3% | -107.2% |
| 4 | 2024-12-31 | $9,480M | $910M | $2.09 | 2026-05-29 09:12:21 | 10.9% | 447.8% | 435.9% |
| 5 | 2025-12-31 | $9,828M | $423M | $0.94 | 2026-05-29 09:12:21 | 3.7% | -53.5% | -55.0% |
| 6 | TTM 2026-03-31 | $10,031M | $568M | $1.24 | 2026-05-11 09:12:42 | 2.1% | 34.2% | 31.9% |
EPS
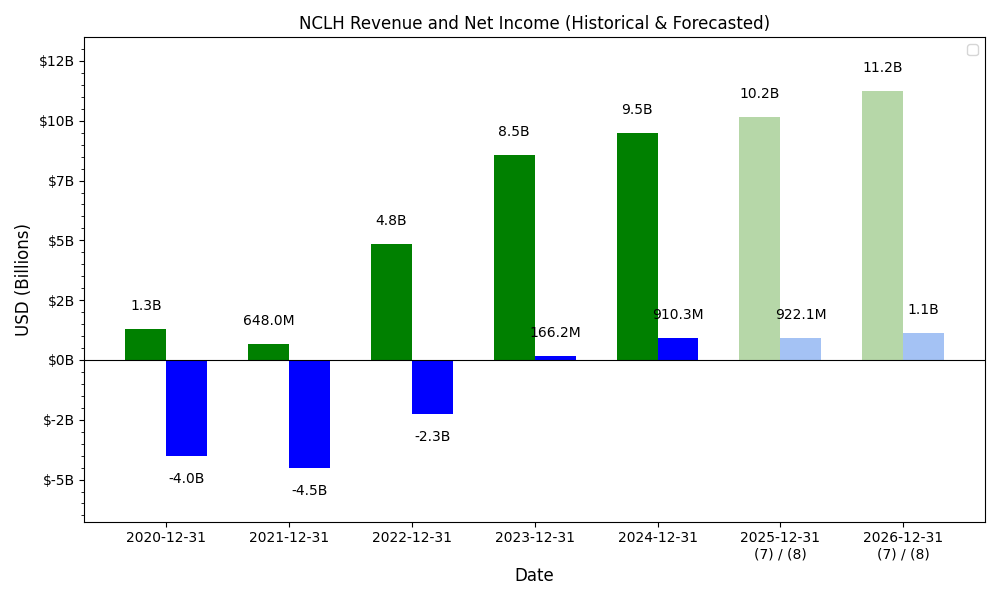
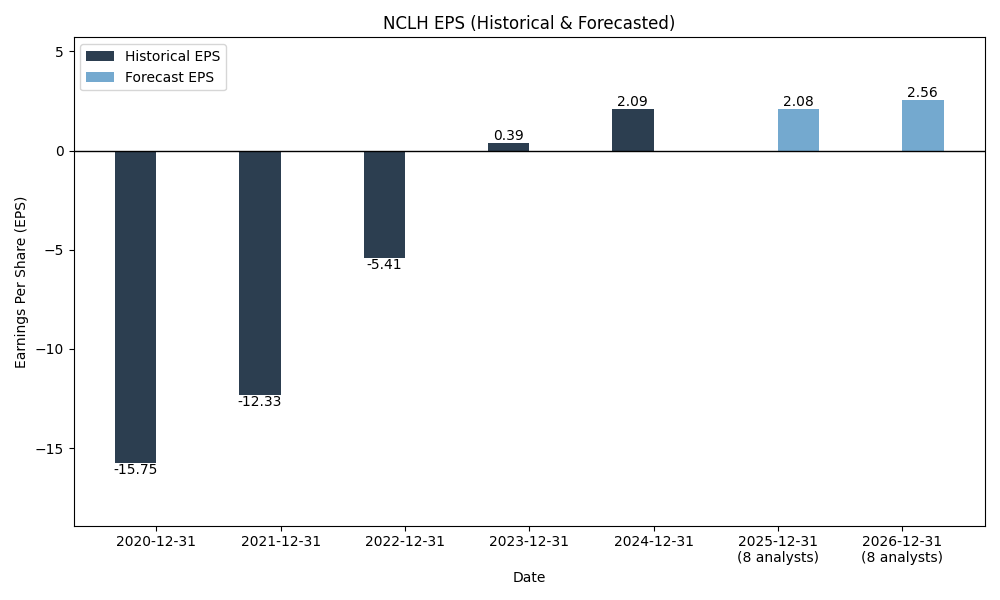
Forecasts
Y/Y % Change
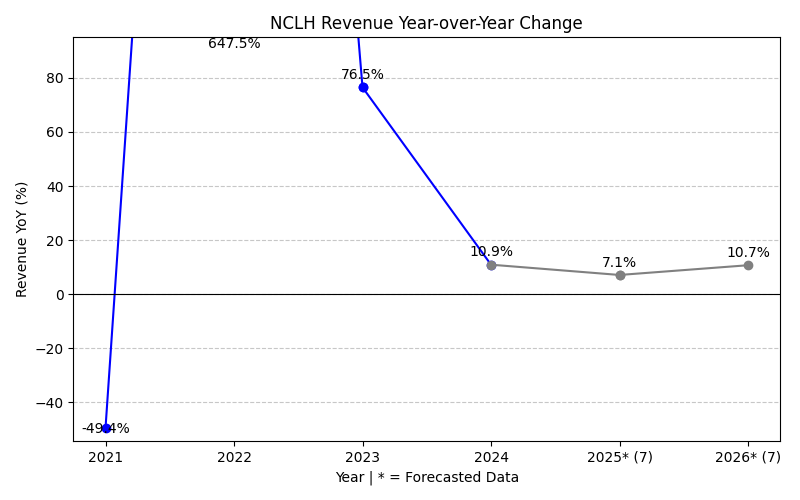
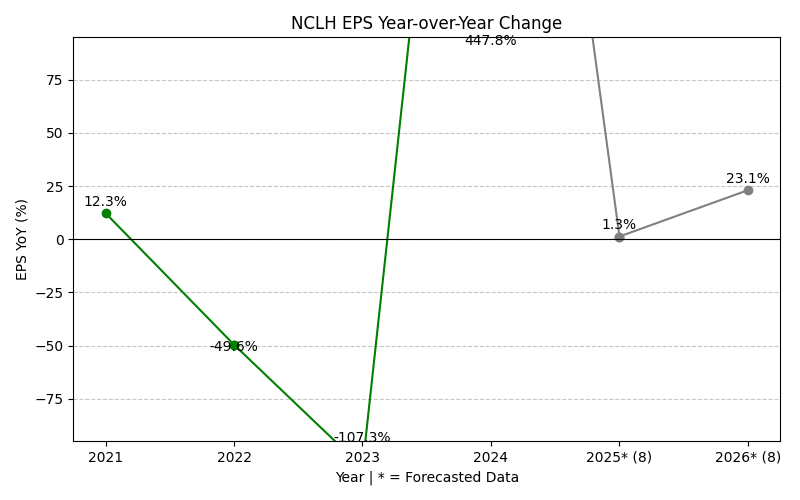
NCLH Year-over-Year Growth
| 2020 | 2021 | 2022 | 2023 | 2024 | 2025 | 2026 | 2027 | Average | |
|---|---|---|---|---|---|---|---|---|---|
| Revenue Growth (%) | -49.4% | 647.5% | 76.5% | 10.9% | 3.7% | 3.2% | 6.8% | 99.9% | |
| Revenue Analysts (#) | 0 | 0 | 0 | 0 | 0 | 0 | 19 | 20 | |
| EPS Growth (%) | 12.3% | -49.6% | -107.3% | 447.8% | -53.5% | 78.9% | 22.3% | 50.1% | |
| EPS Analysts (#) | 0 | 0 | 0 | 0 | 0 | 0 | 22 | 22 |
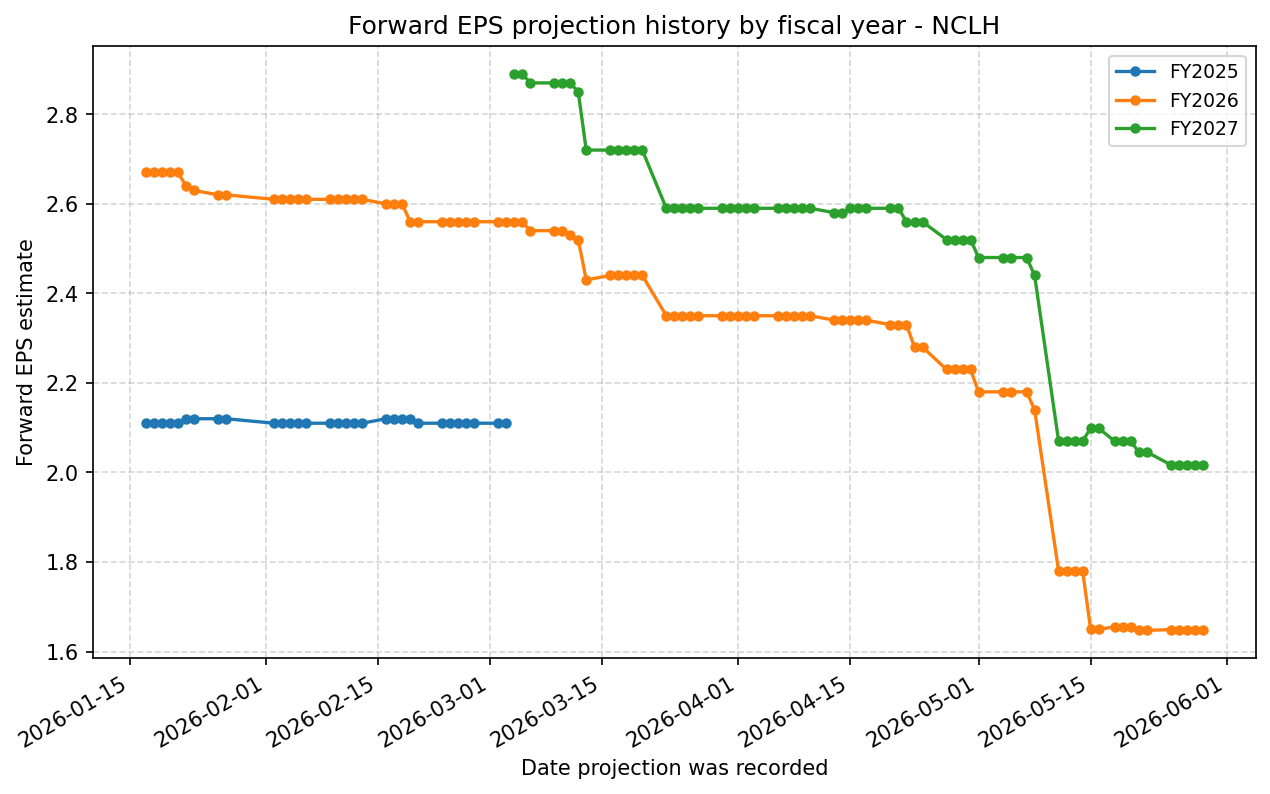
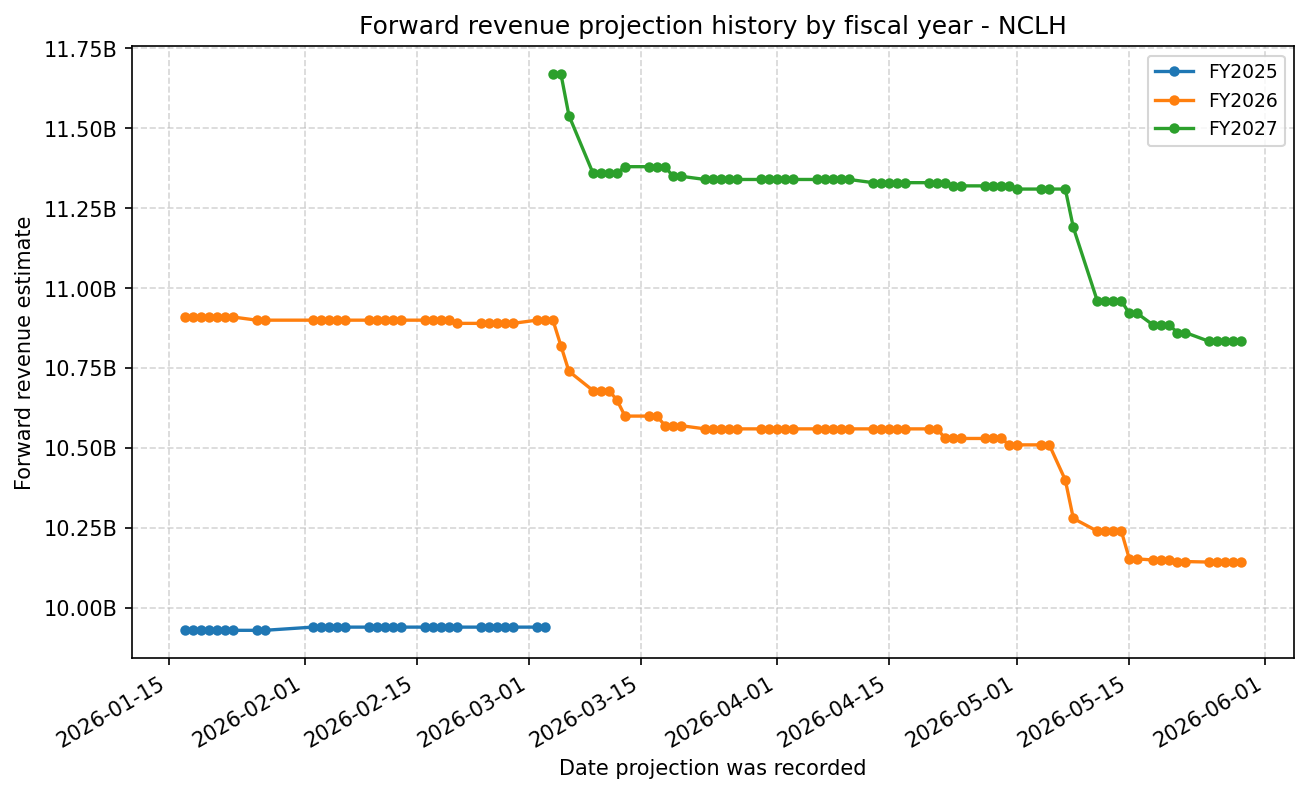
Forward Estimate History
How the next-FY EPS and revenue estimates have drifted over time. One line per fiscal year – past lines end when that FY became current.
Expenses
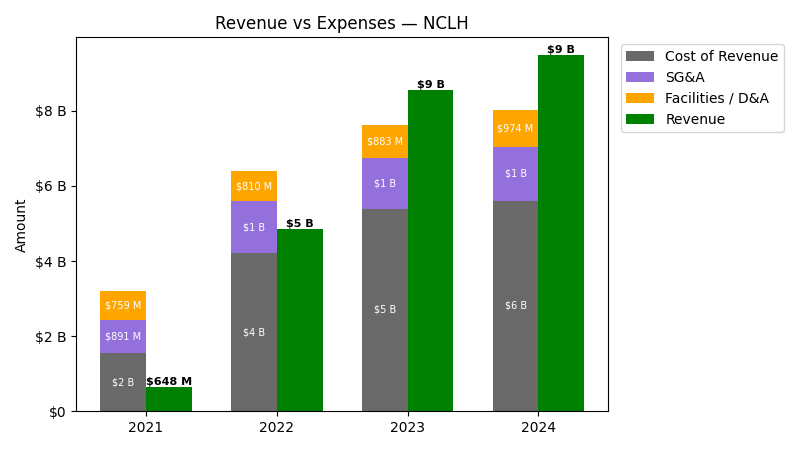
| Year | Revenue ($) | Cost of Revenue ($) | SG&A ($) | Facilities / D&A ($) |
|---|---|---|---|---|
| 2022 | $4.8B | $3.4B | $1.4B | $810.1M |
| 2023 | $8.5B | $4.5B | $1.3B | $883.2M |
| 2024 | $9.5B | $4.6B | $1.4B | $973.5M |
| 2025 | $9.8B | $4.4B | $1.5B | $1.2B |
| TTM | $10.0B | $4.4B | $1.6B | $1.2B |
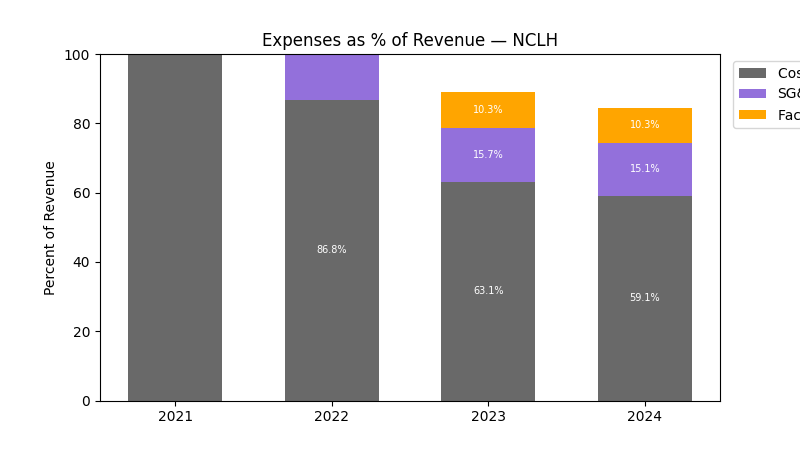
| Year | Revenue Change (%) | Cost of Revenue Change (%) | SG&A Change (%) | Facilities / D&A Change (%) |
|---|---|---|---|---|
| 2023 | 76.51 | 32.81 | -2.70 | 9.03 |
| 2024 | 10.87 | 2.69 | 6.93 | 10.22 |
| 2025 | 3.67 | -5.14 | 7.95 | 19.37 |
| TTM | 2.07 | 0.95 | 4.41 | 2.65 |
No unmapped expenses.
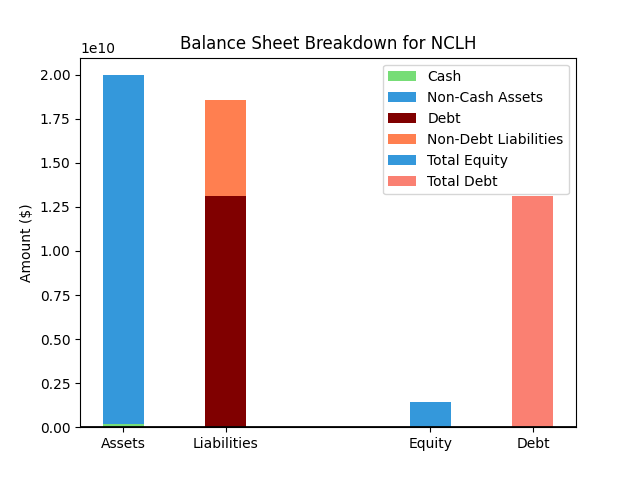
Balance Sheet
| Metric | Value | |
|---|---|---|
| 0 | Total Assets | $23,795M |
| 1 | Cash | $185M |
| 2 | Total Liabilities | $21,363M |
| 3 | Total Debt | $15,155M |
| 4 | Total Equity | $2,431M |
| 5 | Debt to Equity Ratio | 6.23 |
EPS & Dividend

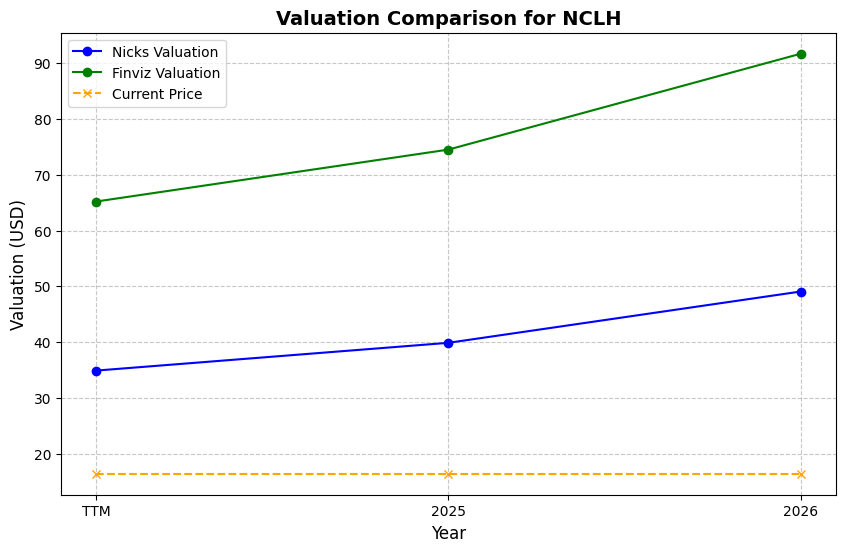
Valuation
| Share Price | Treasury Yield | Estimates | Fair Value (P/E) | Fair Value (P/S) | Current P/S | Current P/E |
|---|---|---|---|---|---|---|
| $18.34 | 4.5% | Nicks Growth: 11% Nick's Expected Margin: 4% FINVIZ Growth: 4% |
Nicks: 19 Finviz: 9 |
Nick's: 0.754 | 0.8 | 14.8 |
| Basis | Year | Nicks Valuation | Nicks vs Share Price | Finviz Valuation | Finviz vs Share Price |
|---|---|---|---|---|---|
| $1.24 EPS | TTM | $23.38 | 27.5% | $11.66 | -36.4% |
| $1.65 EPS | 2026 | $31.09 | 69.5% | $15.51 | -15.5% |
| $2.02 EPS | 2027 | $38.03 | 107.4% | $18.97 | 3.4% |
Implied Growth
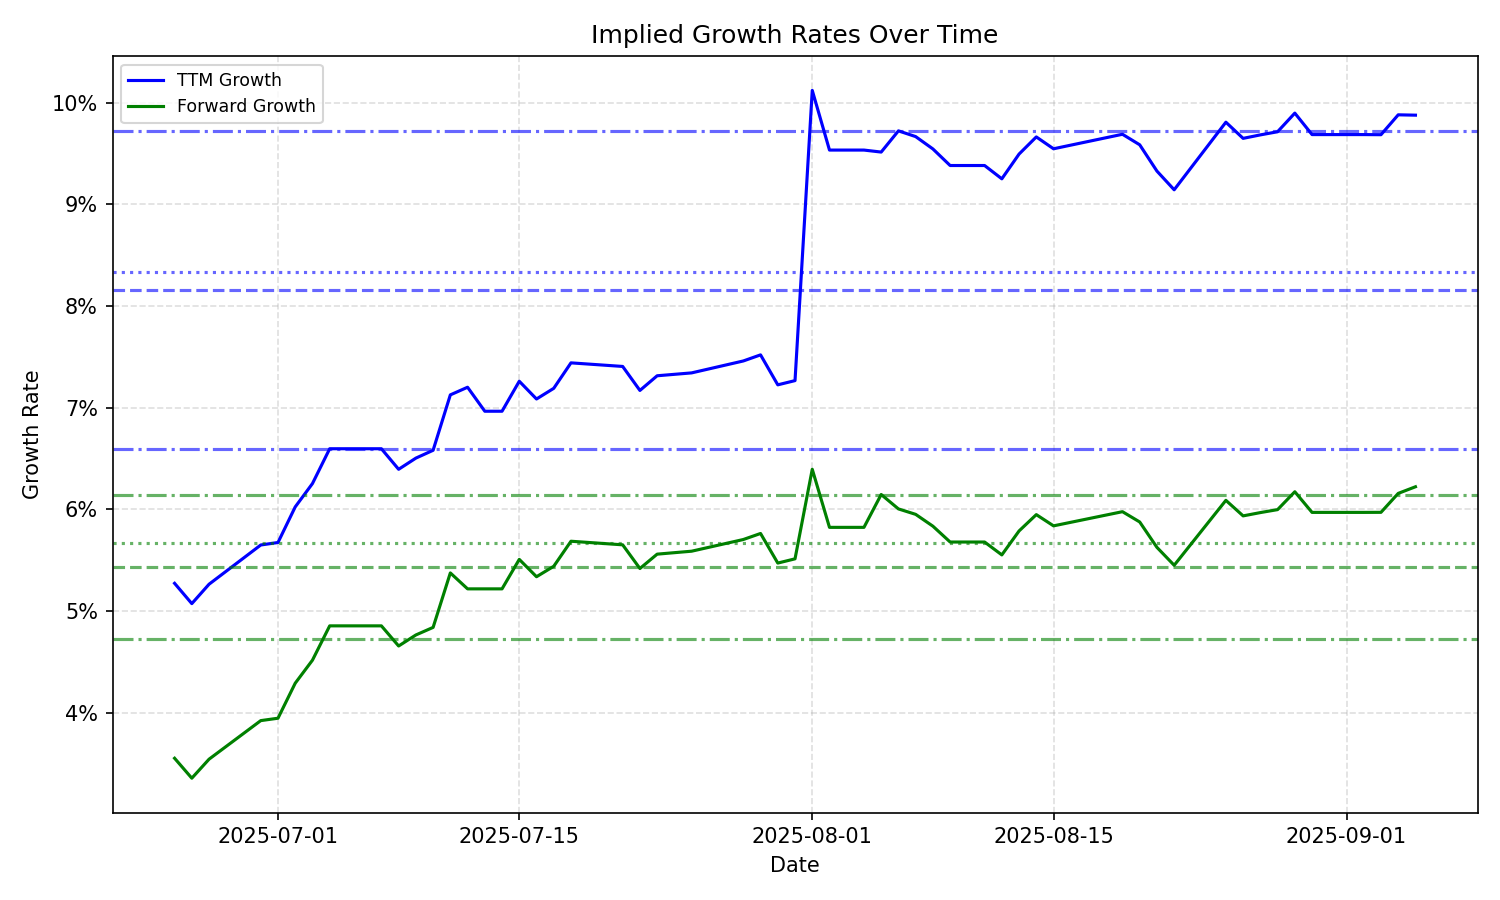
| Average | Median | Std Dev | Current | Percentile | ||||||
|---|---|---|---|---|---|---|---|---|---|---|
| TTM | Forward | TTM | Forward | TTM | Forward | TTM | Forward | TTM | Forward | |
| Timeframe | ||||||||||
| 1 Year | 9.05% | 3.64% | 9.16% | 3.16% | 1.80% | 1.76% | 8.41% | 3.47% | 36.0% | 56.6% |
| 3 Years | 9.05% | 3.64% | 9.16% | 3.16% | 1.80% | 1.76% | 8.41% | 3.47% | 36.0% | 56.6% |
| 5 Years | 9.05% | 3.64% | 9.16% | 3.16% | 1.80% | 1.76% | 8.41% | 3.47% | 36.0% | 56.6% |
| 10 Years | 9.05% | 3.64% | 9.16% | 3.16% | 1.80% | 1.76% | 8.41% | 3.47% | 36.0% | 56.6% |