Micron Technology, Inc. — MU
| Close Price | Market Cap | P/E Ratio | Forward P/E Ratio | Implied Growth* | Implied Forward Growth* | Dividend | P/B Ratio |
|---|---|---|---|---|---|---|---|
| $971.00 | $1.10T | 45.9 | 9.2 | 20.9% | 3.6% | $0.60 0.1% | 15.1 |
Latest Headlines
- · The Memory Shortage Is Just Beginning. The Consumer Pain Is Already Here.
- · Dell Technologies Crushes Earnings: AI Buildout Remains Robust
- · US Equity Indexes Break Records This Week as Mega-Cap Tech Soars, Trump Close to Announcing Decision on Iran
- · Micron Joined The $1 Trillion Club With Its Blistering Rally This Week. Here's How Much Traders See It Moving Next Week
- · This Risk ETF Is Riding Its Best Seven-Day Stretch in a Year
- · More Drivers Are Joining the High-Miles Club. This Stock Could Pull Ahead.
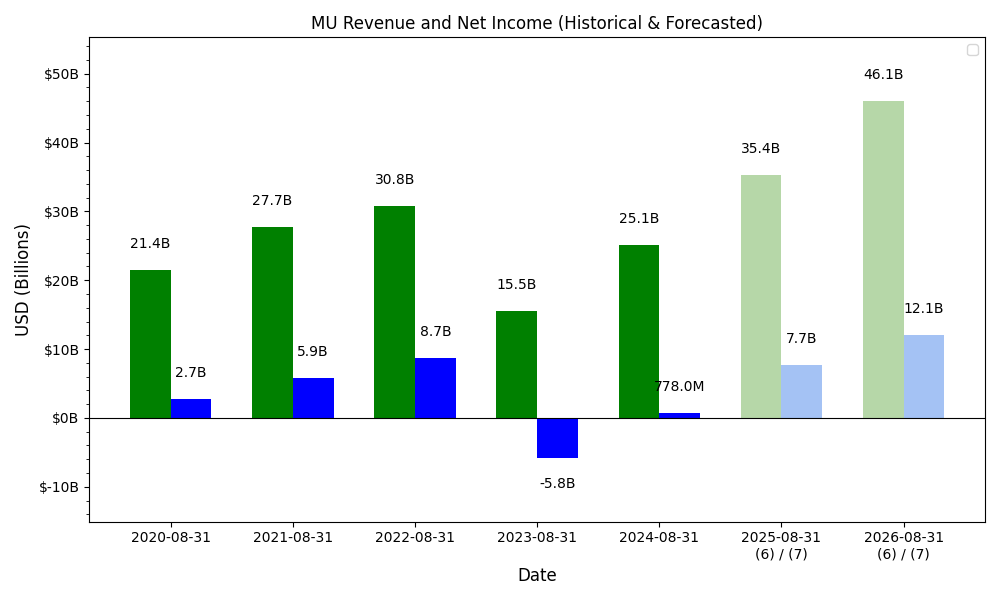
Revenue & Net Income
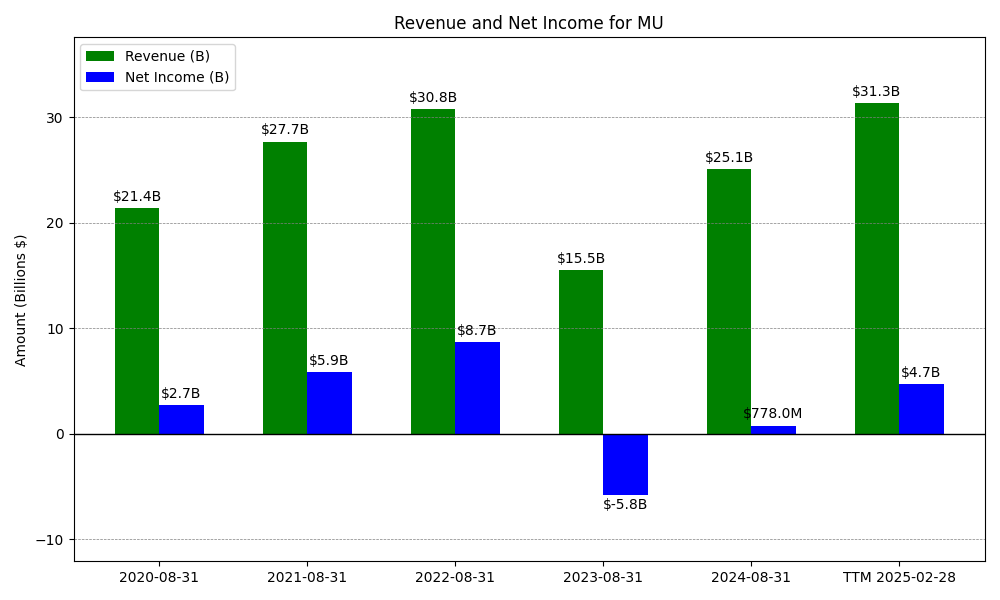
| Date | Revenue | Net_Income | EPS | Last_Updated | Revenue_Change | Net_Income_Change | EPS_Change | |
|---|---|---|---|---|---|---|---|---|
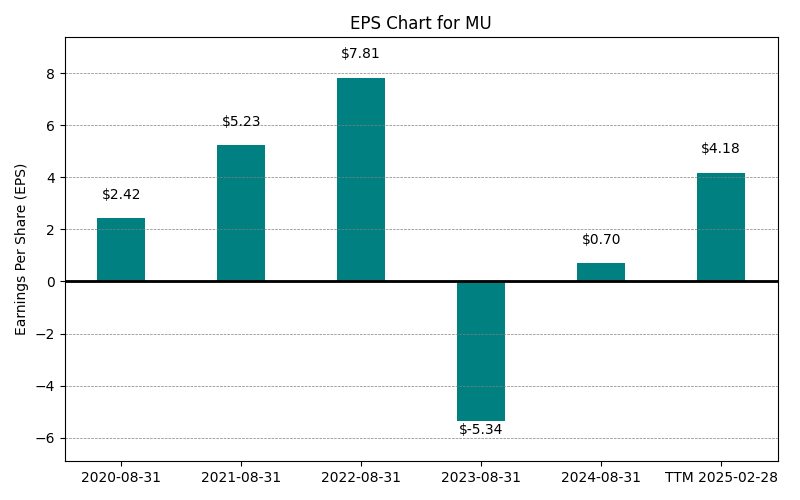
| 0 | 2020-08-31 | $21,435M | $2,687M | $2.42 | 2024-02-04 04:18:35 | N/A | N/A | N/A |
| 1 | 2021-08-31 | $27,705M | $5,861M | $5.23 | 2024-02-04 04:18:35 | 29.3% | 118.1% | 116.1% |
| 2 | 2022-08-31 | $30,758M | $8,687M | $7.81 | 2026-05-29 09:12:14 | 11.0% | 48.2% | 49.3% |
| 3 | 2023-08-31 | $15,540M | $-5,833M | $-5.34 | 2026-05-29 09:12:14 | -49.5% | -167.1% | -168.4% |
| 4 | 2024-08-31 | $25,111M | $778M | $0.70 | 2026-05-29 09:12:14 | 61.6% | -113.3% | -113.1% |
| 5 | 2025-08-31 | $37,378M | $8,539M | $7.65 | 2026-05-29 09:12:14 | 48.9% | 997.6% | 992.9% |
| 6 | TTM 2026-02-28 | $58,119M | $24,111M | $21.15 | 2026-03-23 08:52:23 | 55.5% | 182.4% | 176.5% |
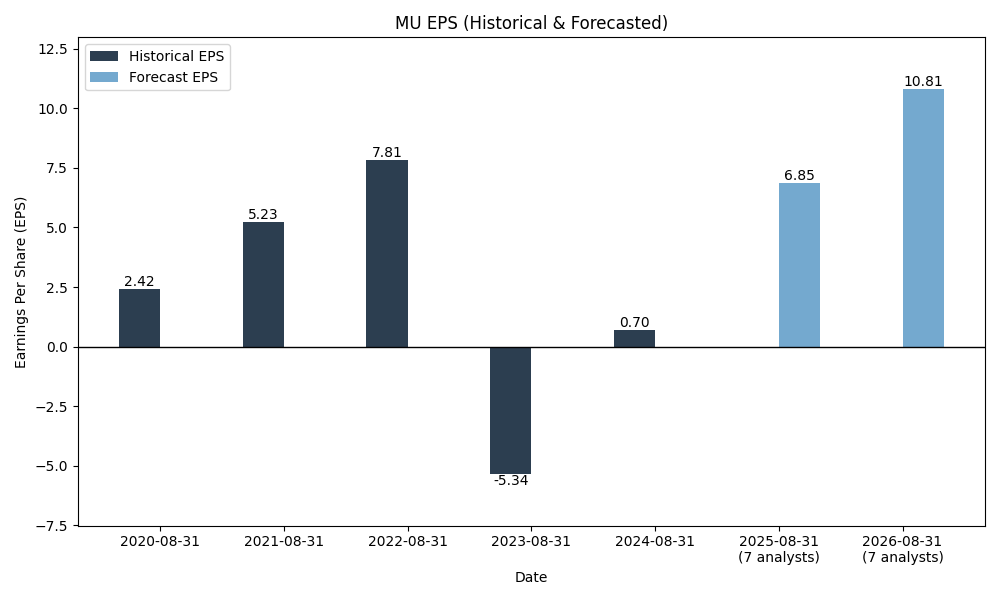
EPS
Forecasts
Y/Y % Change
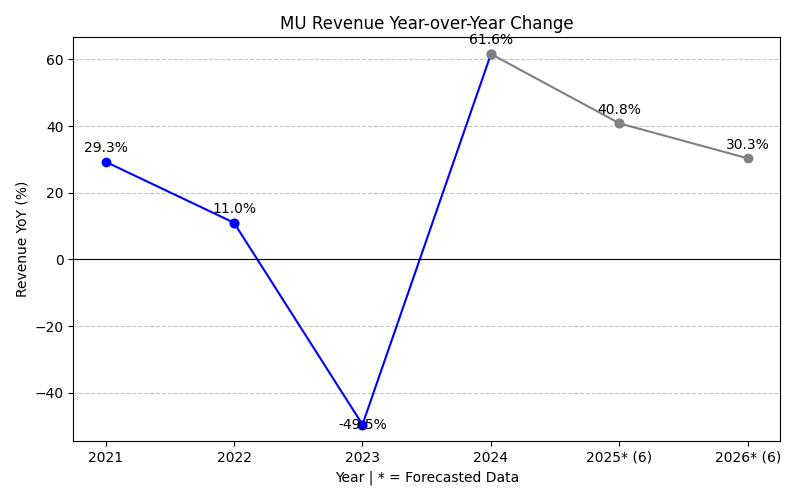
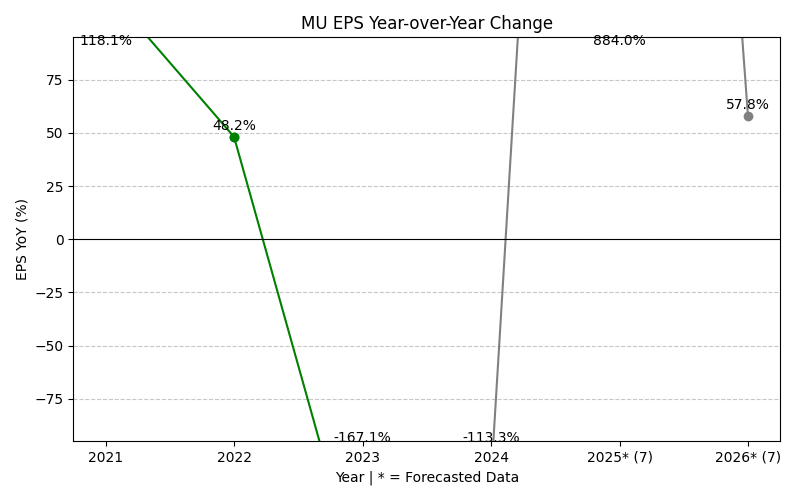
MU Year-over-Year Growth
| 2020 | 2021 | 2022 | 2023 | 2024 | 2025 | 2026 | 2027 | Average | |
|---|---|---|---|---|---|---|---|---|---|
| Revenue Growth (%) | 29.3% | 11.0% | -49.5% | 61.6% | 48.9% | 195.0% | 58.5% | 50.7% | |
| Revenue Analysts (#) | 0 | 0 | 0 | 0 | 0 | 0 | 36 | 39 | |
| EPS Growth (%) | 118.1% | 48.2% | -167.1% | -113.3% | 997.6% | 675.5% | 78.7% | 234.0% | |
| EPS Analysts (#) | 0 | 0 | 0 | 0 | 0 | 0 | 32 | 32 |
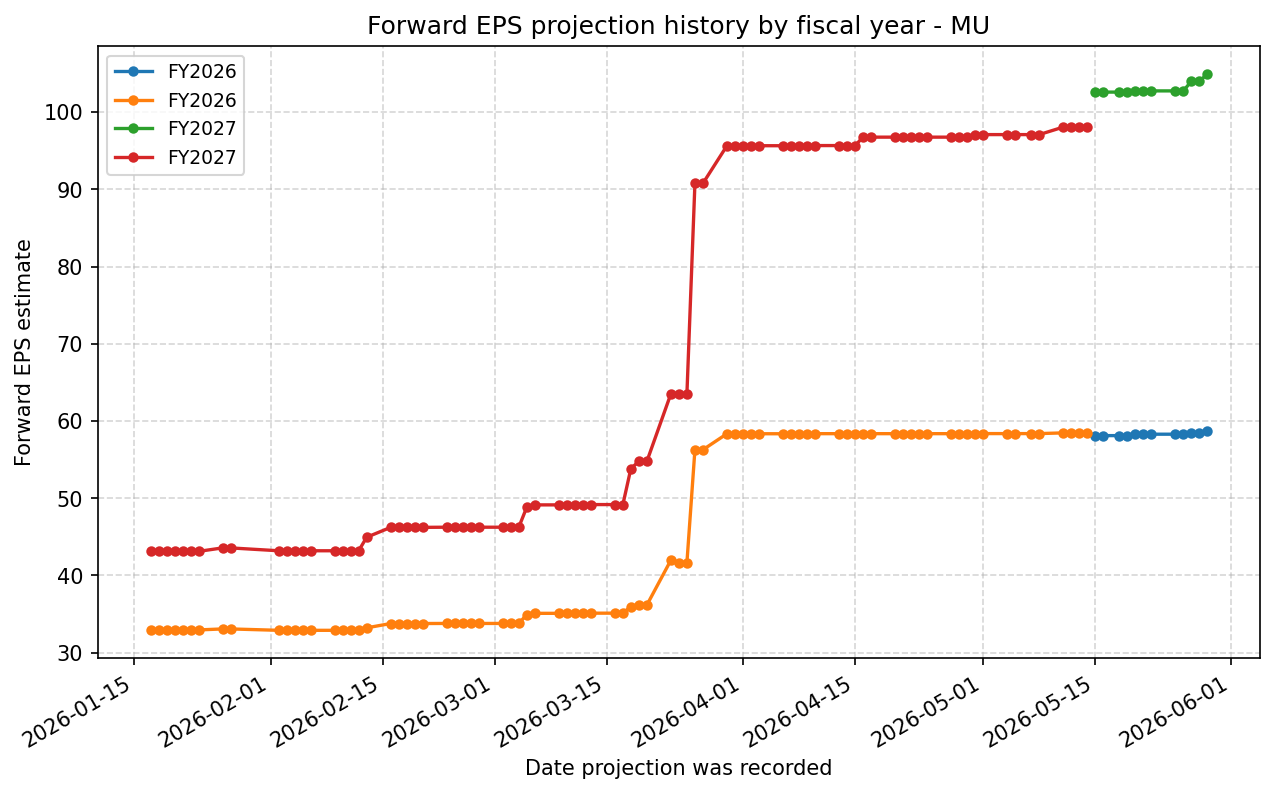
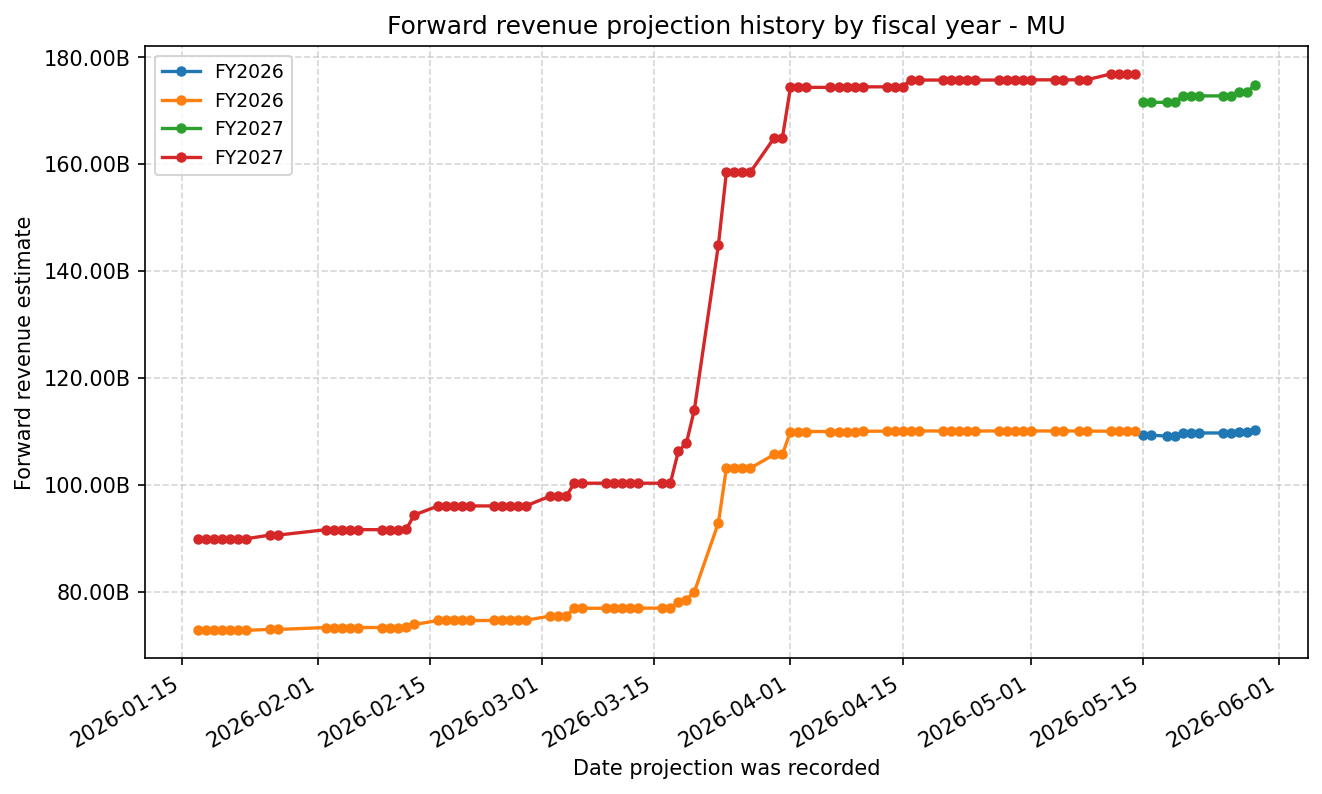
Forward Estimate History
How the next-FY EPS and revenue estimates have drifted over time. One line per fiscal year – past lines end when that FY became current.
Expenses
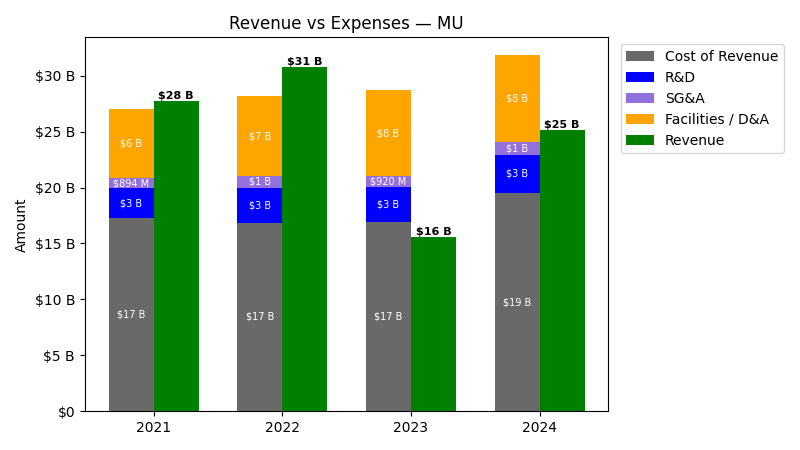
| Year | Revenue ($) | Cost of Revenue ($) | R&D ($) | SG&A ($) | Facilities / D&A ($) |
|---|---|---|---|---|---|
| 2022 | $30.8B | $9.7B | $3.1B | $1.1B | $7.1B |
| 2023 | $15.5B | $9.2B | $3.1B | $920.0M | $7.8B |
| 2024 | $25.1B | $11.7B | $3.4B | $1.1B | $7.8B |
| 2025 | $37.4B | $14.2B | $3.8B | $1.2B | $8.4B |
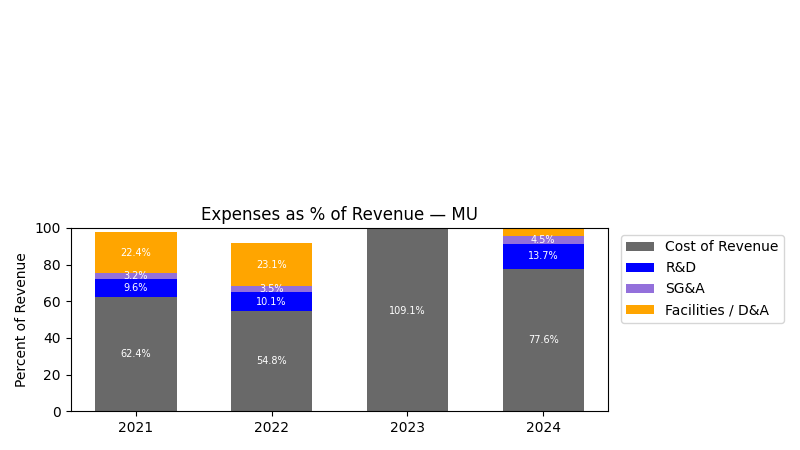
| Year | Revenue Change (%) | Cost of Revenue Change (%) | R&D Change (%) | SG&A Change (%) | Facilities / D&A Change (%) |
|---|---|---|---|---|---|
| 2023 | -49.48 | -5.58 | -0.06 | -13.70 | 8.99 |
| 2024 | 61.59 | 27.37 | 10.15 | 22.72 | 0.31 |
| 2025 | 48.85 | 20.78 | 10.73 | 6.73 | 7.35 |
No unmapped expenses.
Segment Performance
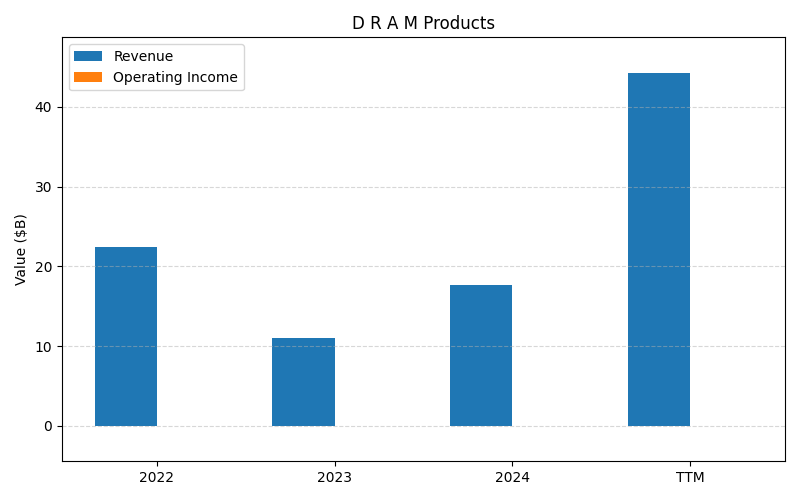
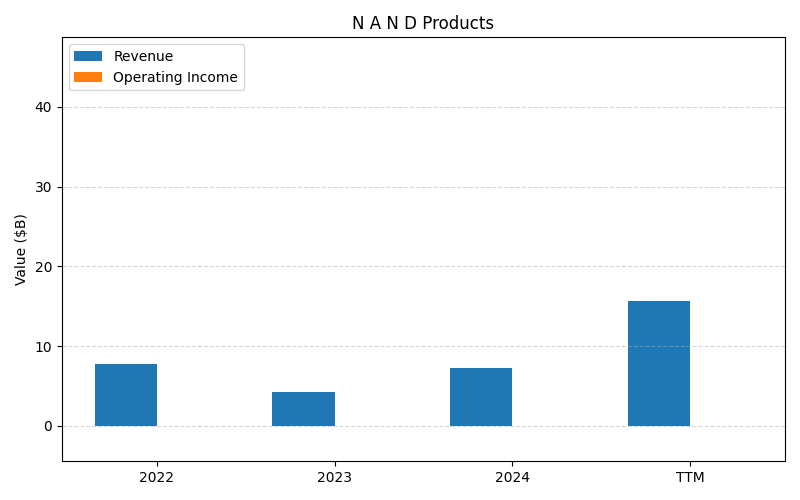
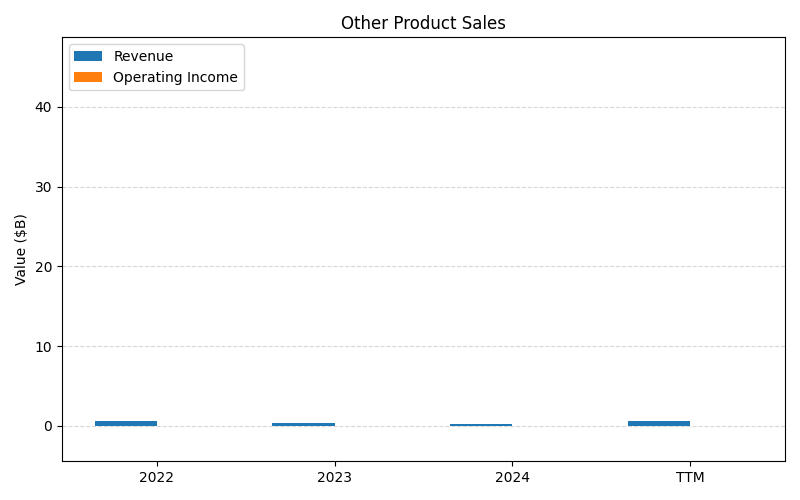
SEGMENTS v2025-09-09 · 2026-05-29 09:12 UTC — Units: $B. Rows list fiscal years (last 3 + TTM) with revenue for each segment; the final row shows the TTM revenue mix (operating income columns display “—” where mix is not applicable).
| Year | D R A M Products Rev | N A N D Products Rev | Other Product Sales Rev | Total Rev |
|---|---|---|---|---|
| 2023 | 11B | 4.21B | 0.36B | 15.5B |
| 2024 | 17.6B | 7.23B | 0.28B | 25.1B |
| 2025 | 28.6B | 8.50B | 0.30B | 37.4B |
| TTM | 113.2B | 34.4B | 1.07B | 148.7B |
| % of Total (TTM) | 76.1% | 23.2% | 0.7% | 100% |
Segment Performance (Axis 2)
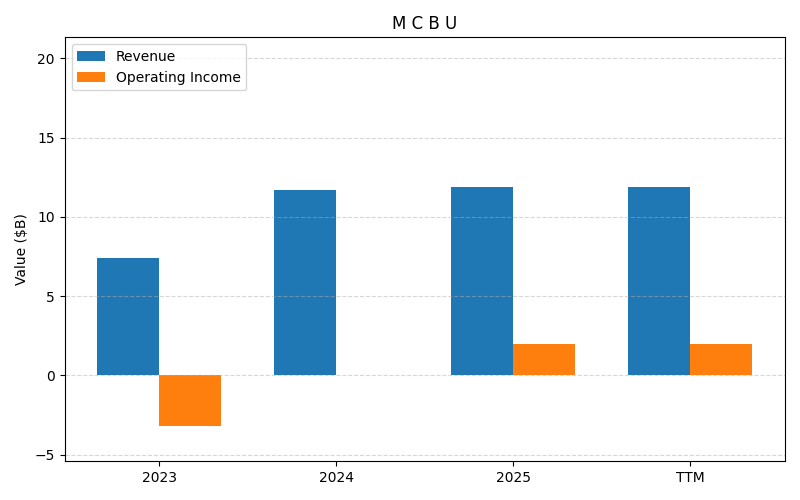
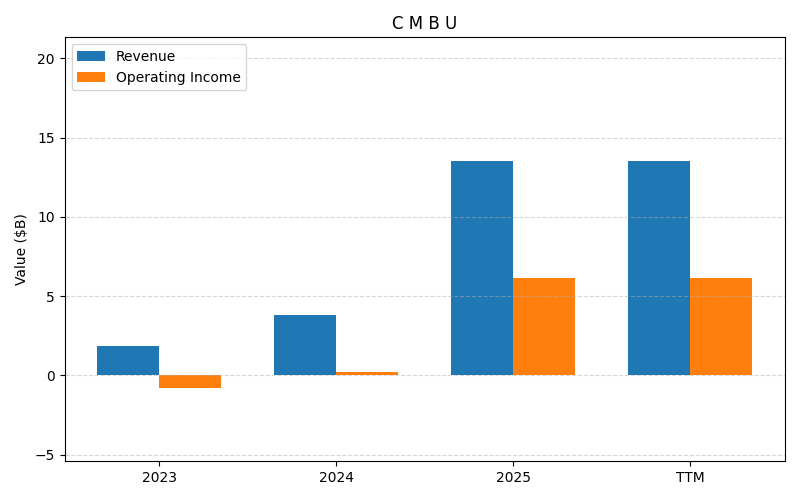
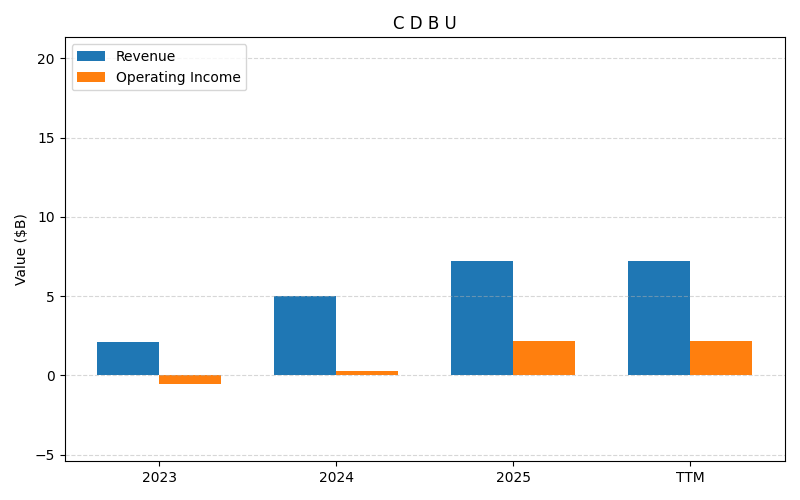
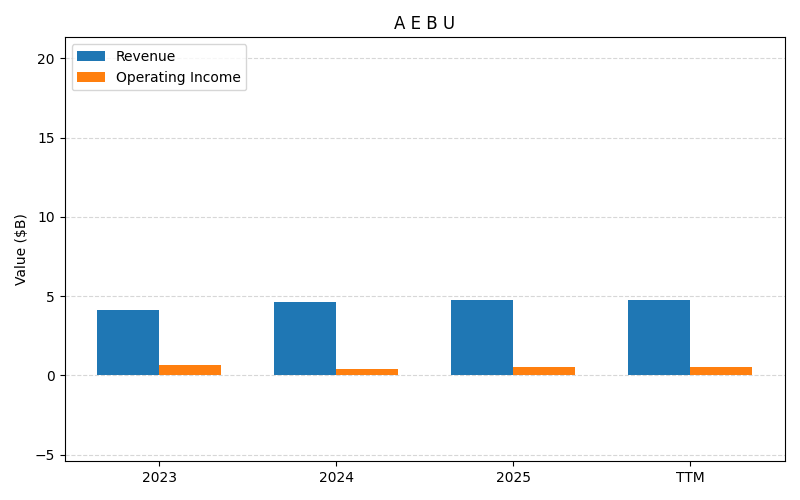
SEGMENTS v2025-09-09 · 2026-05-29 09:12 UTC — Units: $B. Rows list fiscal years (last 3 + TTM) with revenue and operating income for each segment; the final row shows the TTM revenue mix (operating income columns display “—” where mix is not applicable).
| Year | M C B U Rev | M C B U OI | C M B U Rev | C M B U OI | C D B U Rev | C D B U OI | A E B U Rev | A E B U OI | All Other Segments Rev | All Other Segments OI | Total Rev | Total OI |
|---|---|---|---|---|---|---|---|---|---|---|---|---|
| 2023 | 7.39B | -3.19B | 1.87B | -0.77B | 2.12B | -0.56B | 4.14B | 0.68B | 0.01B | 0.01B | 15.5B | -3.83B |
| 2024 | 11.7B | -0.00B | 3.79B | 0.24B | 4.98B | 0.26B | 4.63B | 0.43B | 0.04B | 0.02B | 25.1B | 0.95B |
| 2025 | 11.9B | 1.98B | 13.5B | 6.13B | 7.23B | 2.18B | 4.75B | 0.56B | 0.01B | -0.00B | 37.4B | 10.8B |
| TTM | 50.3B | 16.1B | 46.6B | 23.2B | 31.9B | 13B | 19.7B | 5.18B | 0.08B | 0.02B | 148.7B | 57.5B |
| % of Total (TTM) | 33.8% | — | 31.4% | — | 21.5% | — | 13.3% | — | 0.1% | — | 100% | — |
Balance Sheet
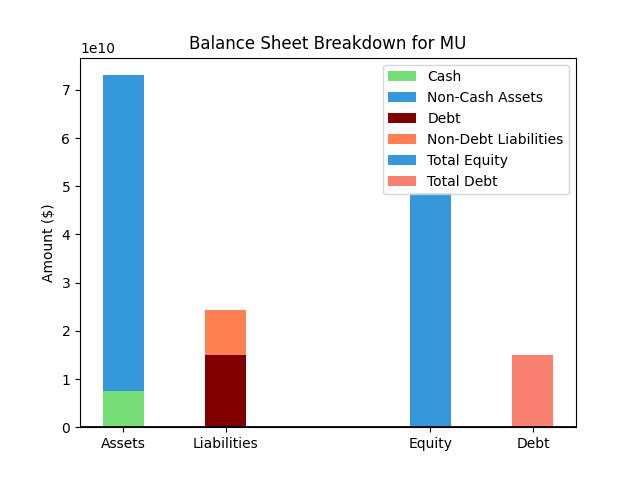
| Metric | Value | |
|---|---|---|
| 0 | Total Assets | $101,509M |
| 1 | Cash | $13,908M |
| 2 | Total Liabilities | $29,050M |
| 3 | Total Debt | $10,798M |
| 4 | Total Equity | $72,459M |
| 5 | Debt to Equity Ratio | 0.15 |
EPS & Dividend

Valuation
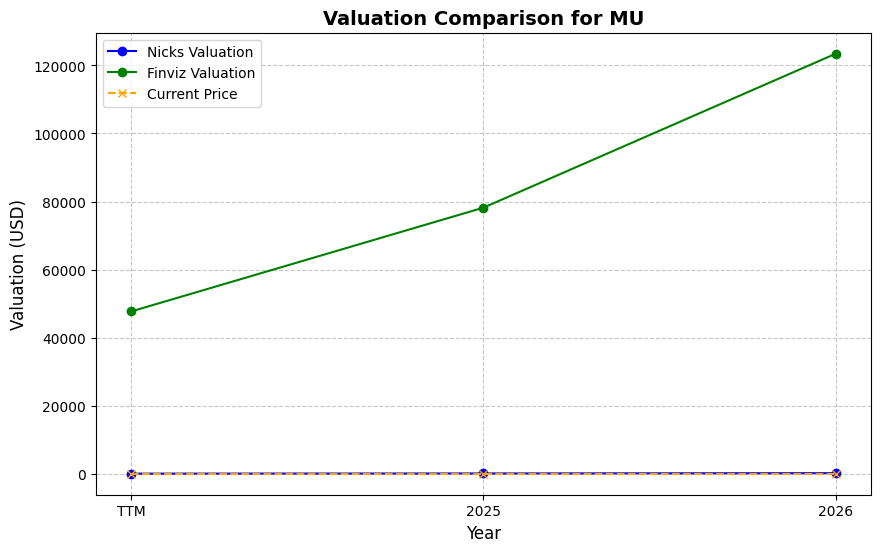
| Share Price | Treasury Yield | Estimates | Fair Value (P/E) | Fair Value (P/S) | Current P/S | Current P/E |
|---|---|---|---|---|---|---|
| $971.00 | 4.5% | Nicks Growth: 12% Nick's Expected Margin: 20% FINVIZ Growth: 126% |
Nicks: 21 Finviz: 28092 |
Nick's: 4.140 | 18.8 | 45.9 |
| Basis | Year | Nicks Valuation | Nicks vs Share Price | Finviz Valuation | Finviz vs Share Price |
|---|---|---|---|---|---|
| $21.15 EPS | TTM | $437.82 | -54.9% | $594138.89 | 61088.4% |
| $58.72 EPS | 2026 | $1215.58 | 25.2% | $1649595.02 | 169786.2% |
| $104.93 EPS | 2027 | $2172.14 | 123.7% | $2947697.19 | 303473.3% |
Implied Growth
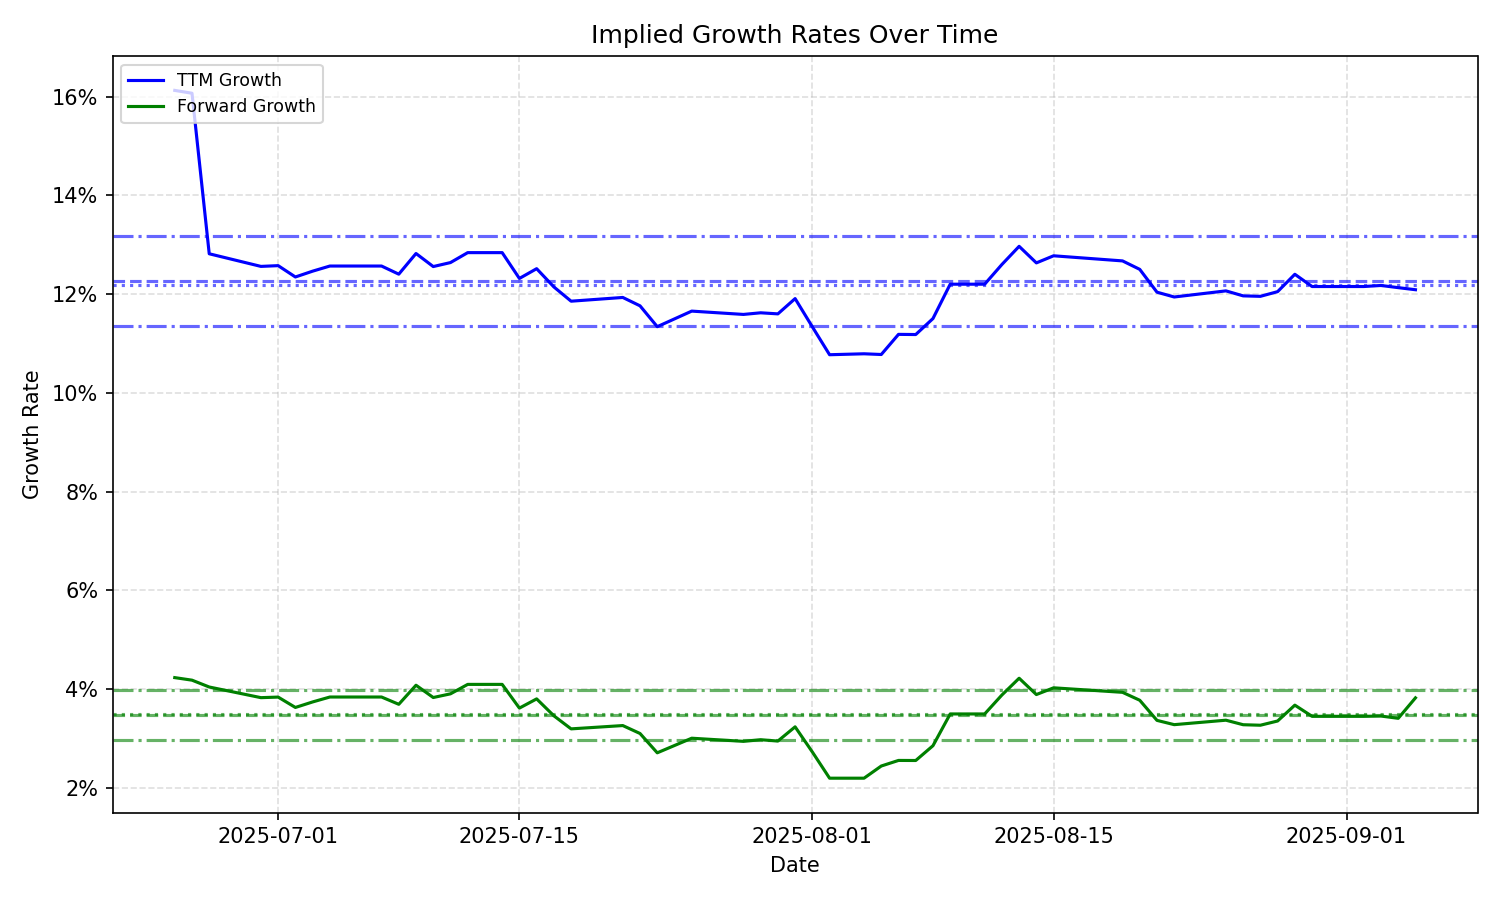
| Average | Median | Std Dev | Current | Percentile | ||||||
|---|---|---|---|---|---|---|---|---|---|---|
| TTM | Forward | TTM | Forward | TTM | Forward | TTM | Forward | TTM | Forward | |
| Timeframe | ||||||||||
| 1 Year | 14.68% | 3.61% | 14.53% | 3.40% | 2.74% | 4.07% | 20.34% | 3.19% | 99.6% | 43.2% |
| 3 Years | 14.68% | 3.61% | 14.53% | 3.40% | 2.74% | 4.07% | 20.34% | 3.19% | 99.6% | 43.2% |
| 5 Years | 14.68% | 3.61% | 14.53% | 3.40% | 2.74% | 4.07% | 20.34% | 3.19% | 99.6% | 43.2% |
| 10 Years | 14.68% | 3.61% | 14.53% | 3.40% | 2.74% | 4.07% | 20.34% | 3.19% | 99.6% | 43.2% |