Microsoft Corporation — MSFT
| Close Price | Market Cap | P/E Ratio | Forward P/E Ratio | Implied Growth* | Implied Forward Growth* | Dividend | P/B Ratio |
|---|---|---|---|---|---|---|---|
| $450.24 | $3.34T | 26.8 | 23.3 | 14.8% | 13.3% | $3.64 0.8% | 8.1 |
Latest Headlines
- · Nvidia Dropped a Cryptic Clue About Its Next Big Move Ahead of GTC Event
- · Wall Street's Equity Benchmarks Close Out May at Record Highs
- · Dell Soars Most Since 2018 on Outlook Fueled by AI Servers
- · Claude Pitches Under-The-Radar AI Stock That is Up 15% YTD
- · 'Volatility equals opportunity' in options trades as tech soars
- · Lenovo Stock Doubles in May on AI Server Boom—Best Month in 27 Years
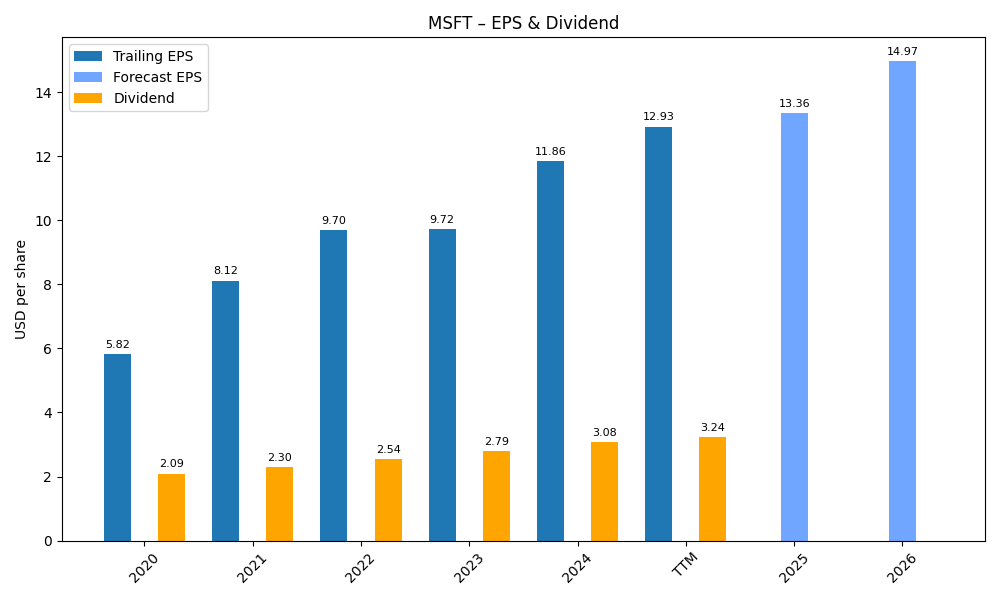
Revenue & Net Income
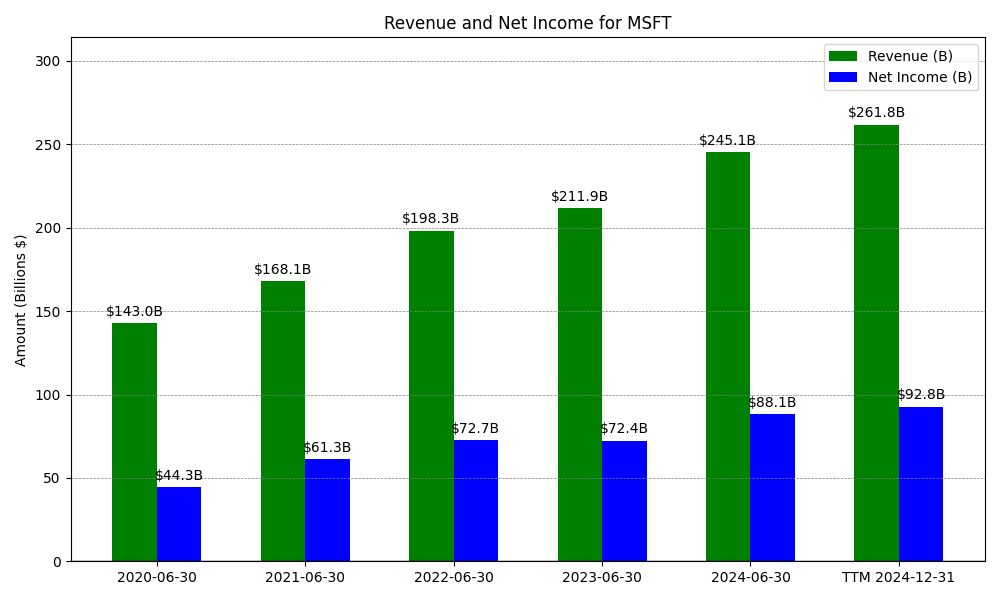
| Date | Revenue | Net_Income | EPS | Last_Updated | Revenue_Change | Net_Income_Change | EPS_Change | |
|---|---|---|---|---|---|---|---|---|
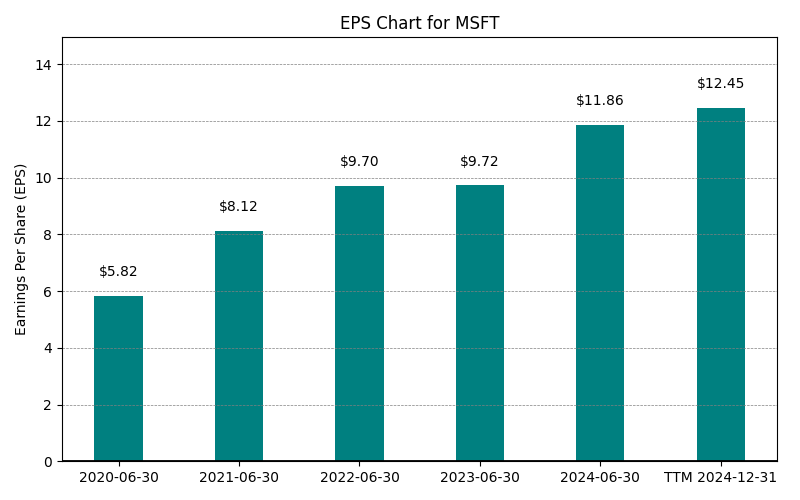
| 0 | 2020-06-30 | $143,015M | $44,281M | $5.82 | 2024-02-04 04:18:34 | N/A | N/A | N/A |
| 1 | 2021-06-30 | $168,088M | $61,271M | $8.12 | 2024-02-04 04:18:34 | 17.5% | 38.4% | 39.5% |
| 2 | 2022-06-30 | $198,270M | $72,738M | $9.70 | 2026-05-29 09:12:01 | 18.0% | 18.7% | 19.5% |
| 3 | 2023-06-30 | $211,915M | $72,361M | $9.72 | 2026-05-29 09:12:01 | 6.9% | -0.5% | 0.2% |
| 4 | 2024-06-30 | $245,122M | $88,136M | $11.86 | 2026-05-29 09:12:01 | 15.7% | 21.8% | 22.0% |
| 5 | 2025-06-30 | $281,724M | $101,832M | $13.70 | 2026-05-29 09:12:01 | 14.9% | 15.5% | 15.5% |
| 6 | TTM 2026-03-31 | $318,273M | $125,216M | $16.78 | 2026-05-01 08:45:14 | 13.0% | 23.0% | 22.5% |
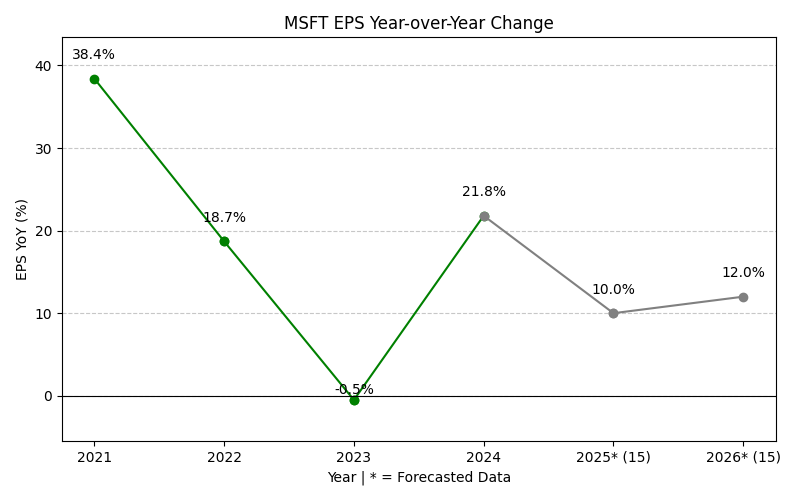
EPS
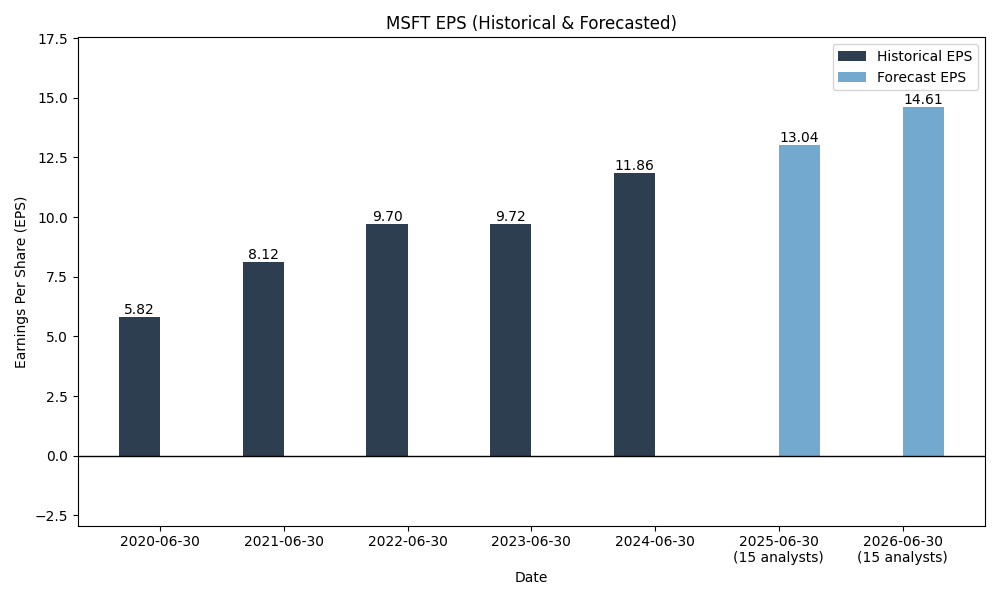
Forecasts
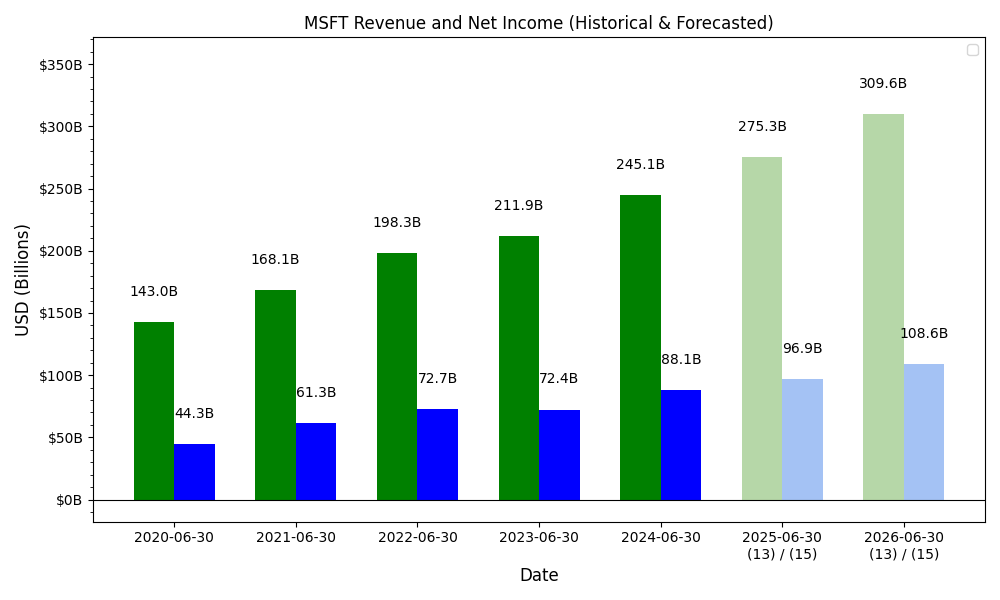
Y/Y % Change
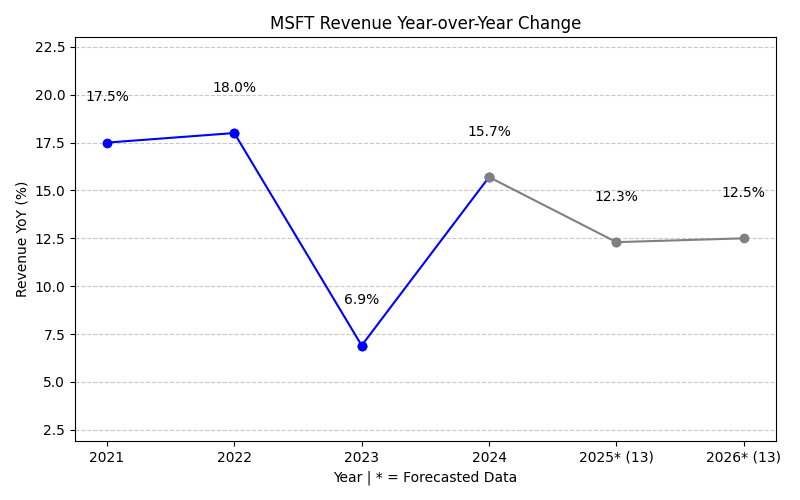
MSFT Year-over-Year Growth
| 2020 | 2021 | 2022 | 2023 | 2024 | 2025 | 2026 | 2027 | Average | |
|---|---|---|---|---|---|---|---|---|---|
| Revenue Growth (%) | 17.5% | 18.0% | 6.9% | 15.7% | 14.9% | 17.0% | 16.5% | 15.2% | |
| Revenue Analysts (#) | 0 | 0 | 0 | 0 | 0 | 0 | 48 | 53 | |
| EPS Growth (%) | 38.4% | 18.7% | -0.5% | 21.8% | 15.5% | 22.6% | 15.0% | 18.8% | |
| EPS Analysts (#) | 0 | 0 | 0 | 0 | 0 | 0 | 24 | 36 |
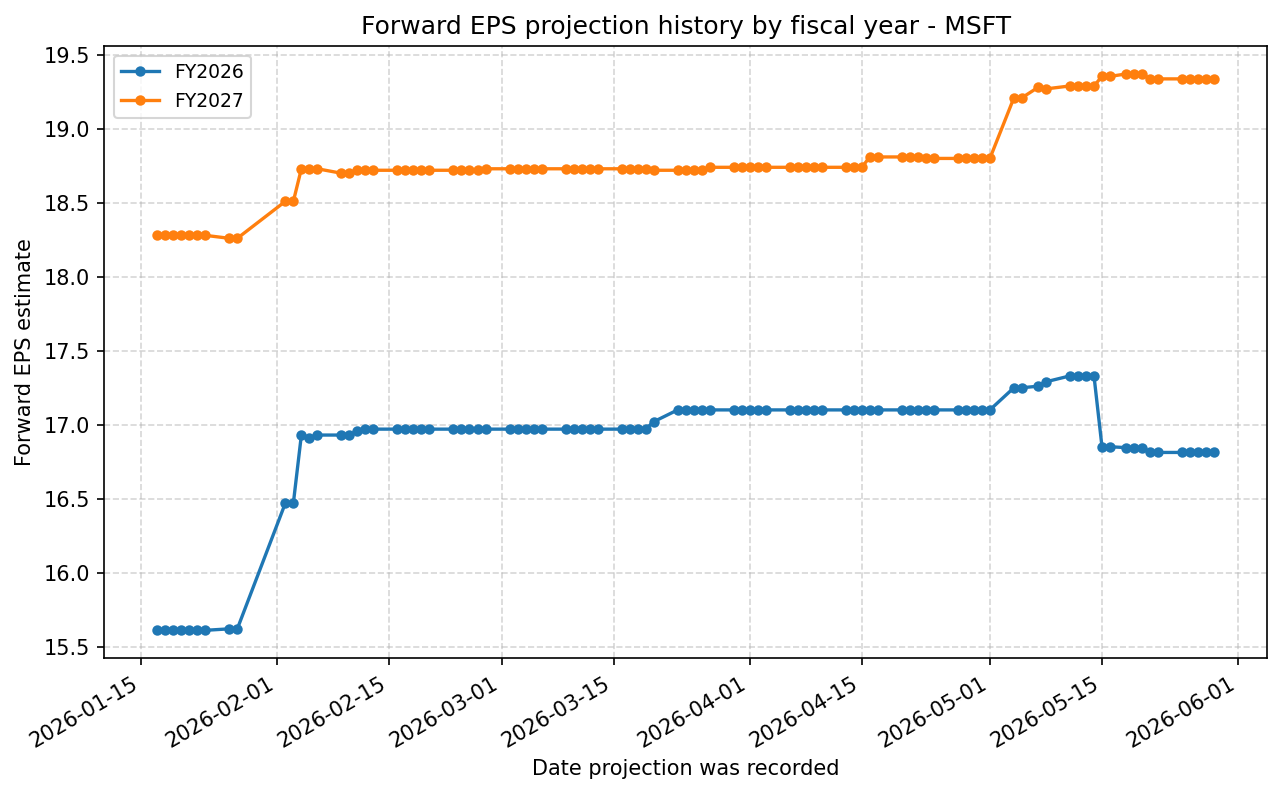
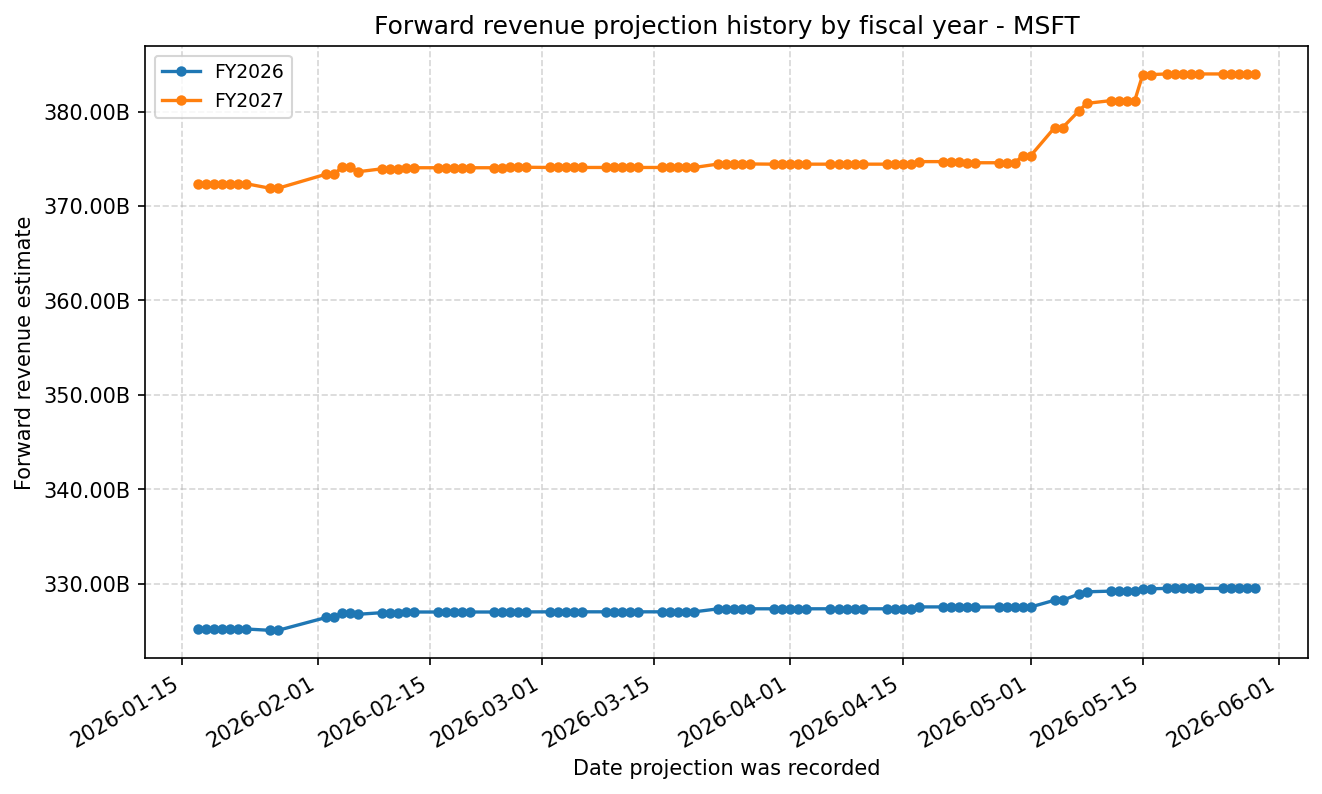
Forward Estimate History
How the next-FY EPS and revenue estimates have drifted over time. One line per fiscal year – past lines end when that FY became current.
Expenses
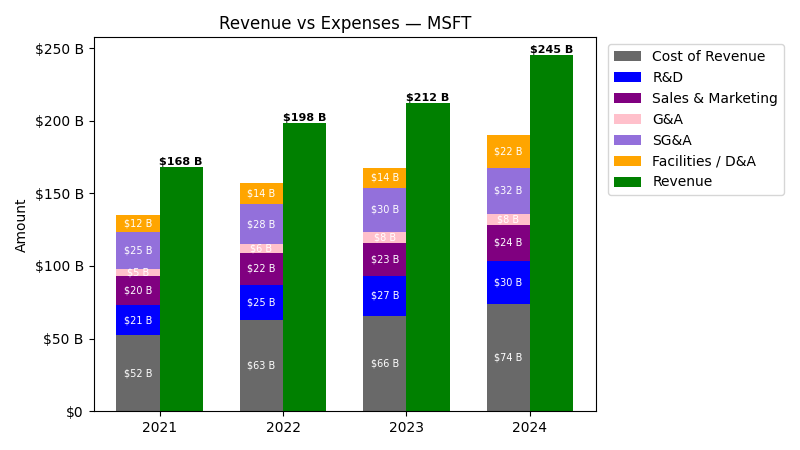
| Year | Revenue ($) | Cost of Revenue ($) | R&D ($) | Sales & Marketing ($) | G&A ($) | SG&A ($) | Facilities / D&A ($) |
|---|---|---|---|---|---|---|---|
| 2021 | $168.1B | $40.5B | $20.7B | $20.1B | $5.1B | $25.2B | $11.7B |
| 2022 | $198.3B | $48.2B | $24.5B | $21.8B | $5.9B | $27.7B | $14.5B |
| 2023 | $211.9B | $52.0B | $27.2B | $22.8B | $7.6B | $30.3B | $13.9B |
| 2024 | $245.1B | $51.8B | $29.5B | $24.5B | $7.6B | $32.1B | $22.3B |
| 2025 | $281.7B | $53.7B | $32.5B | $25.7B | $7.2B | $32.9B | $34.2B |
| TTM | $318.3B | $57.2B | $34.4B | $26.4B | $7.7B | $34.1B | $43.6B |
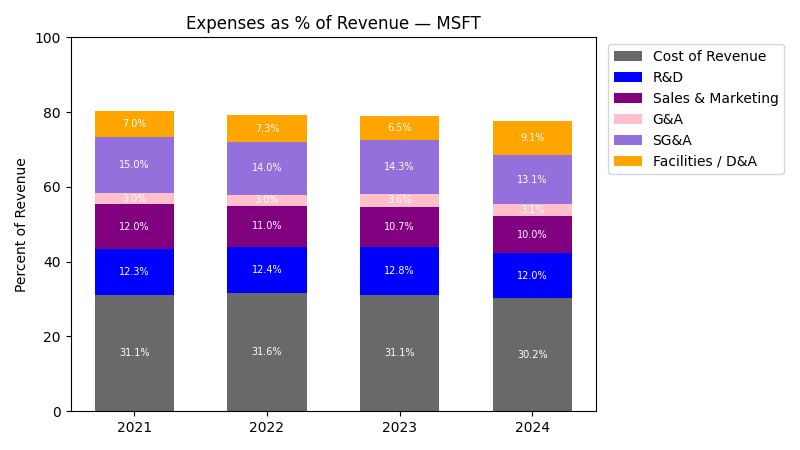
| Year | Revenue Change (%) | Cost of Revenue Change (%) | R&D Change (%) | Sales & Marketing Change (%) | G&A Change (%) | SG&A Change (%) | Facilities / D&A Change (%) |
|---|---|---|---|---|---|---|---|
| 2022 | 17.96 | 18.85 | 18.32 | 8.49 | 15.53 | 9.92 | 23.74 |
| 2023 | 6.88 | 7.91 | 10.95 | 4.28 | 28.39 | 9.41 | -4.14 |
| 2024 | 15.67 | -0.34 | 8.51 | 7.46 | 0.45 | 5.71 | 60.79 |
| 2025 | 14.93 | 3.57 | 10.09 | 4.90 | -5.07 | 2.53 | 53.24 |
| TTM | 12.97 | 6.62 | 5.87 | 2.91 | 6.04 | 3.60 | 27.75 |
No unmapped expenses.
Segment Performance
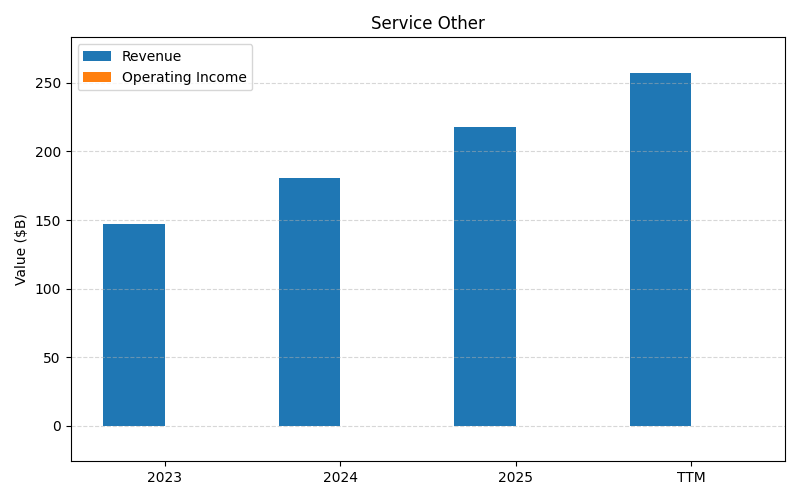
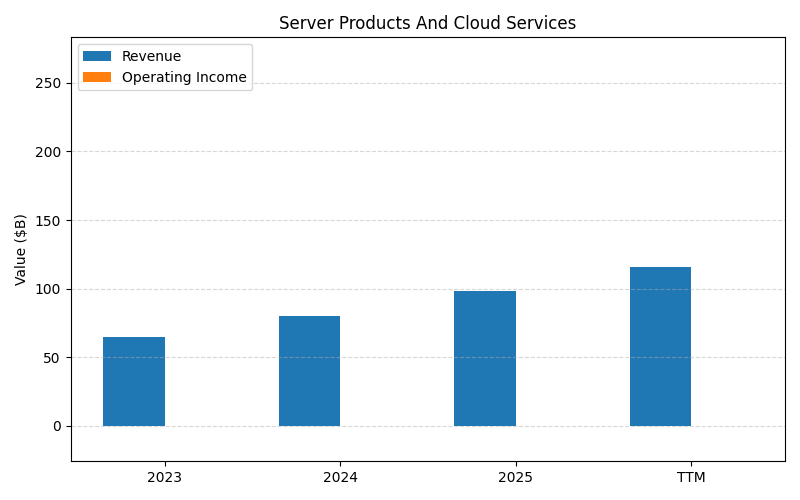
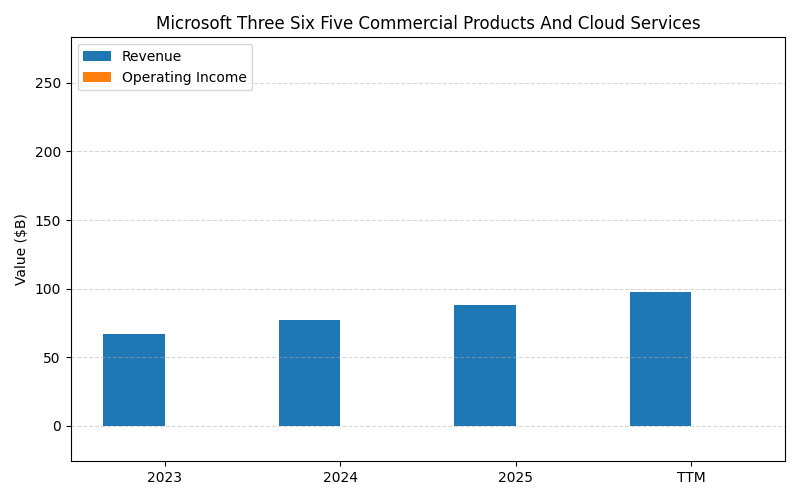
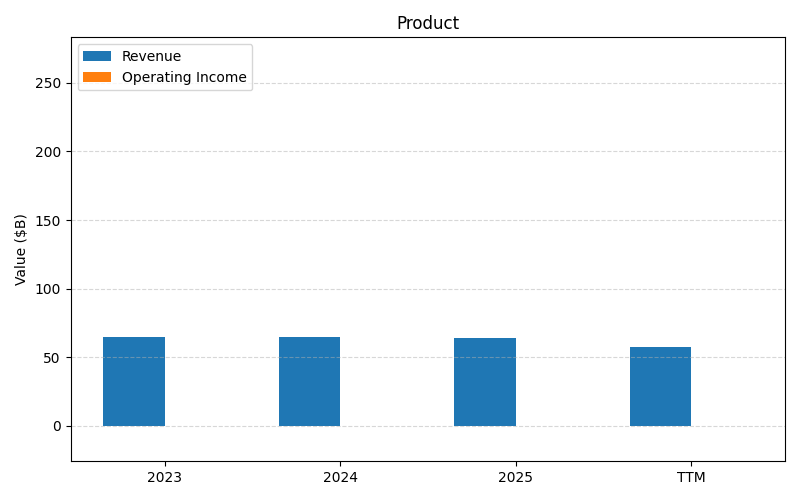
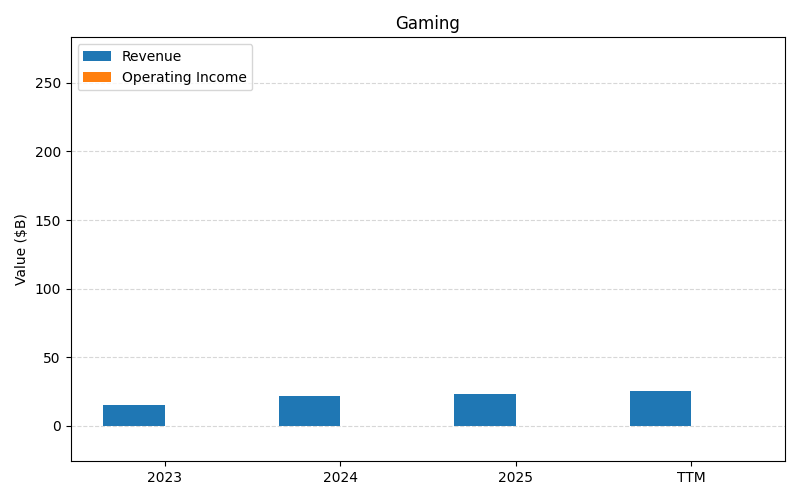
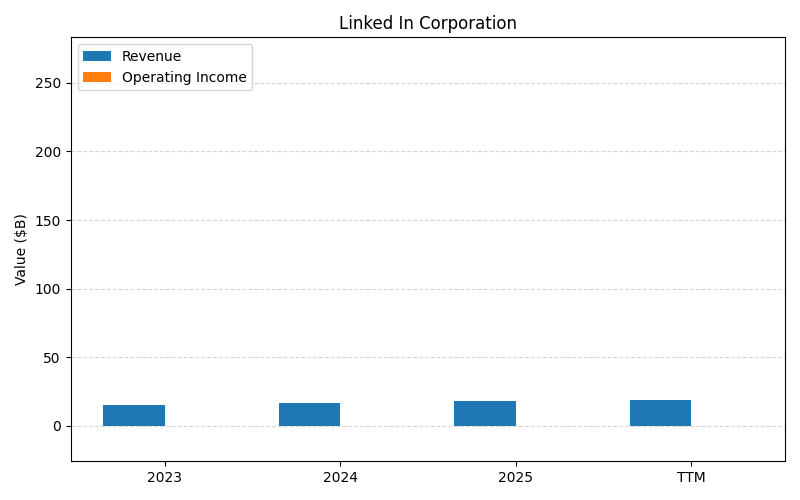
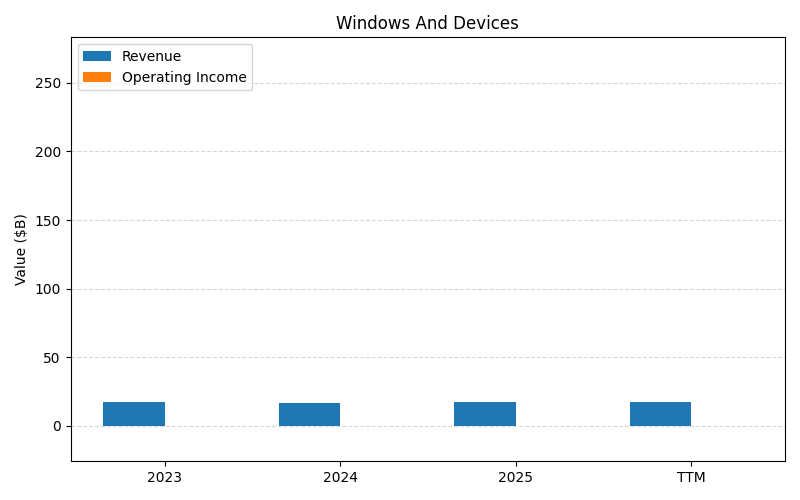
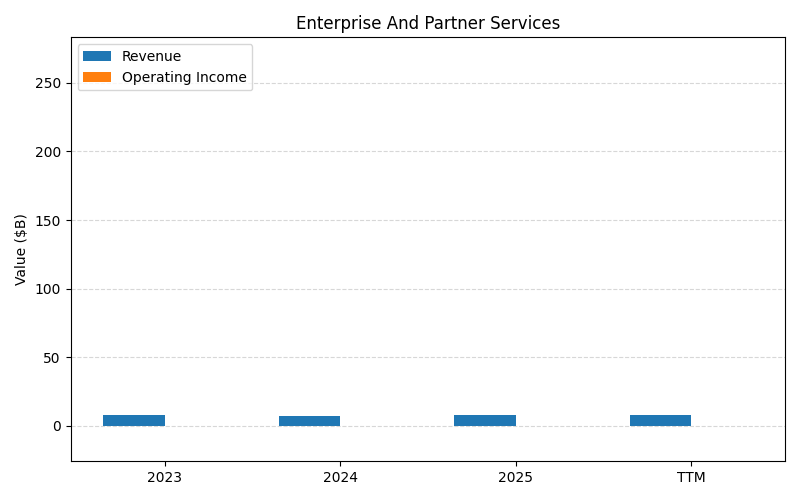
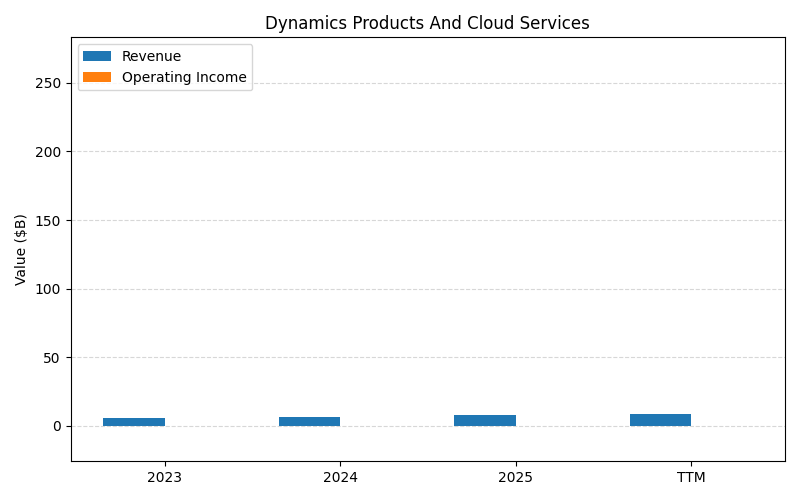
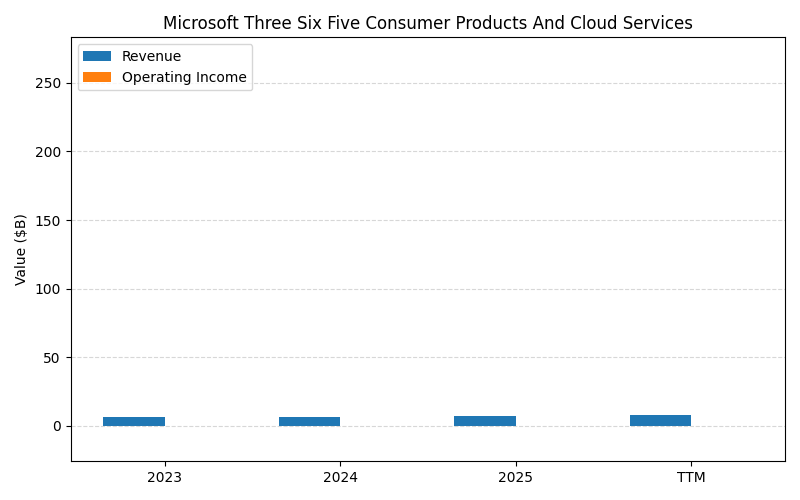
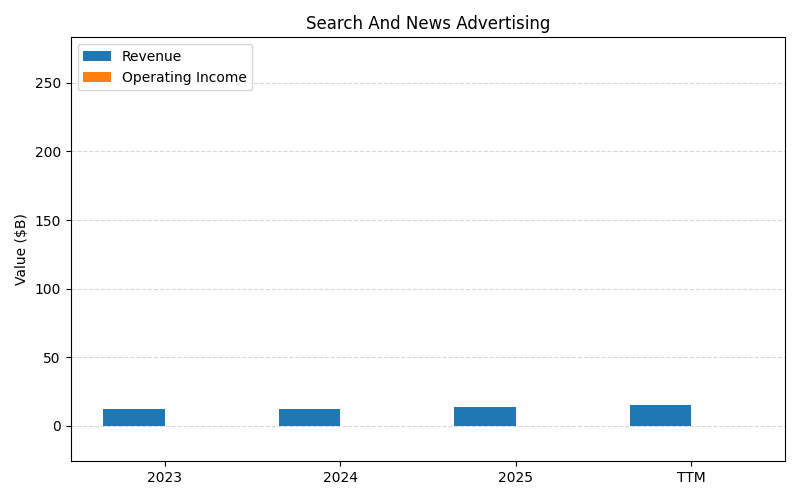
SEGMENTS v2025-09-09 · 2026-05-29 09:12 UTC — Units: $B. Rows list fiscal years (last 3 + TTM) with revenue for each segment; the final row shows the TTM revenue mix (operating income columns display “—” where mix is not applicable).
| Year | Service Other Rev | Server Products And Cloud Services Rev | Microsoft Three Six Five Commercial Products And Cloud Services Rev | Prod Rev | Gaming Rev | Linked In Corporation Rev | Windows And Devices Rev | Enterprise And Partner Services Rev | Dynamics Products And Cloud Services Rev | Microsoft Three Six Five Consumer Products And Cloud Services Rev | Other Products And Services Rev | Search And News Advertising Rev | Total Rev |
|---|---|---|---|---|---|---|---|---|---|---|---|---|---|
| 2023 | 147.2B | 65B | 66.9B | 64.7B | 15.5B | 15B | 17.1B | 7.90B | 5.80B | 6.42B | 0.12B | 12.1B | 423.8B |
| 2024 | 180.3B | 79.8B | 77B | 64.8B | 21.5B | 16.4B | 17B | 7.59B | 6.83B | 6.65B | 0.04B | 12.3B | 490.2B |
| 2025 | 217.8B | 98.4B | 87.8B | 63.9B | 23.5B | 17.8B | 17.3B | 7.76B | 7.83B | 7.40B | 0.07B | 13.9B | 563.4B |
| TTM | 873.5B | 398.5B | 349.7B | 253.4B | 90.8B | 71.1B | 68.6B | 31.3B | 31.2B | 30.3B | 0.24B | – | 2198.7B |
| % of Total (TTM) | 39.7% | 18.1% | 15.9% | 11.5% | 4.1% | 3.2% | 3.1% | 1.4% | 1.4% | 1.4% | 0.0% | – | 100% |
Segment Performance (Axis 2)
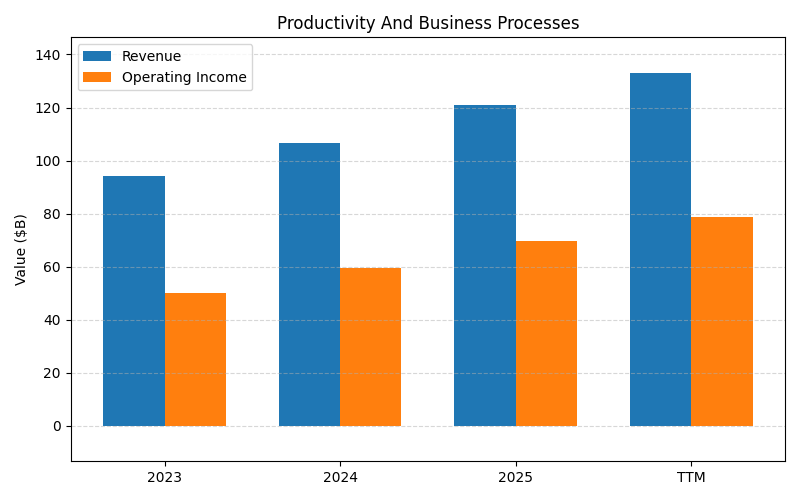
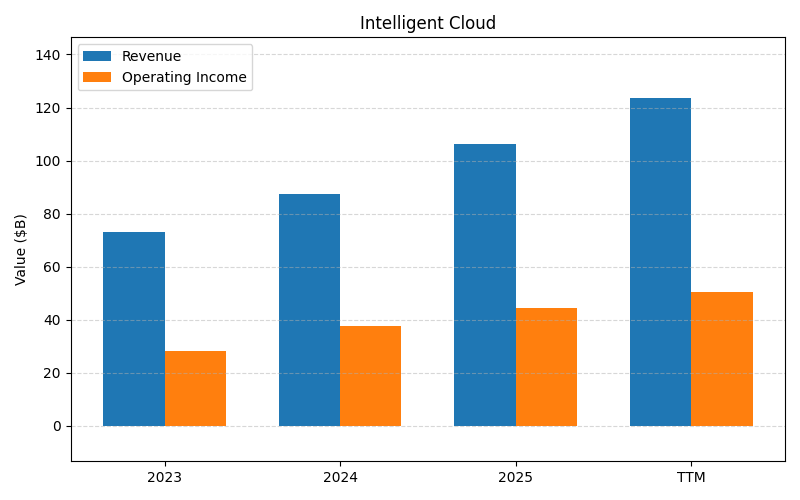
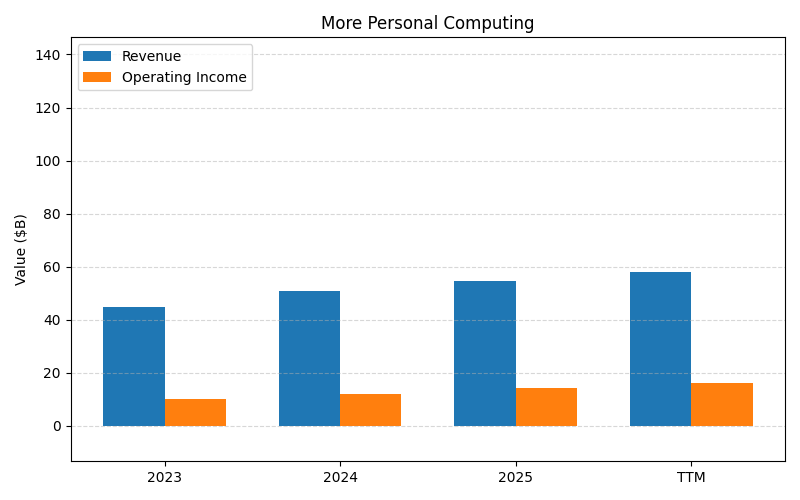
SEGMENTS v2025-09-09 · 2026-05-29 09:12 UTC — Units: $B. Rows list fiscal years (last 3 + TTM) with revenue and operating income for each segment; the final row shows the TTM revenue mix (operating income columns display “—” where mix is not applicable).
| Year | Productivity And Business Processes Rev | Productivity And Business Processes OI | Intelligent Cloud Rev | Intelligent Cloud OI | More Personal Computing Rev | More Personal Computing OI | Total Rev | Total OI |
|---|---|---|---|---|---|---|---|---|
| 2023 | 94.2B | 50.1B | 72.9B | 28.4B | 44.8B | 10B | 211.9B | 88.5B |
| 2024 | 106.8B | 59.7B | 87.5B | 37.8B | 50.8B | 12B | 245.1B | 109.4B |
| 2025 | 120.8B | 69.8B | 106.3B | 44.6B | 54.6B | 14.2B | 281.7B | 128.5B |
| TTM | 482.4B | 280.5B | 430B | 180.7B | 214.4B | 55.9B | 1126.9B | 517.2B |
| % of Total (TTM) | 42.8% | — | 38.2% | — | 19.0% | — | 100% | — |
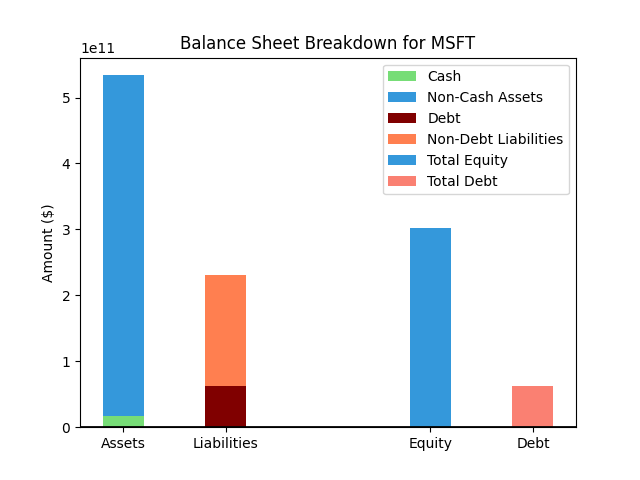
Balance Sheet
| Metric | Value | |
|---|---|---|
| 0 | Total Assets | $694,228M |
| 1 | Cash | $32,105M |
| 2 | Total Liabilities | $279,861M |
| 3 | Total Debt | $56,965M |
| 4 | Total Equity | $414,367M |
| 5 | Debt to Equity Ratio | 0.14 |
EPS & Dividend
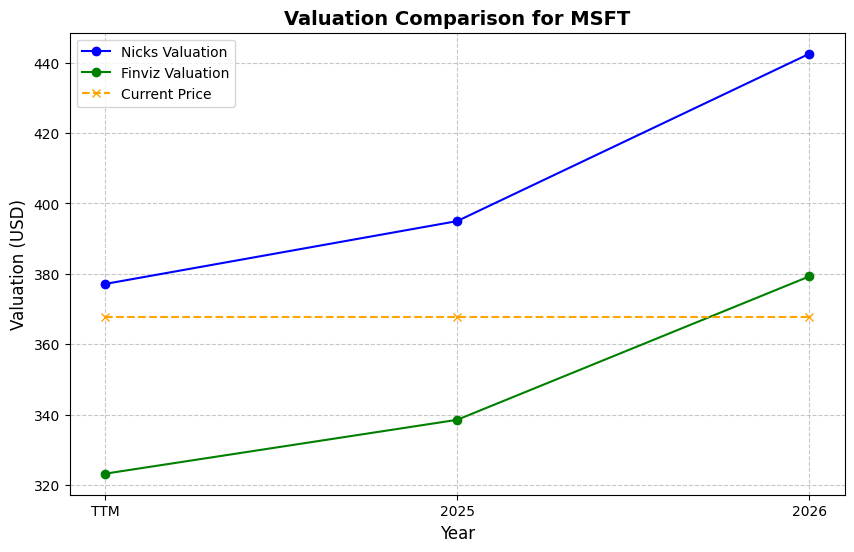
Valuation
| Share Price | Treasury Yield | Estimates | Fair Value (P/E) | Fair Value (P/S) | Current P/S | Current P/E |
|---|---|---|---|---|---|---|
| $450.24 | 4.5% | Nicks Growth: 16% Nick's Expected Margin: 35% FINVIZ Growth: 19% |
Nicks: 30 Finviz: 38 |
Nick's: 10.439 | 10.5 | 26.8 |
| Basis | Year | Nicks Valuation | Nicks vs Share Price | Finviz Valuation | Finviz vs Share Price |
|---|---|---|---|---|---|
| $16.78 EPS | TTM | $500.46 | 11.2% | $637.91 | 41.7% |
| $16.81 EPS | 2026 | $501.43 | 11.4% | $639.14 | 42.0% |
| $19.34 EPS | 2027 | $576.75 | 28.1% | $735.15 | 63.3% |
Implied Growth
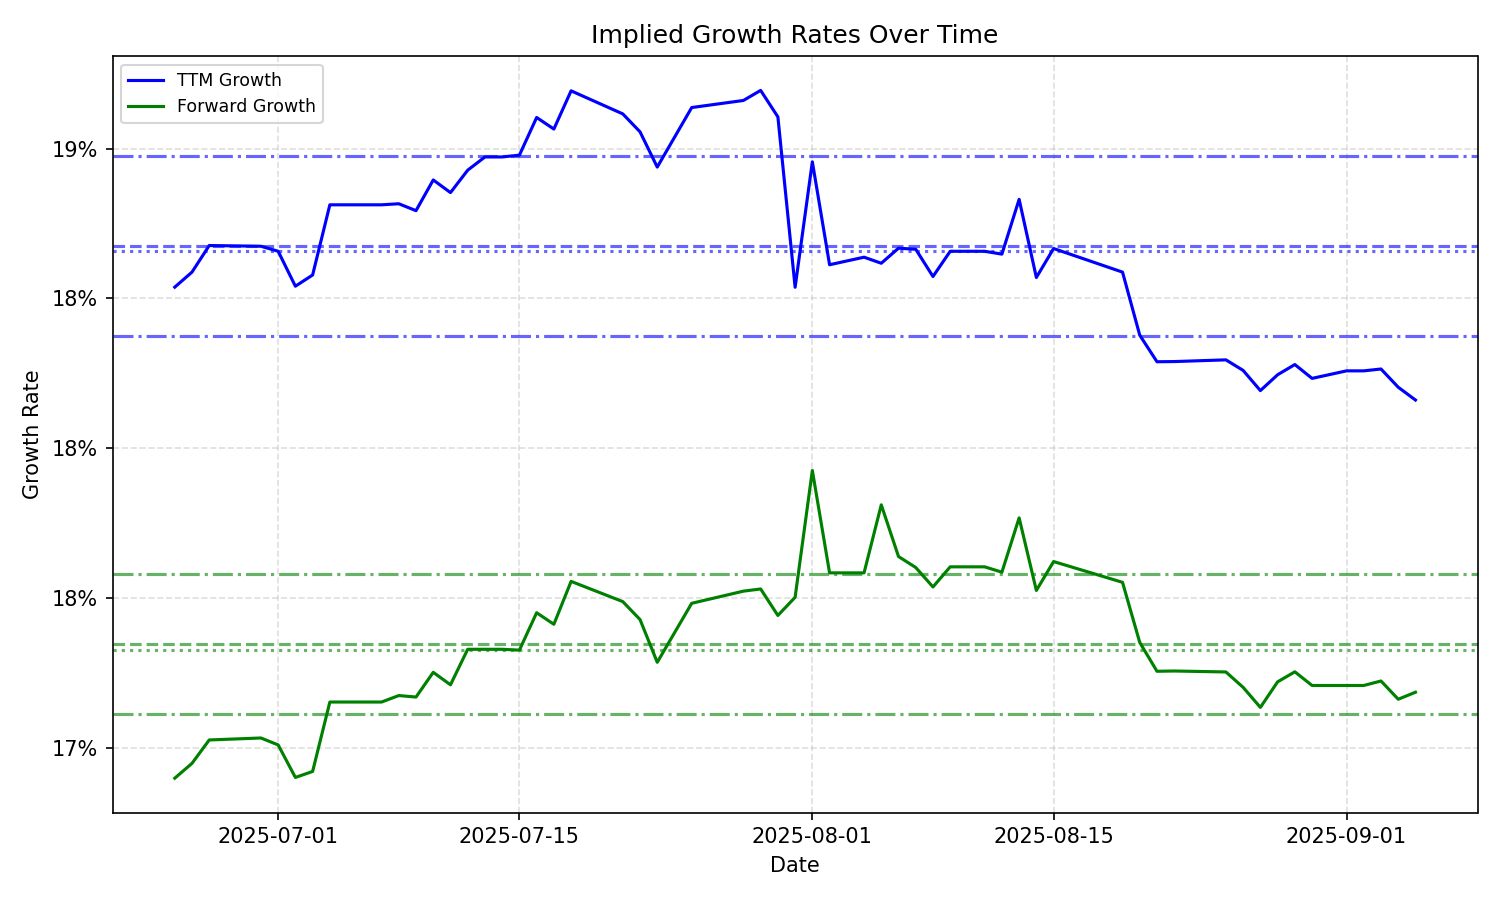
| Average | Median | Std Dev | Current | Percentile | ||||||
|---|---|---|---|---|---|---|---|---|---|---|
| TTM | Forward | TTM | Forward | TTM | Forward | TTM | Forward | TTM | Forward | |
| Timeframe | ||||||||||
| 1 Year | 16.62% | 15.06% | 17.35% | 16.63% | 2.11% | 2.41% | 14.24% | 12.70% | 28.2% | 30.3% |
| 3 Years | 16.62% | 15.06% | 17.35% | 16.63% | 2.11% | 2.41% | 14.24% | 12.70% | 28.2% | 30.3% |
| 5 Years | 16.62% | 15.06% | 17.35% | 16.63% | 2.11% | 2.41% | 14.24% | 12.70% | 28.2% | 30.3% |
| 10 Years | 16.62% | 15.06% | 17.35% | 16.63% | 2.11% | 2.41% | 14.24% | 12.70% | 28.2% | 30.3% |