Moderna, Inc. — MRNA
| Close Price | Market Cap | P/E Ratio | Forward P/E Ratio | Implied Growth* | Implied Forward Growth* | Dividend | P/B Ratio |
|---|---|---|---|---|---|---|---|
| $47.19 | $18.72B | - | -11.2 | N/A | - | - | 2.1 |
Latest Headlines
- · JPMorgan says large-cap biotech is back as profits and pipelines fuel upside
- · This Biotech Stock Is Stuck in the Red. Its Cancer Portfolio Is About to Change the Narrative.
- · Astellas eyes more cost cuts; FDA panel to debate Moderna vaccine
- · Litigation Windfall Driving Roivant Sciences’ Profit Swing Might Change The Case For Investing In Roivant Sciences (ROIV)
- · 3 Cash-Burning Stocks with Open Questions
- · Moderna (MRNA) Is Down 5.5% After FDA Sets Flu Vaccine Review, Tightens Lawsuit Venue Rules - What's Changed
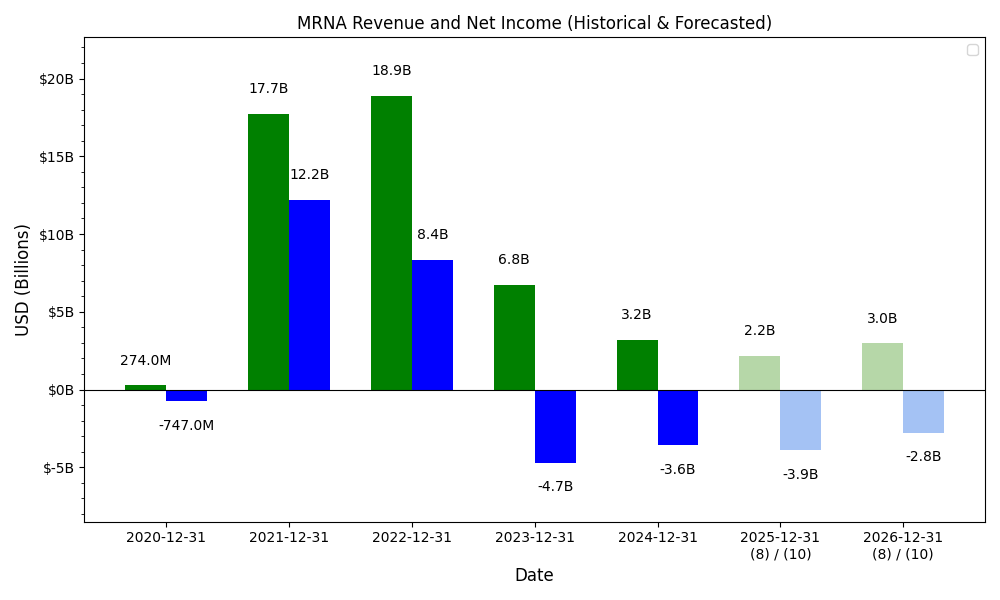
Revenue & Net Income
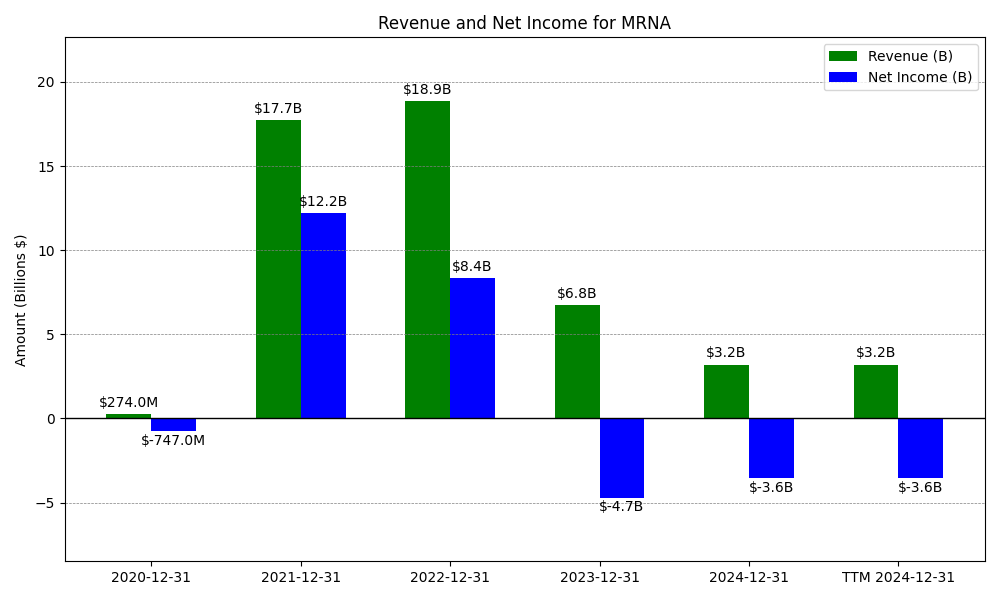
| Date | Revenue | Net_Income | EPS | Last_Updated | Revenue_Change | Net_Income_Change | EPS_Change | |
|---|---|---|---|---|---|---|---|---|
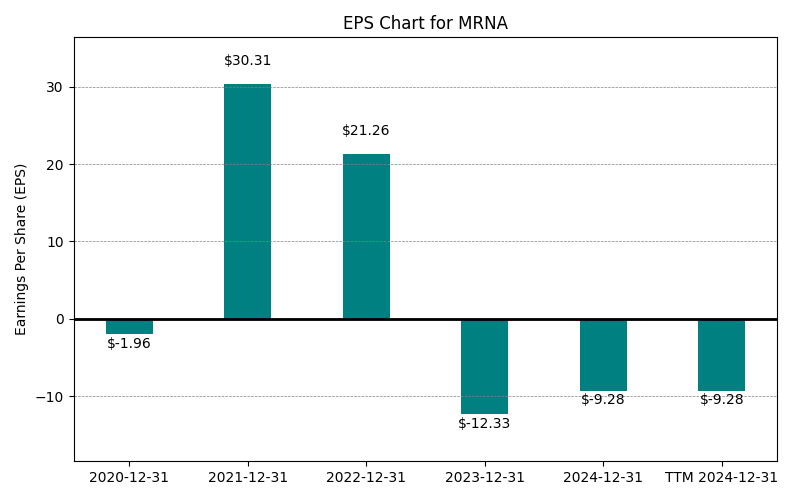
| 0 | 2020-12-31 | $274M | $-747M | $-1.96 | 2024-02-03 03:17:10 | N/A | N/A | N/A |
| 1 | 2021-12-31 | $18,875M | $8,362M | $30.31 | 2026-05-29 09:11:54 | 6788.7% | -1219.4% | -1646.4% |
| 2 | 2022-12-31 | $18,875M | $8,362M | $21.26 | 2026-05-29 09:11:54 | 0.0% | 0.0% | -29.9% |
| 3 | 2023-12-31 | $6,754M | $-4,714M | $-12.33 | 2026-05-29 09:11:54 | -64.2% | -156.4% | -158.0% |
| 4 | 2024-12-31 | $3,199M | $-3,561M | $-9.28 | 2026-05-29 09:11:54 | -52.6% | -24.5% | -24.7% |
| 5 | 2025-12-31 | $1,922M | $-2,822M | $-9.28 | 2026-05-29 09:11:54 | -39.9% | -20.8% | 0.0% |
| 6 | TTM 2026-03-31 | $2,204M | $-3,194M | $-8.14 | 2026-05-05 08:51:33 | 14.7% | 13.2% | -12.3% |
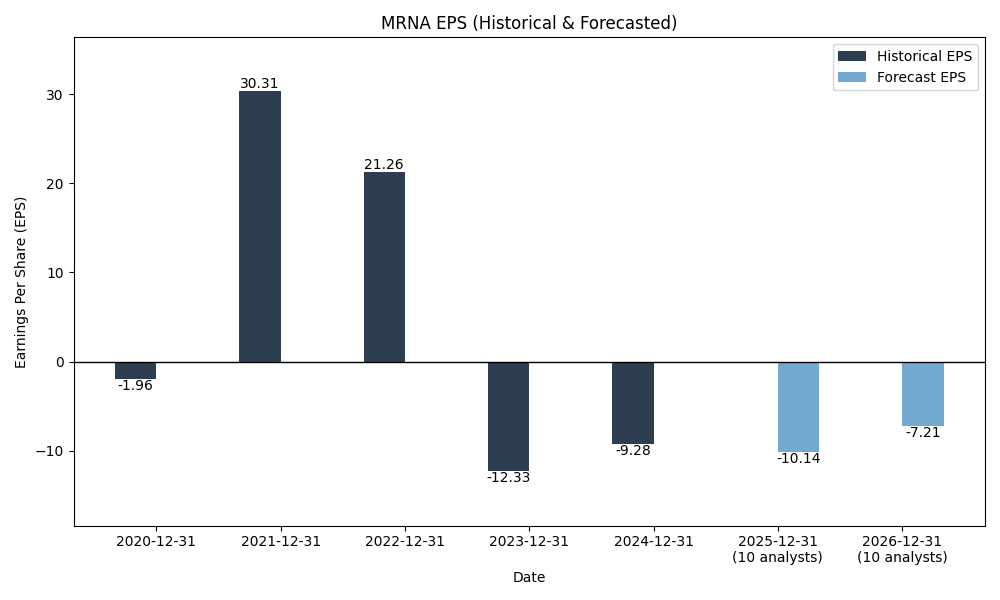
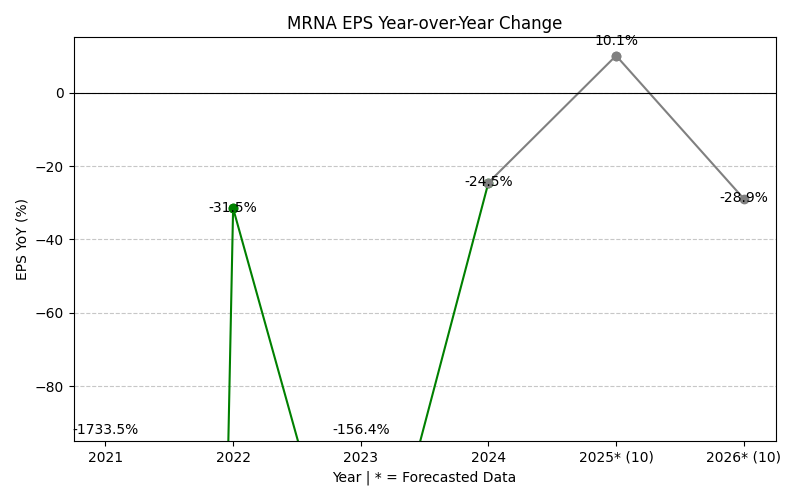
EPS
Forecasts
Y/Y % Change
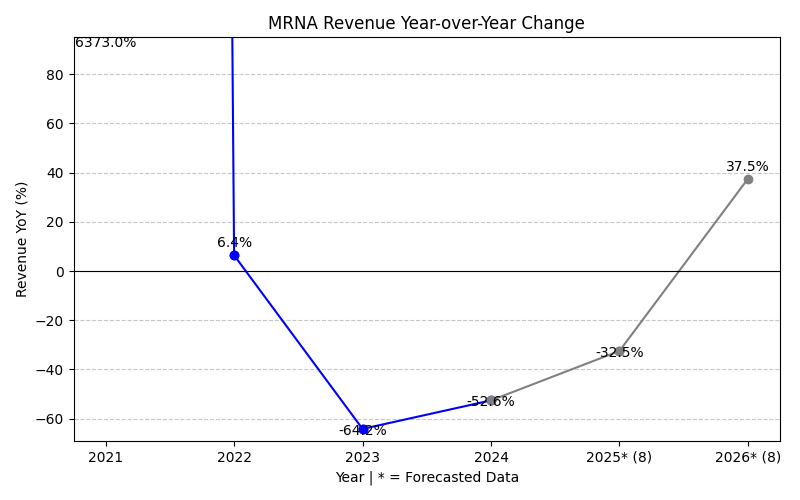
MRNA Year-over-Year Growth
| 2020 | 2021 | 2022 | 2023 | 2024 | 2025 | 2026 | 2027 | Average | |
|---|---|---|---|---|---|---|---|---|---|
| Revenue Growth (%) | 6788.7% | 0.0% | -64.2% | -52.6% | -39.9% | 8.6% | 20.4% | 951.6% | |
| Revenue Analysts (#) | 0 | 0 | 0 | 0 | 0 | 0 | 22 | 21 | |
| EPS Growth (%) | -1219.4% | 0.0% | -156.4% | -24.5% | -20.8% | 21.6% | -45.4% | -206.4% | |
| EPS Analysts (#) | 0 | 0 | 0 | 0 | 0 | 0 | 21 | 20 |
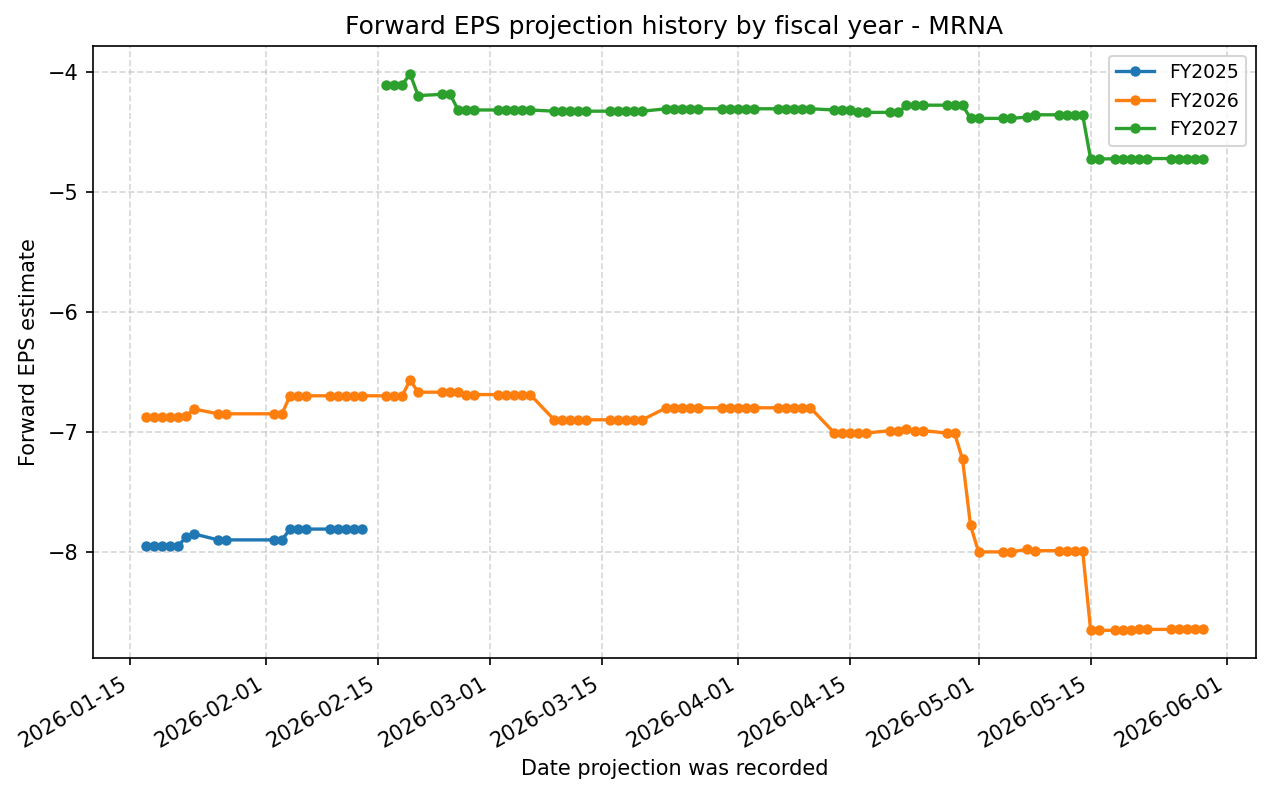
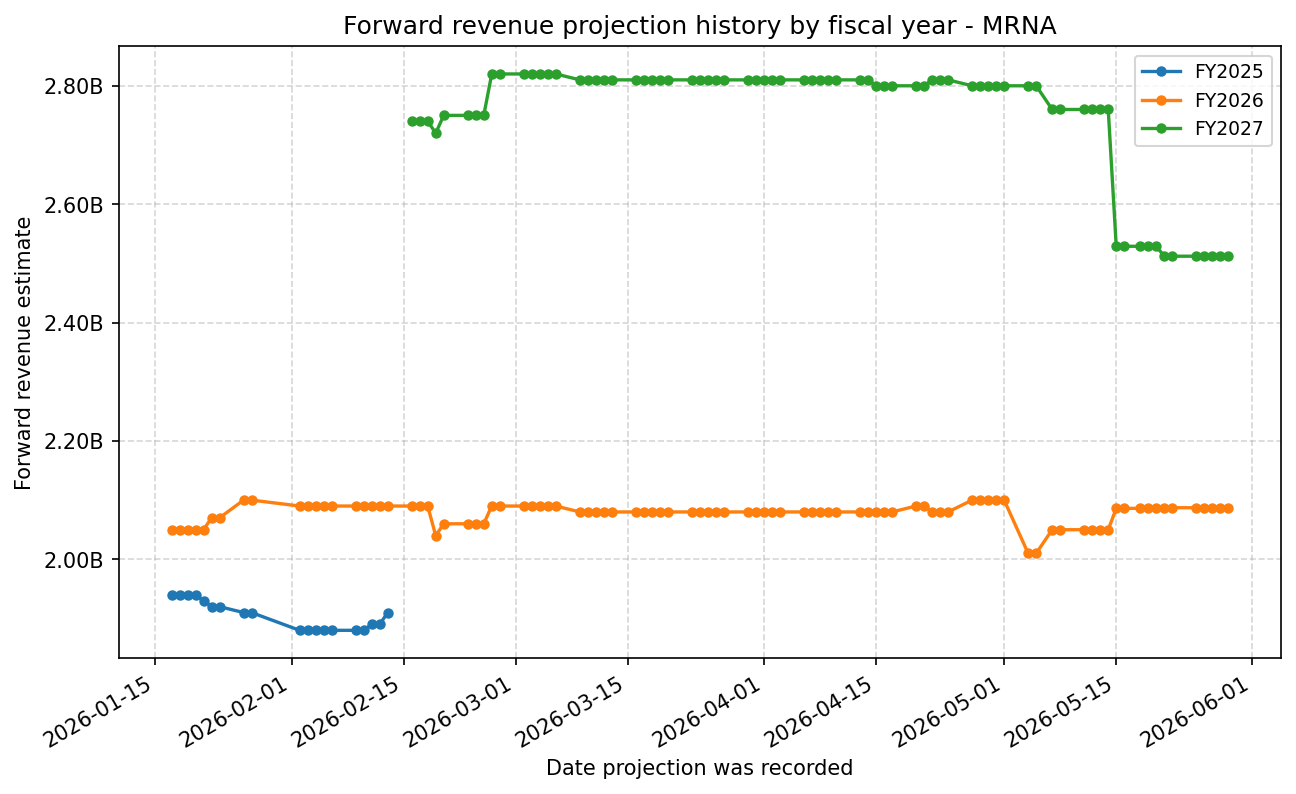
Forward Estimate History
How the next-FY EPS and revenue estimates have drifted over time. One line per fiscal year – past lines end when that FY became current.
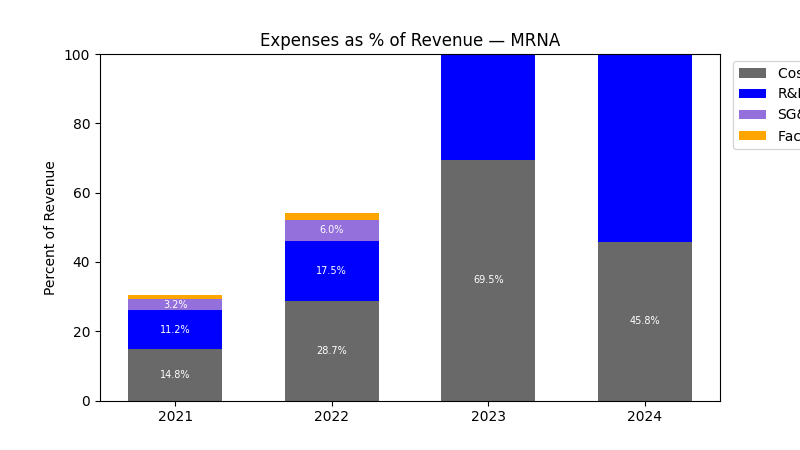
Expenses
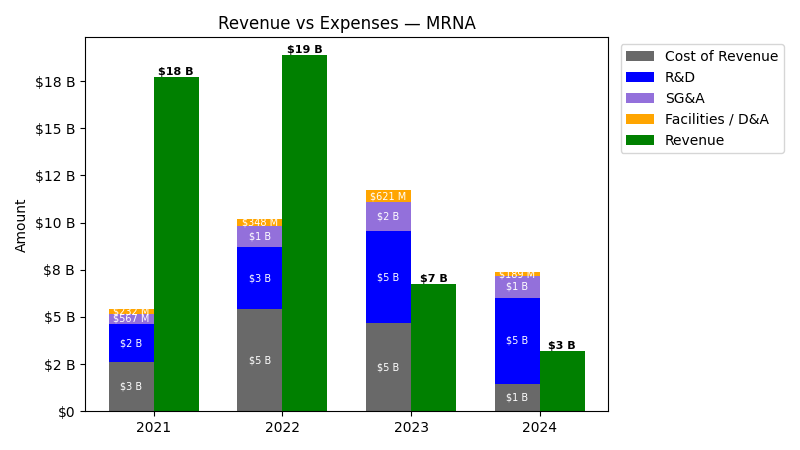
| Year | Revenue ($) | Cost of Revenue ($) | R&D ($) | SG&A ($) | Facilities / D&A ($) |
|---|---|---|---|---|---|
| 2022 | $18.9B | $5.1B | $3.3B | $1.1B | $348.0M |
| 2023 | $6.8B | $4.1B | $4.8B | $1.5B | $621.0M |
| 2024 | $3.2B | $1.3B | $4.5B | $1.2B | $189.0M |
| 2025 | $1.9B | $653.0M | $3.1B | $1.0B | $215.0M |
| TTM | $2.2B | $1.5B | $2.9B | $979.0M | $235.0M |
| Year | Revenue Change (%) | Cost of Revenue Change (%) | R&D Change (%) | SG&A Change (%) | Facilities / D&A Change (%) |
|---|---|---|---|---|---|
| 2023 | -64.22 | -19.65 | 47.04 | 36.84 | 78.45 |
| 2024 | -52.64 | -68.69 | -6.23 | -24.21 | -69.57 |
| 2025 | -39.92 | -48.78 | -31.06 | -13.29 | 13.76 |
| TTM | 14.67 | 129.40 | -6.61 | -3.83 | 9.30 |
No unmapped expenses.
Segment Performance
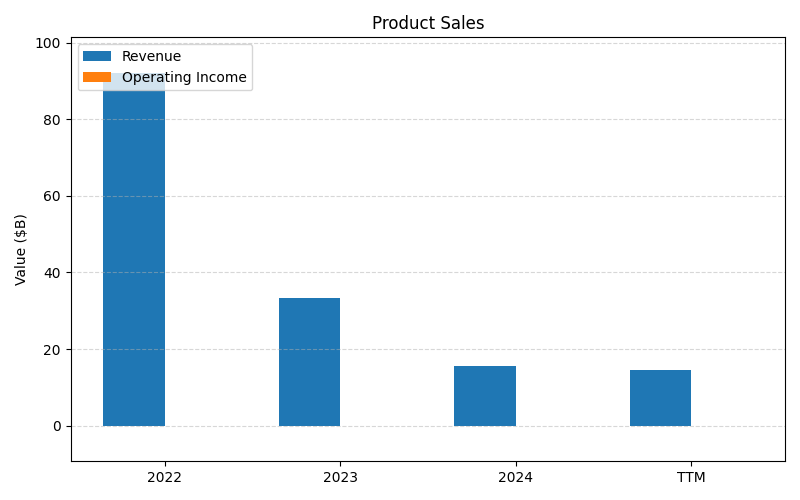
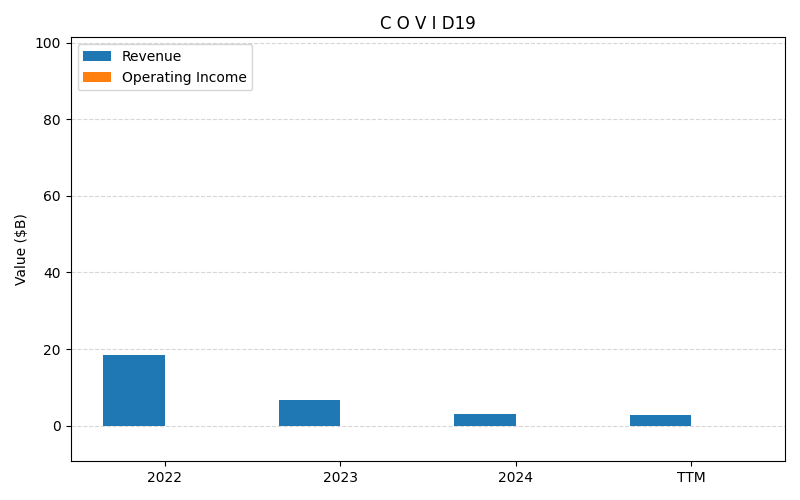
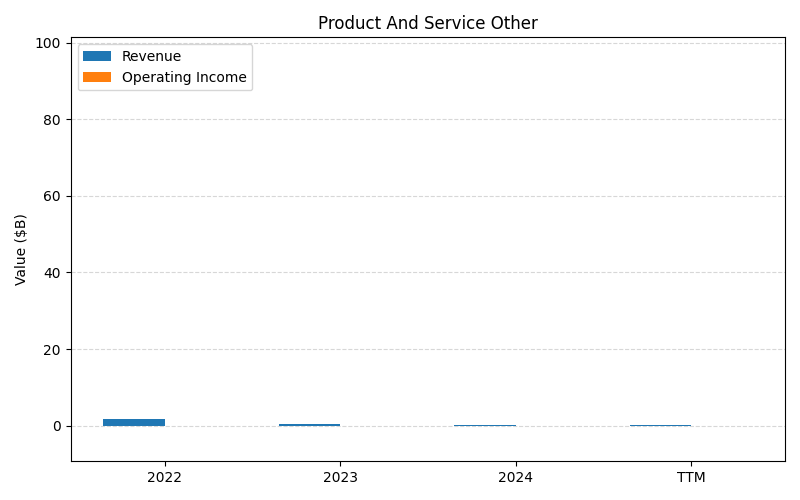
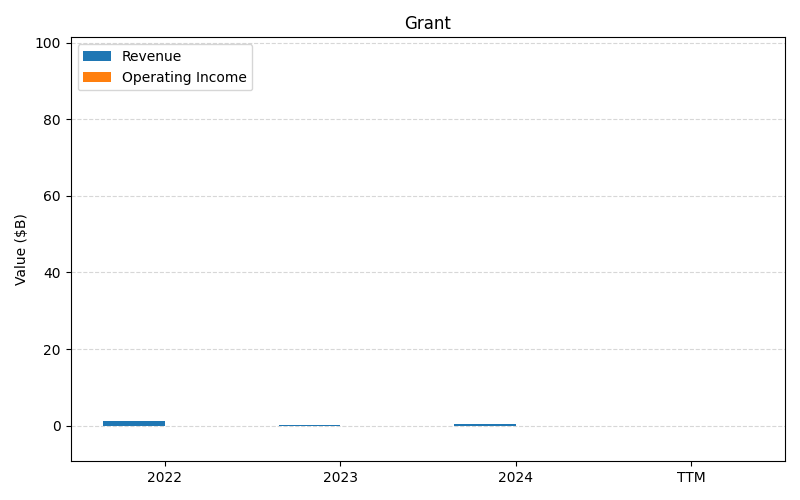
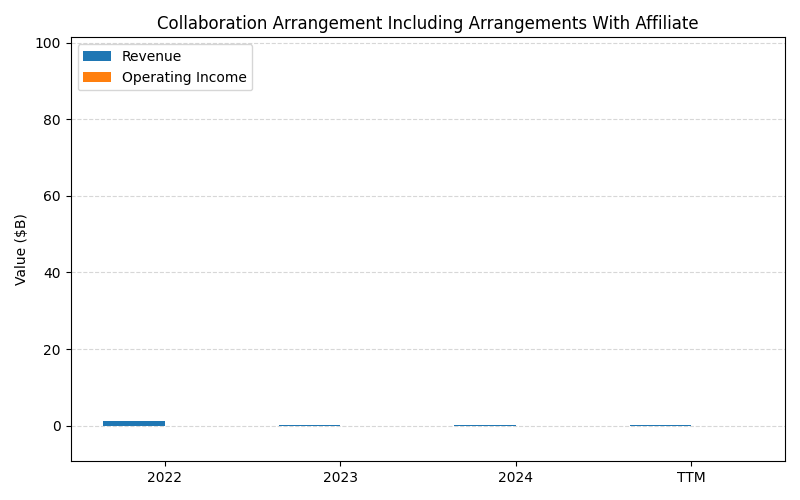
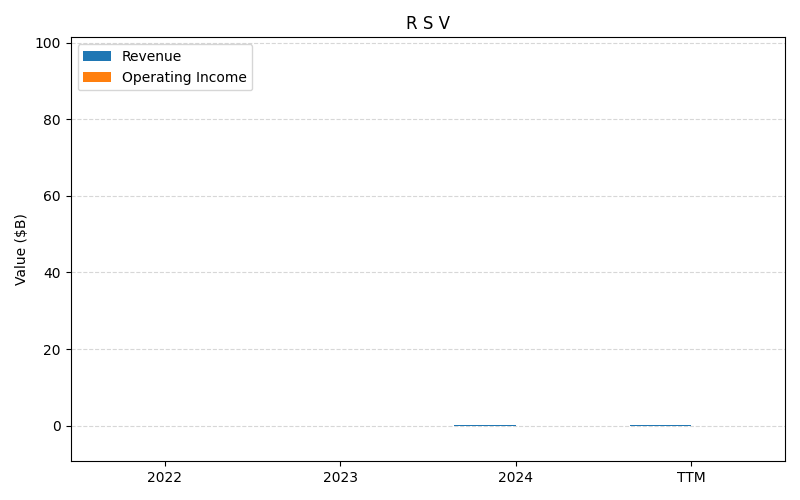
SEGMENTS v2025-09-09 · 2026-05-29 09:11 UTC — Units: $B. Rows list fiscal years (last 3 + TTM) with revenue for each segment; the final row shows the TTM revenue mix (operating income columns display “—” where mix is not applicable).
| Year | Product Sales Rev | C O V I D19 Rev | Product And Service Other Rev | Grant Rev | Collaboration Arrangement Including Arrangements With Affiliate Rev | R S V Rev | License And Royalty Rev | Stand Ready Manufacturing Revenue Rev | Total Rev |
|---|---|---|---|---|---|---|---|---|---|
| 2023 | 33.4B | 6.67B | 0.35B | 0.28B | 0.25B | – | – | – | 40.9B |
| 2024 | 15.5B | 3.08B | 0.28B | 0.11B | 0.14B | 0.03B | 0.04B | – | 19.2B |
| 2025 | 9.09B | 1.81B | 0.25B | 0.07B | 0.04B | 0.01B | 0.01B | 0.08B | 11.4B |
| TTM | 26.8B | 5.32B | 0.62B | 0.46B | 0.19B | 0.04B | – | – | 33.5B |
| % of Total (TTM) | 80.2% | 15.9% | 1.9% | 1.4% | 0.6% | 0.1% | – | – | 100% |
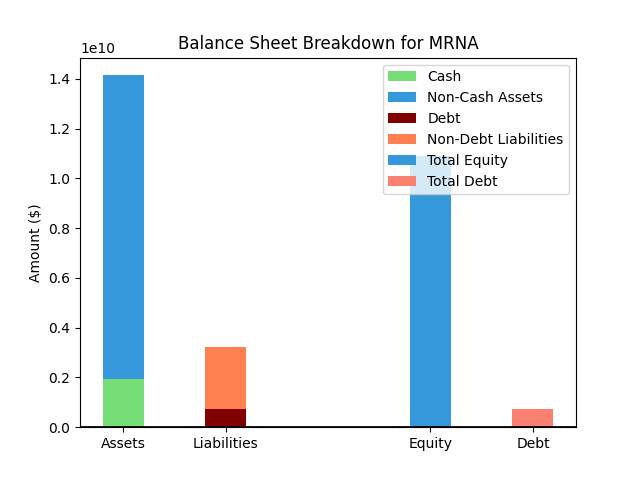
Balance Sheet
| Metric | Value | |
|---|---|---|
| 0 | Total Assets | $11,488M |
| 1 | Cash | $1,908M |
| 2 | Total Liabilities | $4,080M |
| 3 | Total Debt | $1,298M |
| 4 | Total Equity | $7,408M |
| 5 | Debt to Equity Ratio | 0.18 |
EPS & Dividend

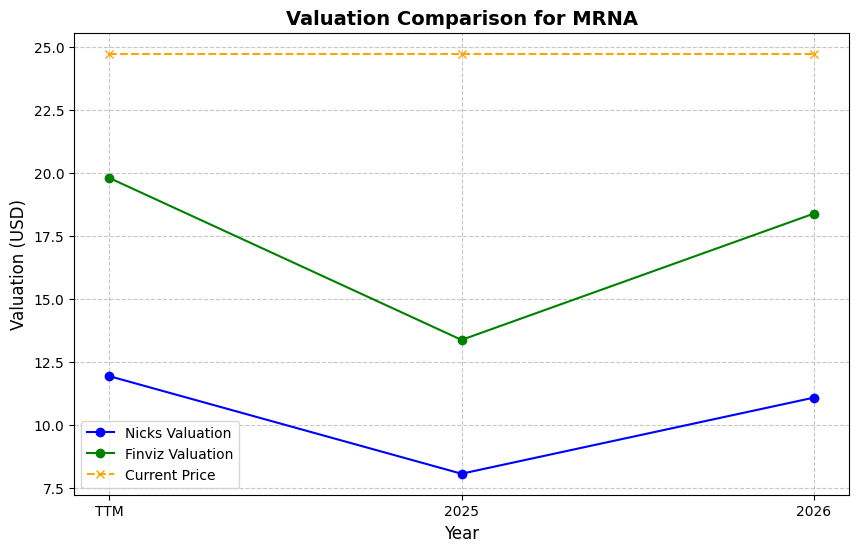
Valuation
| Share Price | Treasury Yield | Estimates | Fair Value (P/E) | Fair Value (P/S) | Current P/S | Current P/E |
|---|---|---|---|---|---|---|
| $47.19 | 4.5% | Nicks Growth: 8% Nick's Expected Margin: 10% FINVIZ Growth: 26% |
Nicks: 14 Finviz: 72 |
Nick's: 1.417 | 8.5 | - |
| Basis | Year | Nicks Valuation | Nicks vs Share Price | Finviz Valuation | Finviz vs Share Price |
|---|---|---|---|---|---|
| $5.55 Revenue | TTM | $7.87 | -83.3% | $39.90 | -15.4% |
| $5.26 Revenue | 2026 | $7.45 | -84.2% | $37.79 | -19.9% |
| $6.33 Revenue | 2027 | $8.97 | -81.0% | $45.48 | -3.6% |
Implied Growth

No implied growth data available.