Marathon Petroleum Corporation — MPC
| Close Price | Market Cap | P/E Ratio | Forward P/E Ratio | Implied Growth* | Implied Forward Growth* | Dividend | P/B Ratio |
|---|---|---|---|---|---|---|---|
| $248.77 | $72.63B | 16.4 | 10.6 | 9.5% | 5.0% | $3.91 1.6% | 4.4 |
Latest Headlines
- · Chevron Expands Mediterranean Push With 70% Greek Offshore Stake
- · 3 Energy Growth Stocks Riding Supply Risks and Strong Demand
- · What Makes Marathon Petroleum (MPC) a New Strong Buy Stock
- · Best Momentum Stock to Buy for May 28th
- · Best Growth Stocks to Buy for May 28th
- · Best Value Stock to Buy for May 28th
Revenue & Net Income
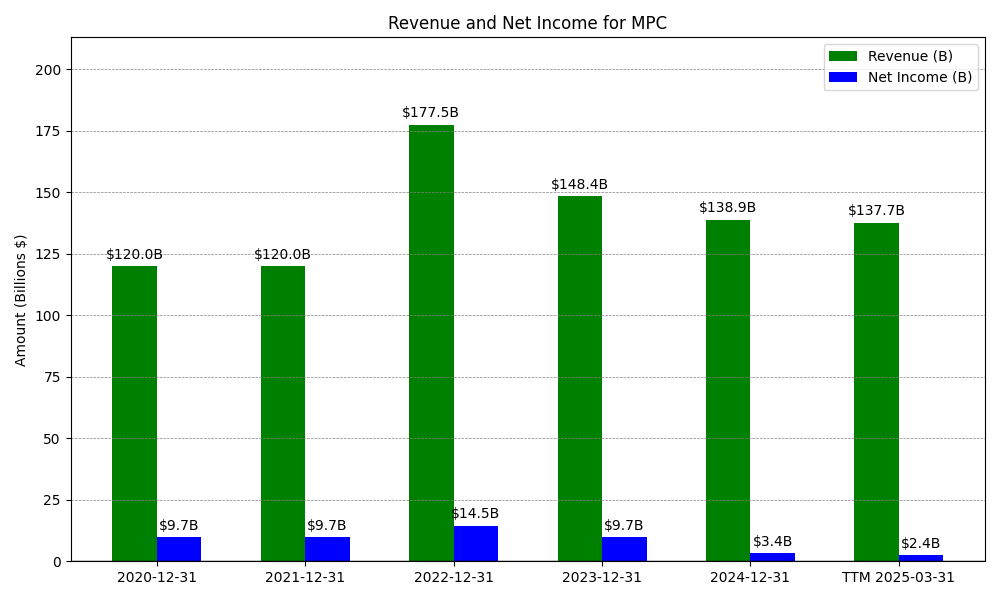
| Date | Revenue | Net_Income | EPS | Last_Updated | Revenue_Change | Net_Income_Change | EPS_Change | |
|---|---|---|---|---|---|---|---|---|
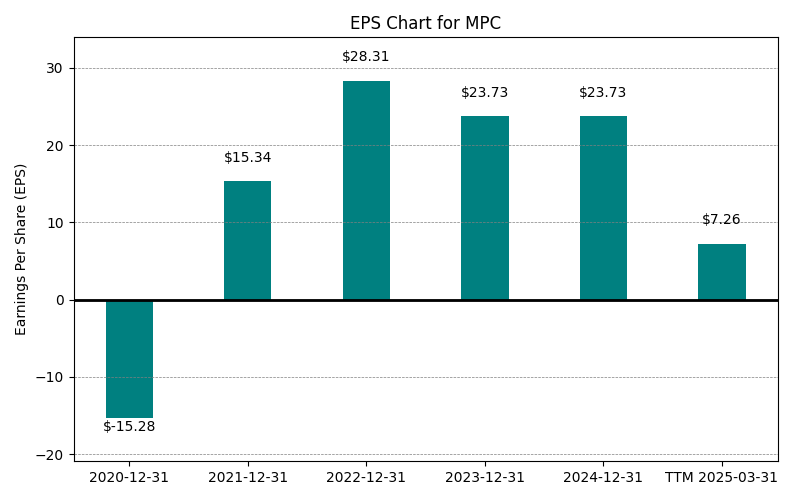
| 0 | 2020-12-31 | $119,983M | $9,738M | $-15.28 | 2025-05-22 10:33:00 | N/A | N/A | N/A |
| 1 | 2021-12-31 | $119,983M | $9,738M | $28.31 | 2026-03-06 08:34:32 | 0.0% | 0.0% | -285.3% |
| 2 | 2022-12-31 | $177,453M | $14,516M | $28.31 | 2026-05-29 09:11:47 | 47.9% | 49.1% | 0.0% |
| 3 | 2023-12-31 | $148,379M | $9,681M | $23.73 | 2026-05-29 09:11:47 | -16.4% | -33.3% | -16.2% |
| 4 | 2024-12-31 | $138,864M | $3,445M | $10.11 | 2026-05-29 09:11:47 | -6.4% | -64.4% | -57.4% |
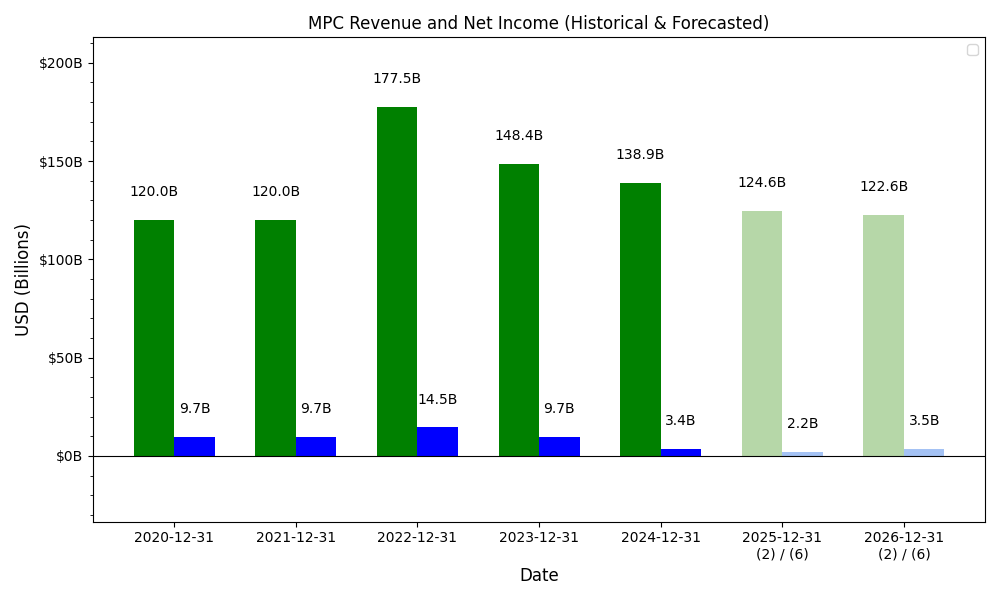
| 5 | 2025-12-31 | $132,699M | $4,047M | $13.24 | 2026-05-29 09:11:47 | -4.4% | 17.5% | 31.0% |
| 6 | TTM 2026-03-31 | $135,382M | $4,632M | $15.18 | 2026-05-11 09:12:05 | 2.0% | 14.5% | 14.7% |
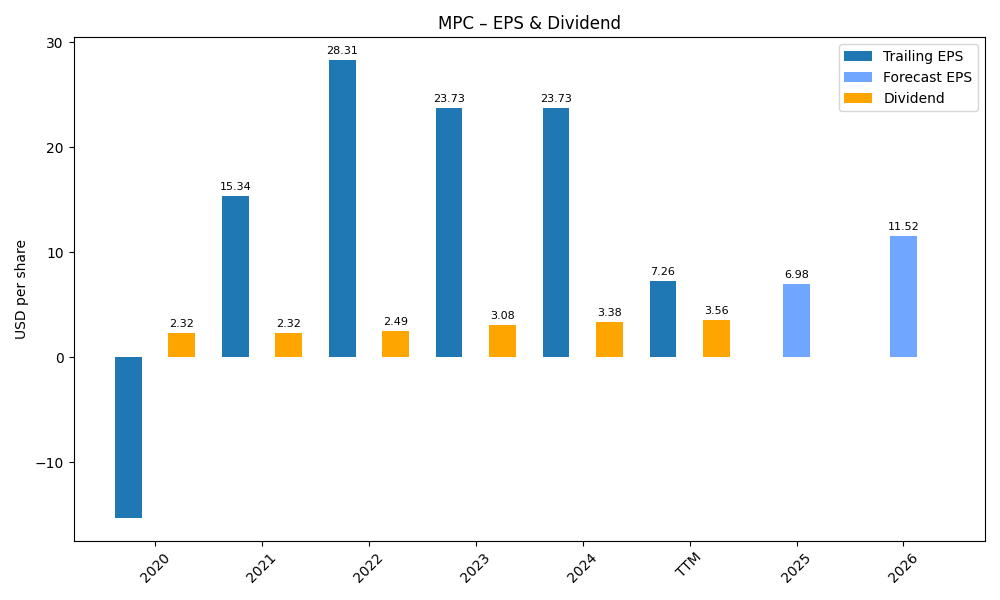
EPS
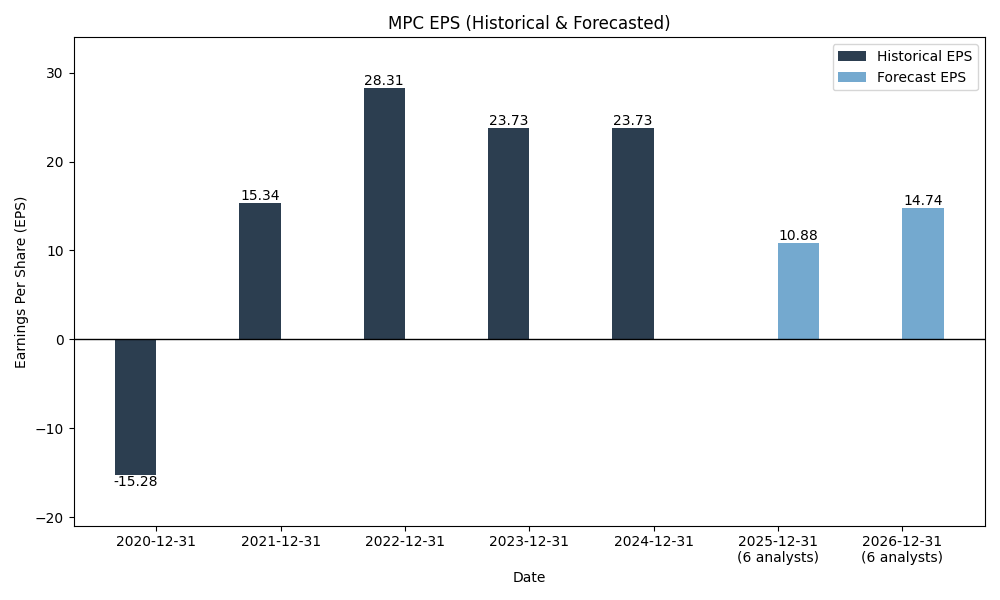
Forecasts
Y/Y % Change
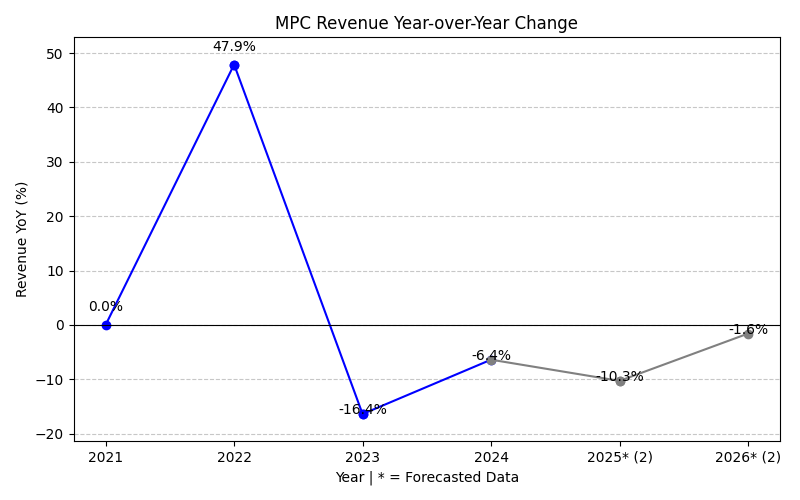
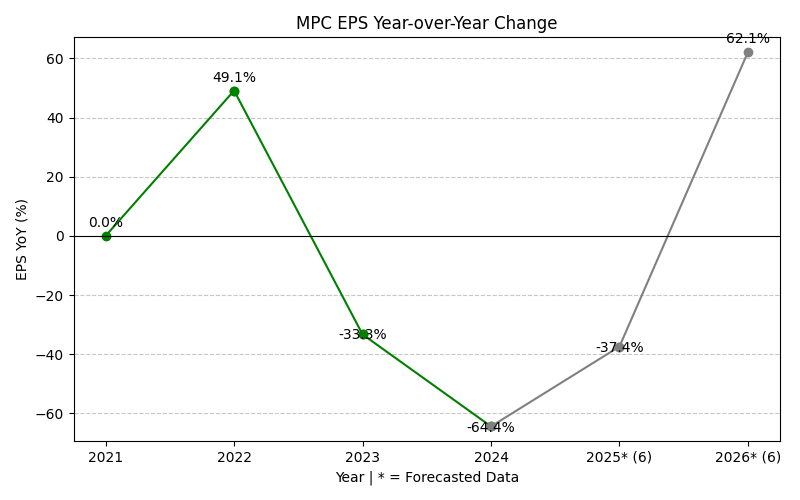
MPC Year-over-Year Growth
| 2020 | 2021 | 2022 | 2023 | 2024 | 2025 | 2026 | 2027 | Average | |
|---|---|---|---|---|---|---|---|---|---|
| Revenue Growth (%) | 0.0% | 47.9% | -16.4% | -6.4% | -4.4% | 14.5% | -8.8% | 3.8% | |
| Revenue Analysts (#) | 0 | 0 | 0 | 0 | 0 | 0 | 11 | 11 | |
| EPS Growth (%) | 0.0% | 49.1% | -33.3% | -64.4% | 17.5% | 111.1% | -19.5% | 8.6% | |
| EPS Analysts (#) | 0 | 0 | 0 | 0 | 0 | 0 | 16 | 19 |
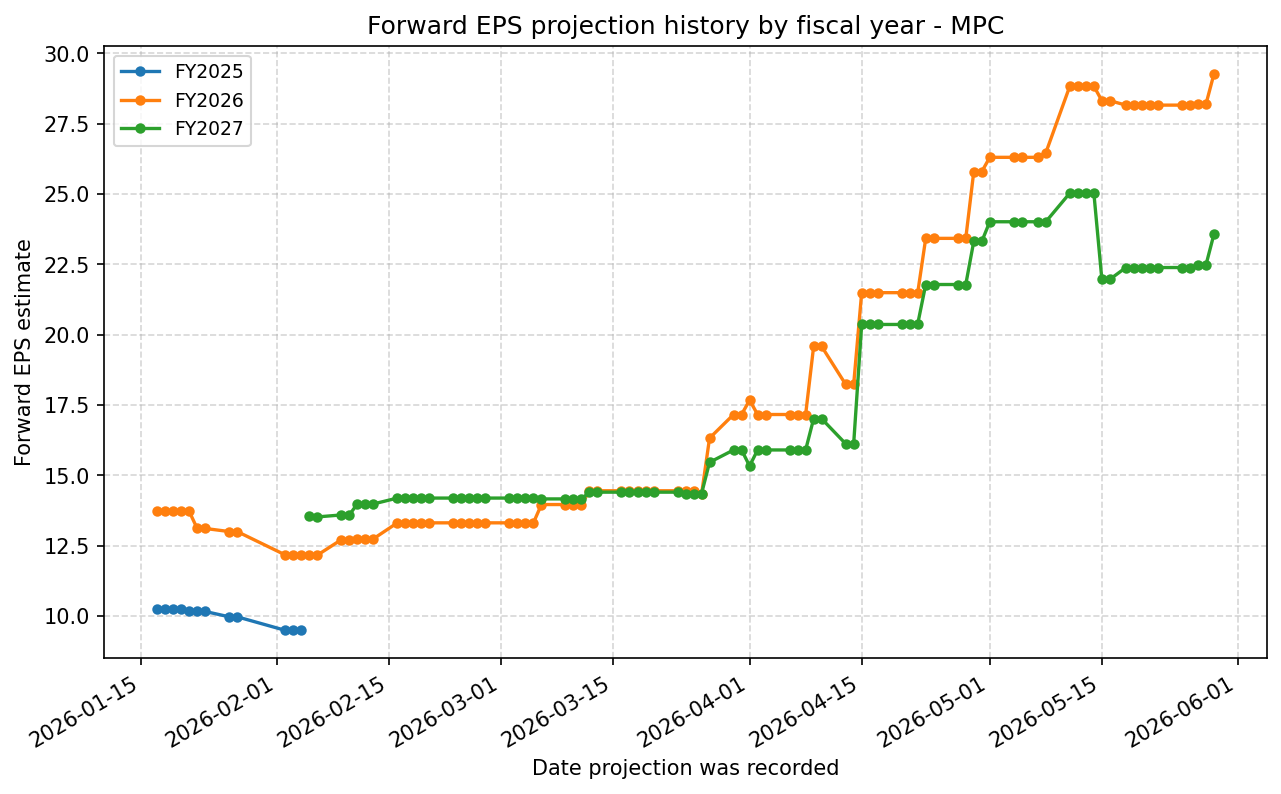
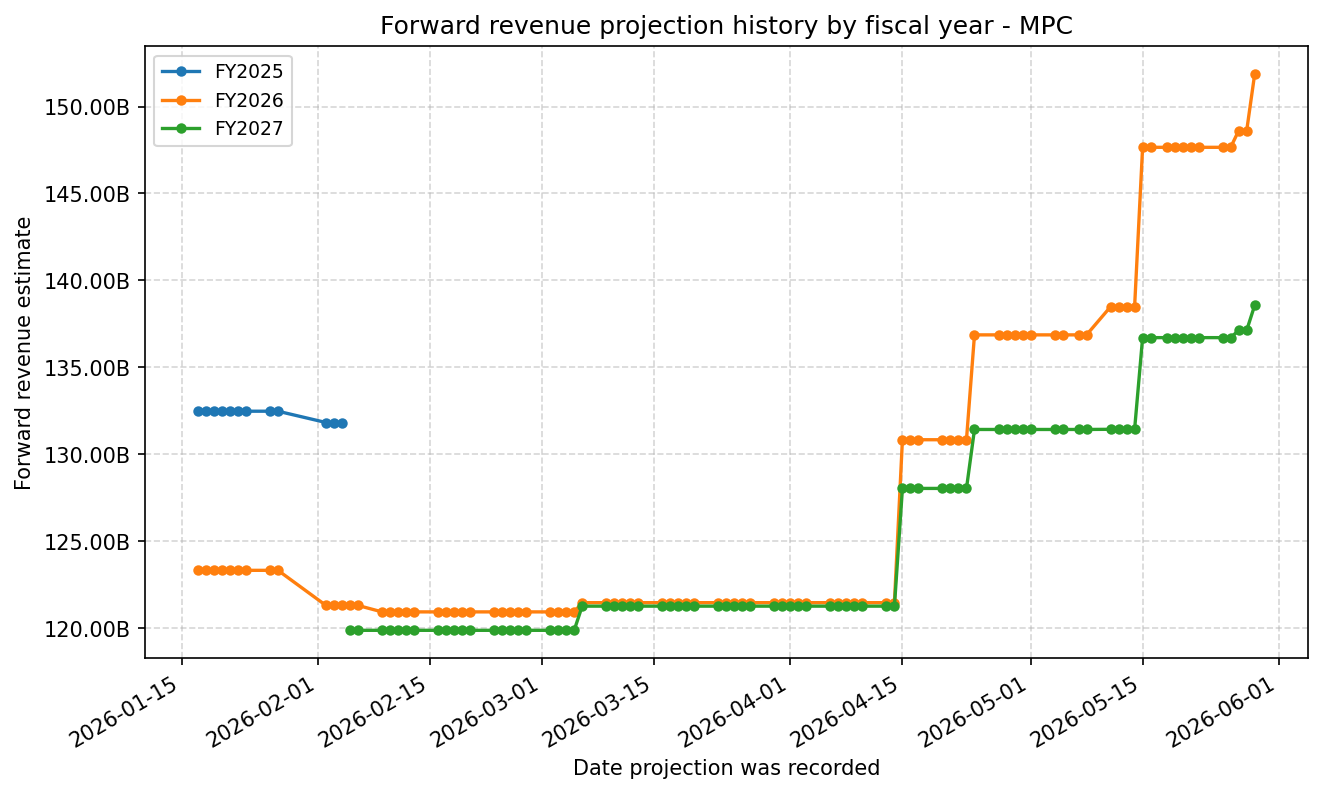
Forward Estimate History
How the next-FY EPS and revenue estimates have drifted over time. One line per fiscal year – past lines end when that FY became current.
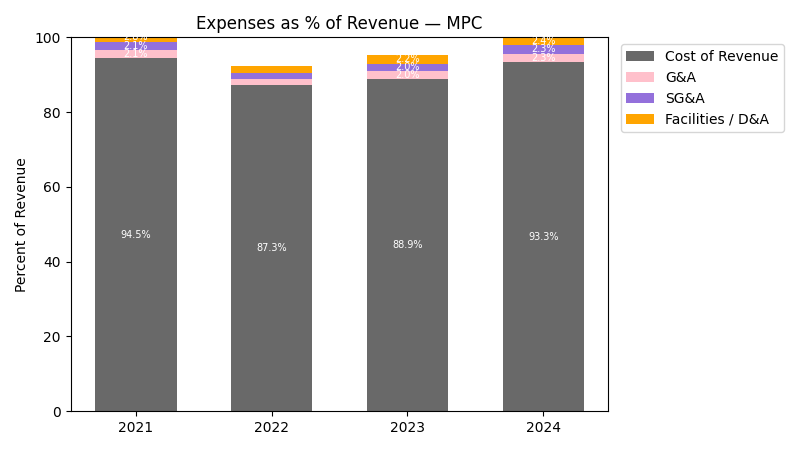
Expenses
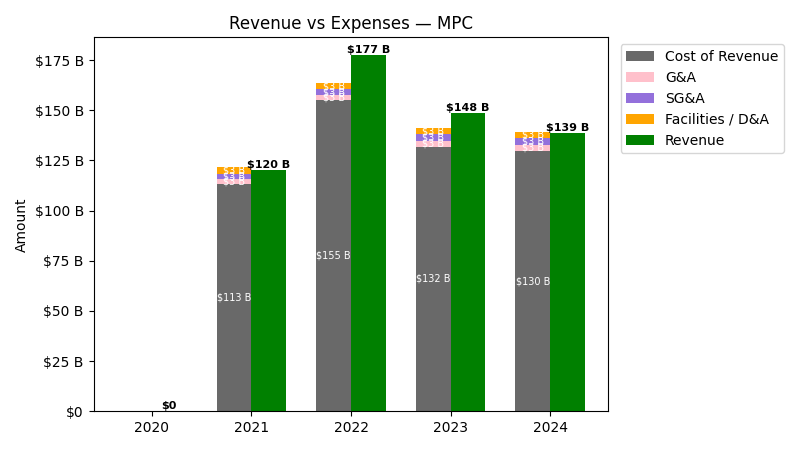
| Year | Revenue ($) | Cost of Revenue ($) | G&A ($) | SG&A ($) | Facilities / D&A ($) | Personnel ($) |
|---|---|---|---|---|---|---|
| 2022 | $177.5B | $151.7B | $2.8B | $2.8B | $3.2B | $0.0 |
| 2023 | $148.4B | $128.6B | $3.0B | $3.0B | $3.3B | $-89.0M |
| 2024 | $138.9B | $126.2B | $3.2B | $3.2B | $3.3B | $0.0 |
| 2025 | $132.7B | $119.4B | $3.3B | $3.3B | $3.3B | $0.0 |
| TTM | $135.4B | $121.3B | $3.4B | $3.4B | $3.3B | $0.0 |
| Year | Revenue Change (%) | Cost of Revenue Change (%) | G&A Change (%) | SG&A Change (%) | Facilities / D&A Change (%) | Personnel Change (%) |
|---|---|---|---|---|---|---|
| 2023 | -16.38 | -15.23 | 9.63 | 9.63 | 2.86 | -inf |
| 2024 | -6.41 | -1.81 | 5.99 | 5.99 | 0.91 | -100.0 |
| 2025 | -4.44 | -5.38 | 3.97 | 3.97 | -2.58 | NaN |
| TTM | 2.02 | 1.59 | 2.51 | 2.51 | 0.49 | NaN |
No unmapped expenses.
Segment Performance
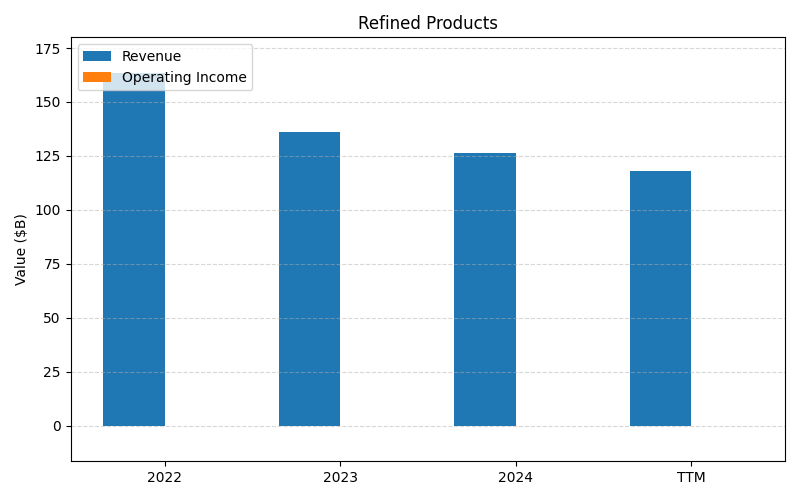
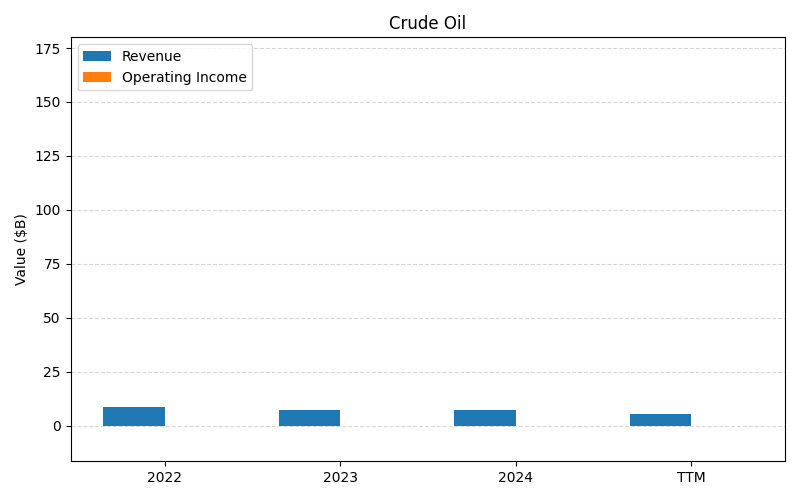
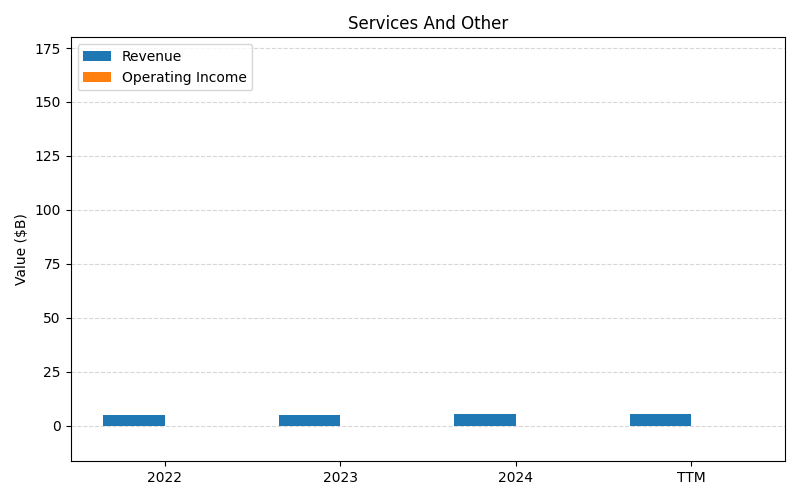
SEGMENTS v2025-09-09 · 2026-05-29 09:11 UTC — Units: $B. Rows list fiscal years (last 3 + TTM) with revenue for each segment; the final row shows the TTM revenue mix (operating income columns display “—” where mix is not applicable).
| Year | Refined Products Rev | Crude Oil Rev | Services And Other Rev | Total Rev |
|---|---|---|---|---|
| 2023 | 136B | 7.42B | 4.98B | 148.4B |
| 2024 | 126.2B | 7.30B | 5.40B | 138.9B |
| 2025 | 121.3B | 5.82B | 5.56B | 132.7B |
| TTM | 307.3B | 16.3B | 13.6B | 337.3B |
| % of Total (TTM) | 91.1% | 4.8% | 4.0% | 100% |
Segment Performance (Axis 2)
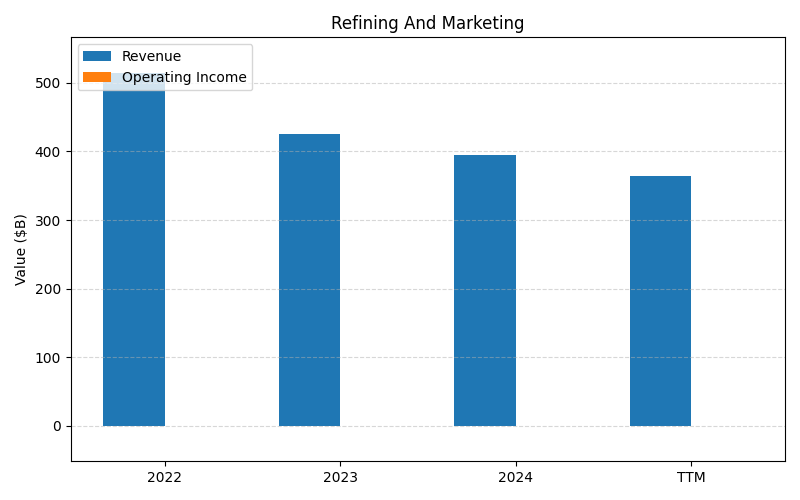
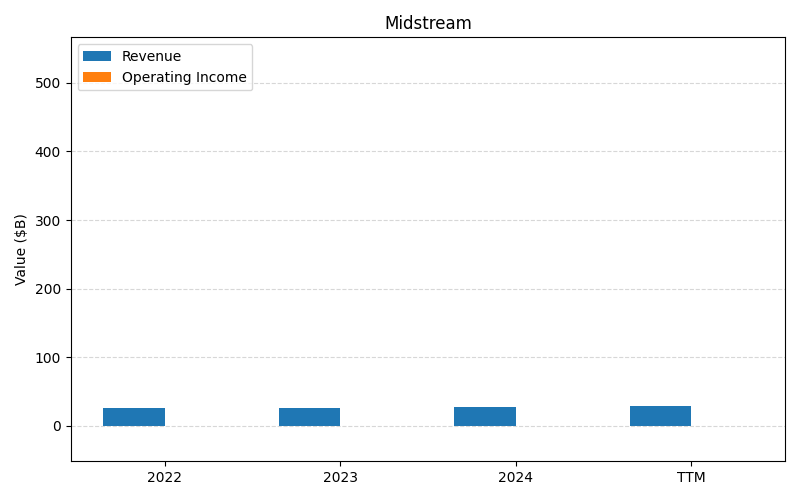
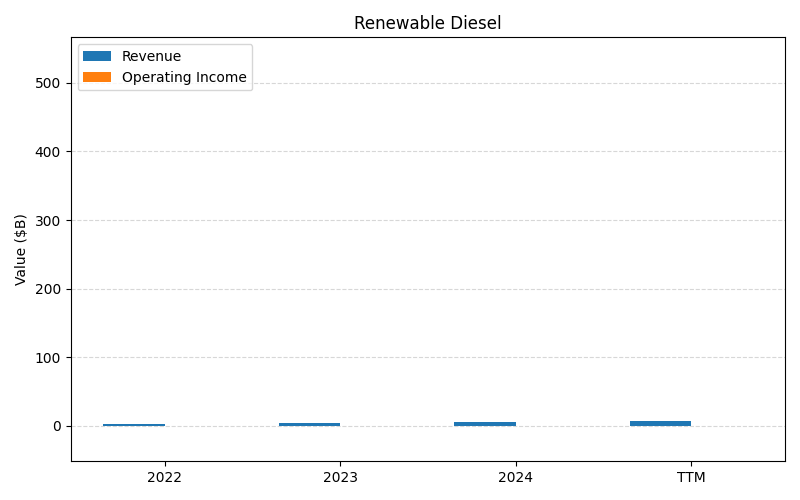
SEGMENTS v2025-09-09 · 2026-05-29 09:11 UTC — Units: $B. Rows list fiscal years (last 3 + TTM) with revenue for each segment; the final row shows the TTM revenue mix (operating income columns display “—” where mix is not applicable).
| Year | Refining And Marketing Rev | Midstream Rev | Renewable Diesel Rev | Total Rev |
|---|---|---|---|---|
| 2023 | 425.8B | 25.9B | 4.96B | 456.7B |
| 2024 | 395.1B | 27.2B | 6.29B | 428.6B |
| 2025 | 372.9B | 28.7B | 8.47B | 410B |
| TTM | 953.4B | 70.1B | 18.4B | 1041.9B |
| % of Total (TTM) | 91.5% | 6.7% | 1.8% | 100% |
Balance Sheet
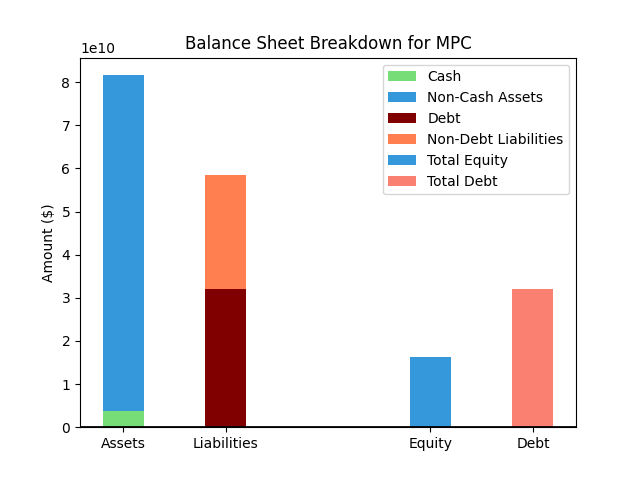
| Metric | Value | |
|---|---|---|
| 0 | Total Assets | $88,187M |
| 1 | Cash | $2,151M |
| 2 | Total Liabilities | $64,760M |
| 3 | Total Debt | $34,326M |
| 4 | Total Equity | $16,753M |
| 5 | Debt to Equity Ratio | 2.05 |
EPS & Dividend
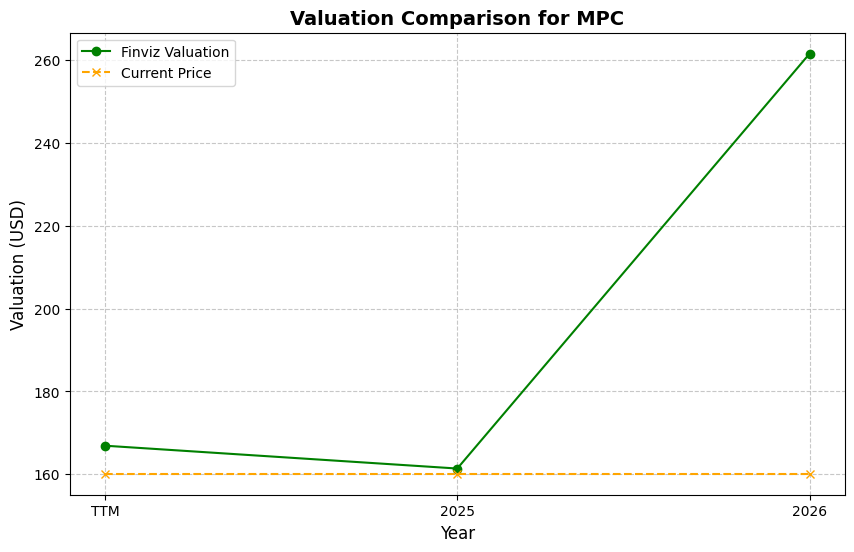
Valuation
| Share Price | Treasury Yield | Estimates | Fair Value (P/E) | Fair Value (P/S) | Current P/S | Current P/E |
|---|---|---|---|---|---|---|
| $248.77 | 4.5% | FINVIZ Growth: 22% | Nicks: 6 Finviz: 52 |
Nick's: 0.000 | 0.5 | 16.4 |
| Basis | Year | Nicks Valuation | Nicks vs Share Price | Finviz Valuation | Finviz vs Share Price |
|---|---|---|---|---|---|
| $15.18 EPS | TTM | $96.26 | -61.3% | $792.95 | 218.7% |
| $29.26 EPS | 2026 | $185.56 | -25.4% | $1528.58 | 514.5% |
| $23.57 EPS | 2027 | $149.45 | -39.9% | $1231.15 | 394.9% |
Implied Growth
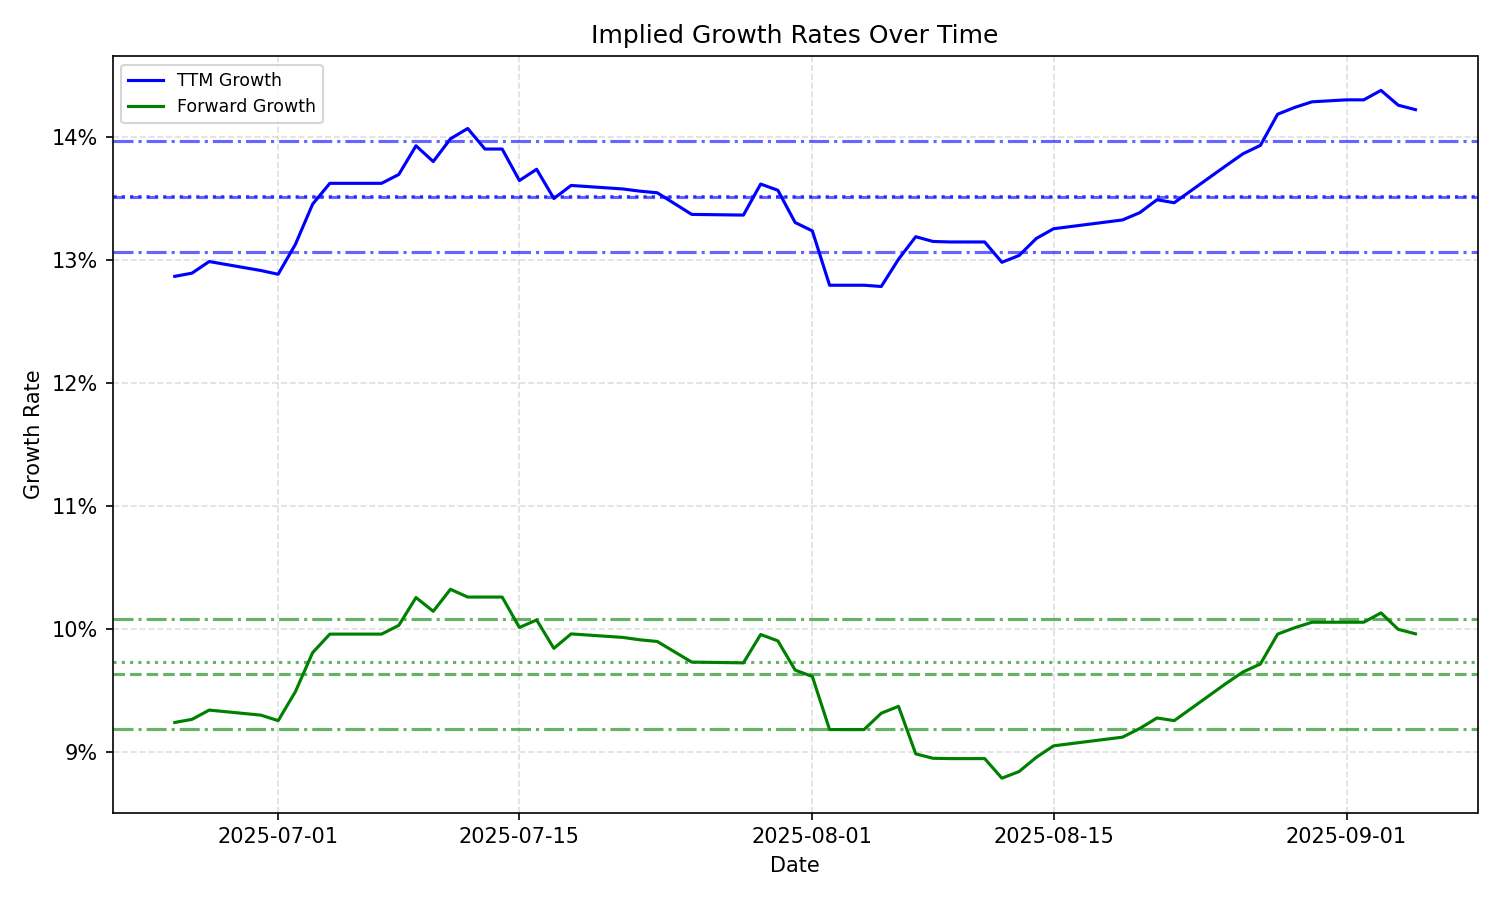
| Average | Median | Std Dev | Current | Percentile | ||||||
|---|---|---|---|---|---|---|---|---|---|---|
| TTM | Forward | TTM | Forward | TTM | Forward | TTM | Forward | TTM | Forward | |
| Timeframe | ||||||||||
| 1 Year | 11.85% | 8.66% | 11.47% | 9.18% | 2.13% | 1.81% | 9.63% | 5.10% | 15.9% | 0.4% |
| 3 Years | 11.85% | 8.66% | 11.47% | 9.18% | 2.13% | 1.81% | 9.63% | 5.10% | 15.9% | 0.4% |
| 5 Years | 11.85% | 8.66% | 11.47% | 9.18% | 2.13% | 1.81% | 9.63% | 5.10% | 15.9% | 0.4% |
| 10 Years | 11.85% | 8.66% | 11.47% | 9.18% | 2.13% | 1.81% | 9.63% | 5.10% | 15.9% | 0.4% |