MetLife, Inc. — MET
| Close Price | Market Cap | P/E Ratio | Forward P/E Ratio | Implied Growth* | Implied Forward Growth* | Dividend | P/B Ratio |
|---|---|---|---|---|---|---|---|
| $82.69 | $53.21B | 16.0 | 7.5 | 9.3% | 1.6% | $2.37 2.9% | 2.0 |
Latest Headlines
- · Ares Marks Eagle Football Debt To 16 Cents As MetLife Pushes Back
- · PFG Stock Trading at a Discount to Industry at 1.88X: Time to Hold?
- · Uber Plans $49 Shuttle for New York-New Jersey World Cup Matches
- · Morgan Stanley Raises its Price Target on MetLife (MET)
- · MetLife Adds Liquidity To Annuity As Stock Trades Below Estimates
- · Sector Update: Financial Stocks Decline Late Afternoon
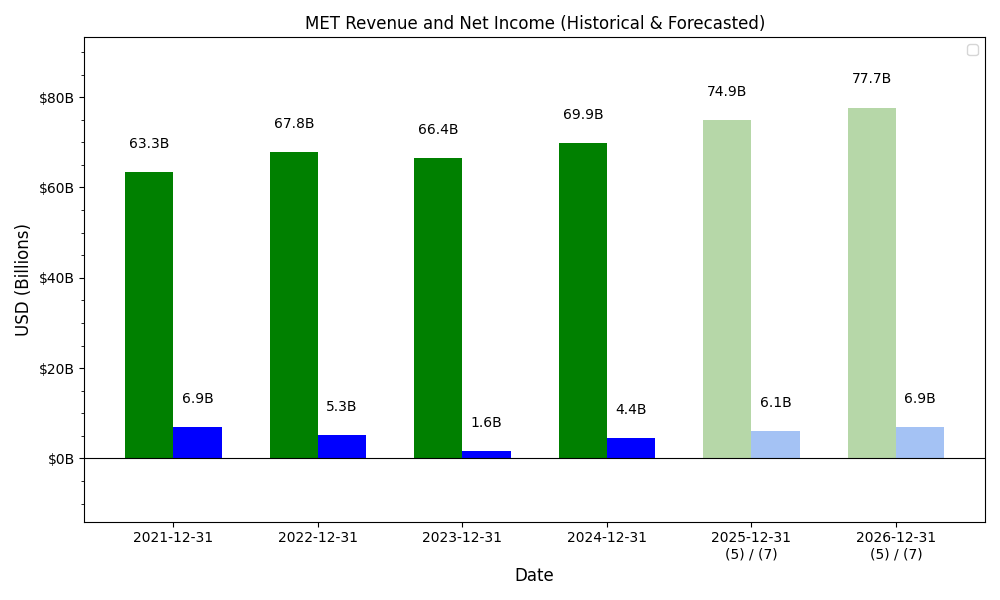
Revenue & Net Income
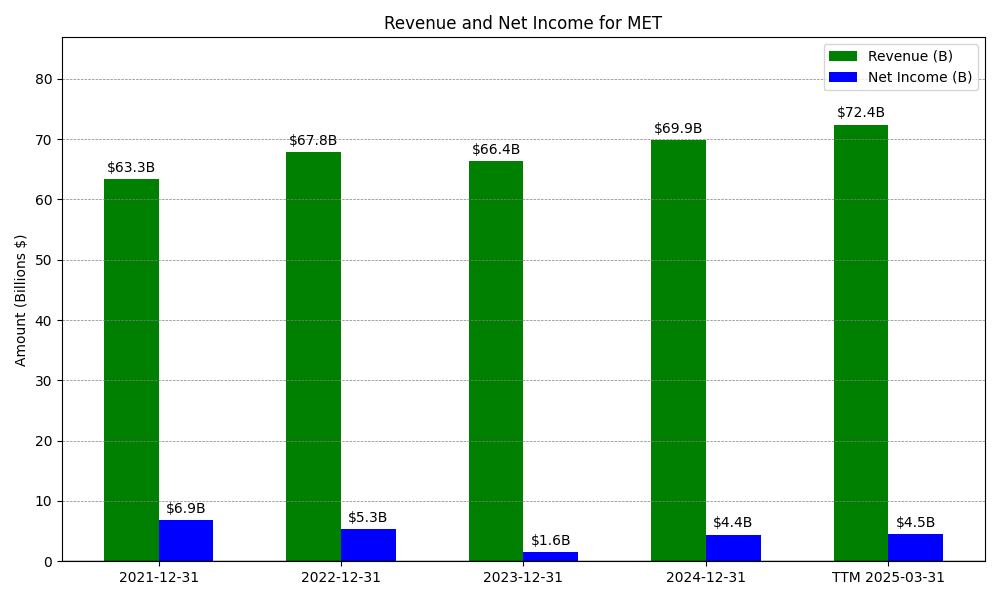
| Date | Revenue | Net_Income | EPS | Last_Updated | Revenue_Change | Net_Income_Change | EPS_Change | |
|---|---|---|---|---|---|---|---|---|
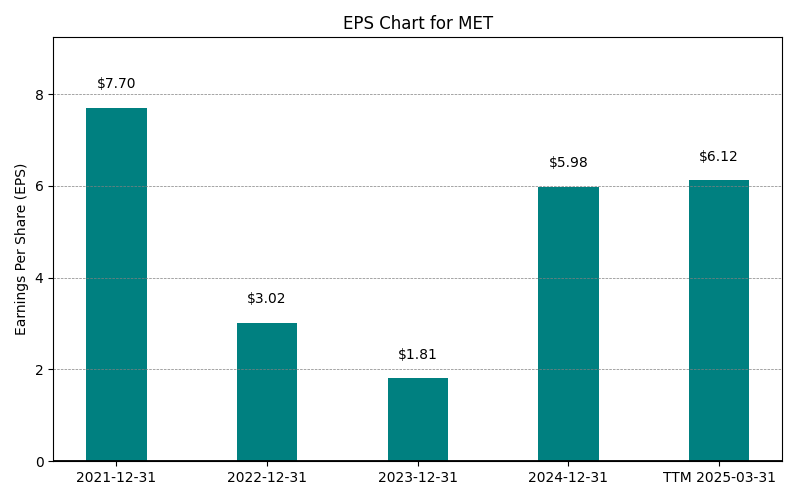
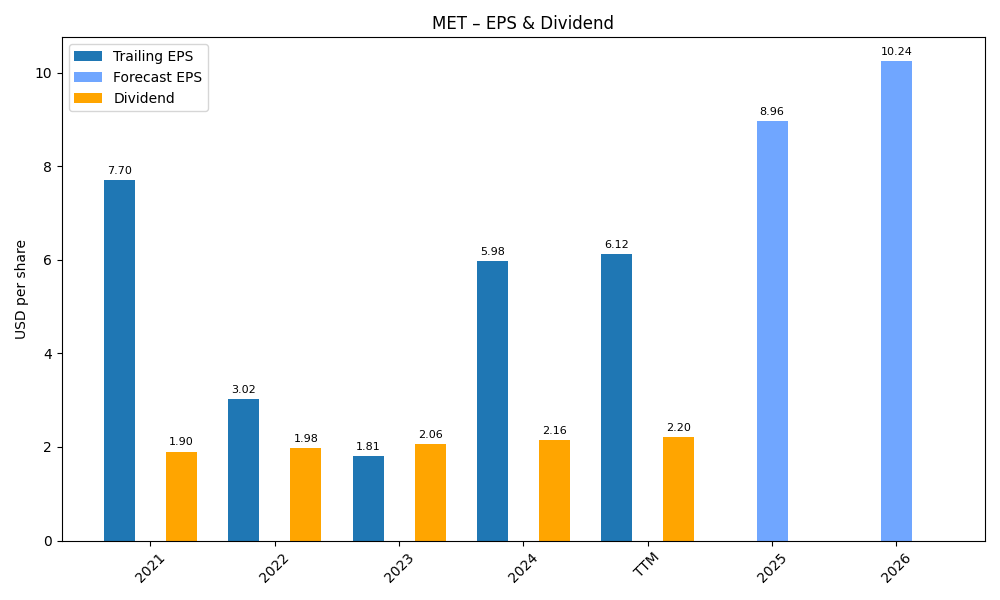
| 0 | 2021-12-31 | $67,409M | $5,284M | $7.70 | 2026-03-03 08:37:14 | N/A | N/A | N/A |
| 1 | 2022-12-31 | $67,409M | $5,284M | $3.02 | 2026-05-29 09:11:22 | 0.0% | 0.0% | -60.7% |
| 2 | 2023-12-31 | $67,934M | $1,578M | $1.81 | 2026-05-29 09:11:22 | 0.8% | -70.1% | -40.1% |
| 3 | 2024-12-31 | $70,131M | $4,426M | $6.13 | 2026-05-29 09:11:22 | 3.2% | 180.5% | 238.8% |
| 4 | 2025-12-31 | $75,654M | $3,379M | $4.84 | 2026-05-29 09:11:22 | 7.9% | -23.7% | -21.0% |
| 5 | TTM 2026-03-31 | $75,964M | $3,619M | $5.17 | 2026-05-20 09:09:59 | 0.4% | 7.1% | 6.8% |
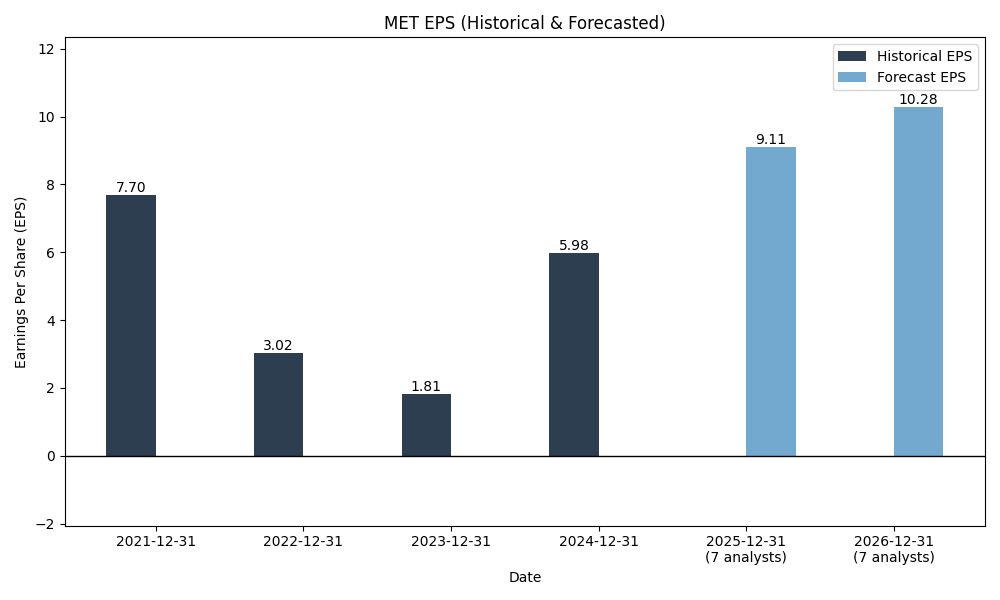
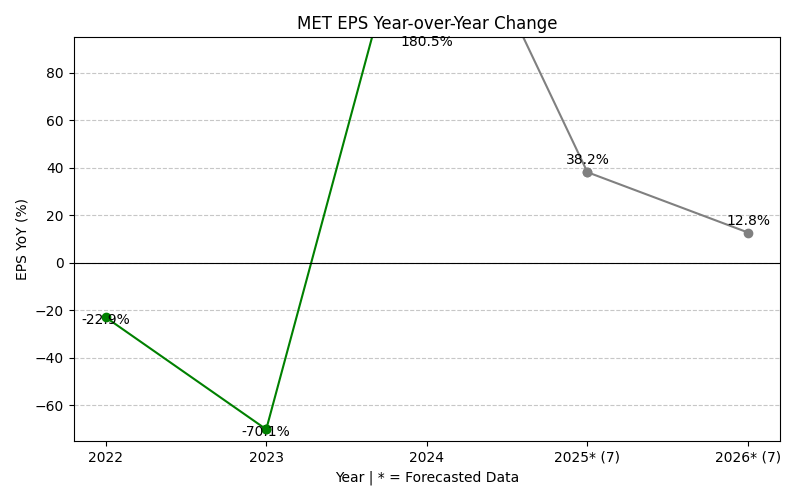
EPS
Forecasts
Y/Y % Change
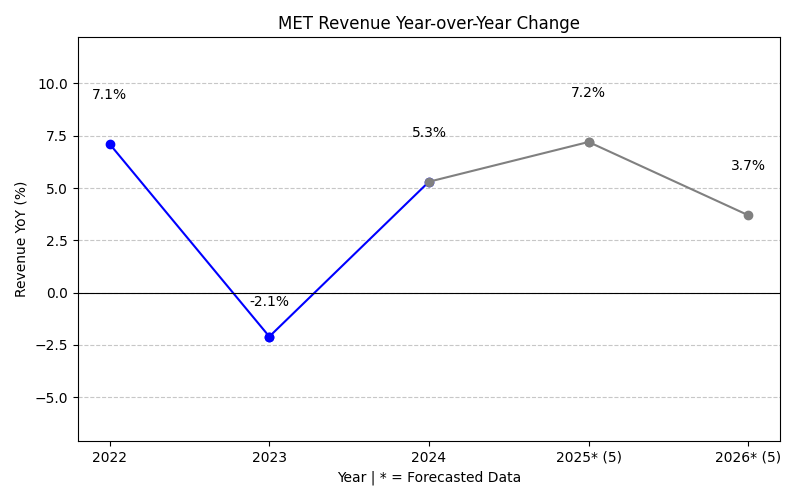
MET Year-over-Year Growth
| 2021 | 2022 | 2023 | 2024 | 2025 | 2026 | 2027 | Average | |
|---|---|---|---|---|---|---|---|---|
| Revenue Growth (%) | 0.0% | 0.8% | 3.2% | 7.9% | 4.8% | 5.1% | 3.6% | |
| Revenue Analysts (#) | 0 | 0 | 0 | 0 | 0 | 7 | 9 | |
| EPS Growth (%) | 0.0% | -70.1% | 180.5% | -23.7% | 88.0% | 11.4% | 31.0% | |
| EPS Analysts (#) | 0 | 0 | 0 | 0 | 0 | 17 | 17 |
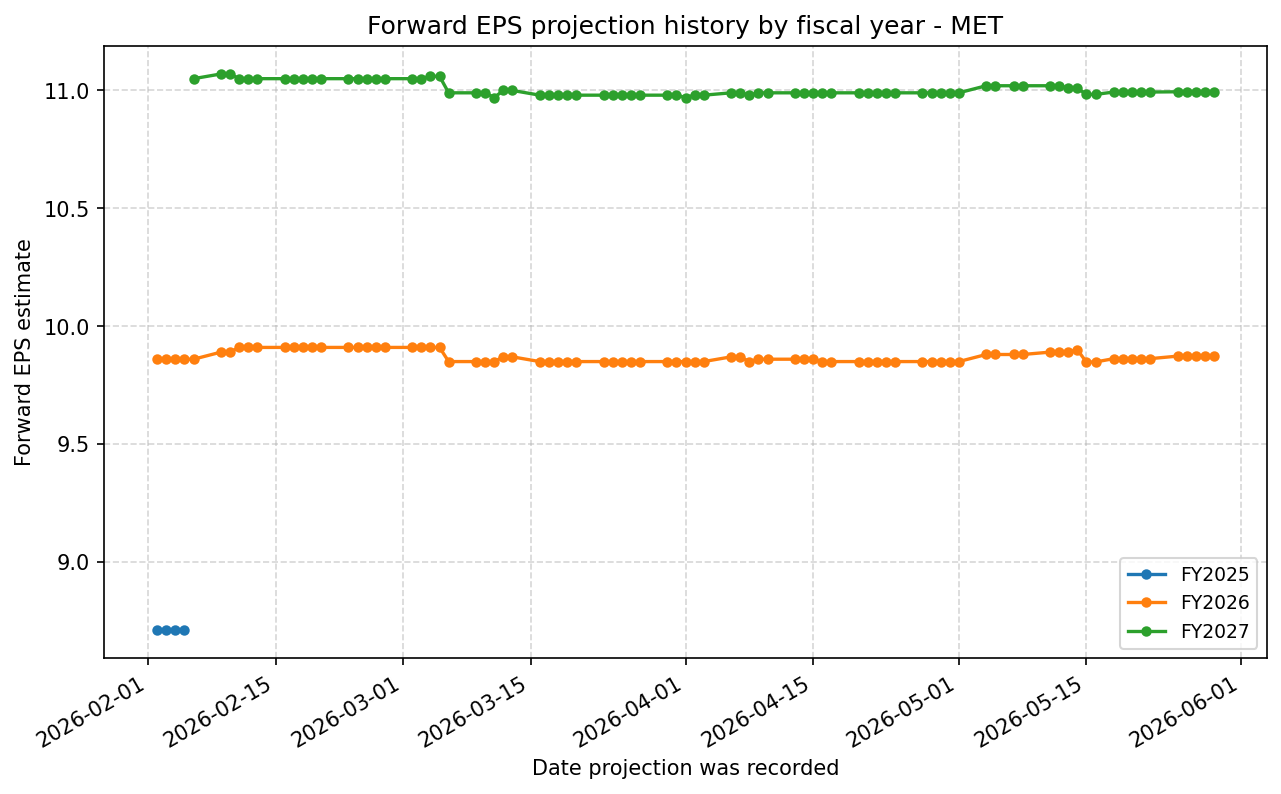
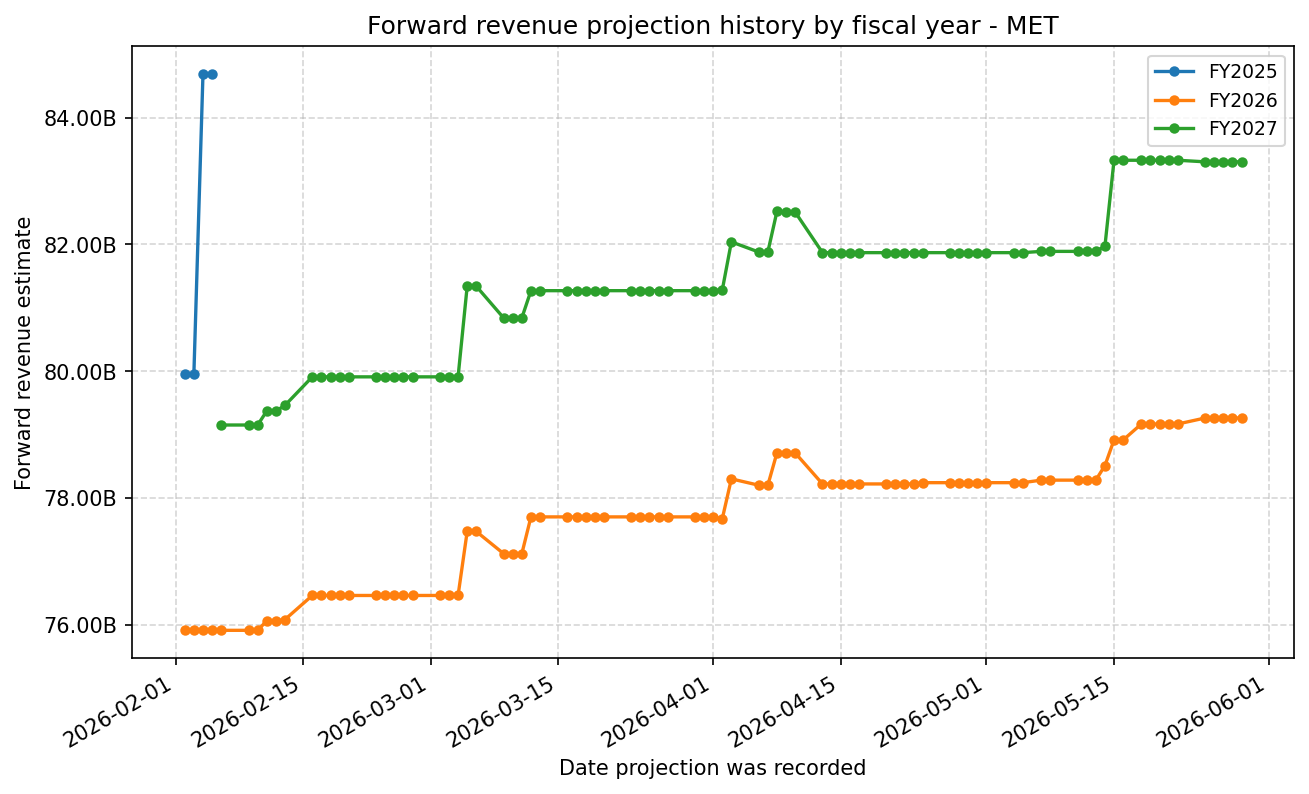
Forward Estimate History
How the next-FY EPS and revenue estimates have drifted over time. One line per fiscal year – past lines end when that FY became current.
Expenses
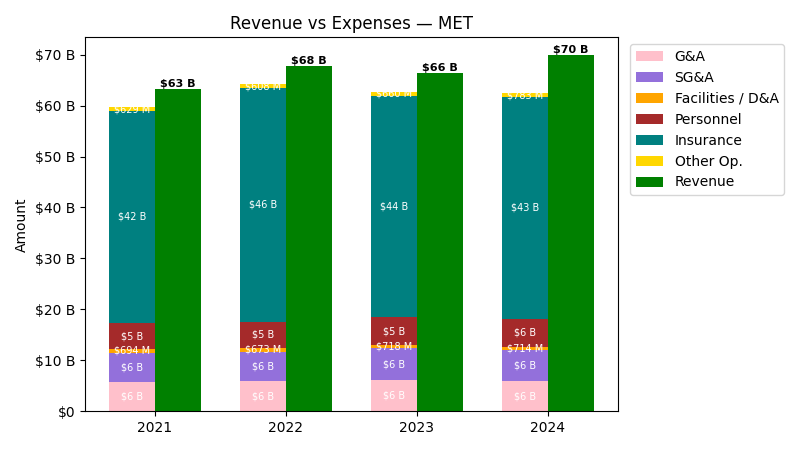
| Year | Revenue ($) | G&A ($) | SG&A ($) | Facilities / D&A ($) | Personnel ($) | Insurance / Claims ($) |
|---|---|---|---|---|---|---|
| 2022 | $67.4B | $5.9B | $5.9B | $673.0M | $5.2B | $45.9B |
| 2023 | $67.9B | $6.2B | $6.2B | $718.0M | $5.3B | $43.6B |
| 2024 | $70.1B | $6.0B | $6.0B | $714.0M | $5.5B | $43.4B |
| 2025 | $75.7B | $6.3B | $6.3B | $753.0M | $5.7B | $49.1B |
| TTM | $76.0B | $6.4B | $6.4B | $0.0 | $5.8B | $49.0B |
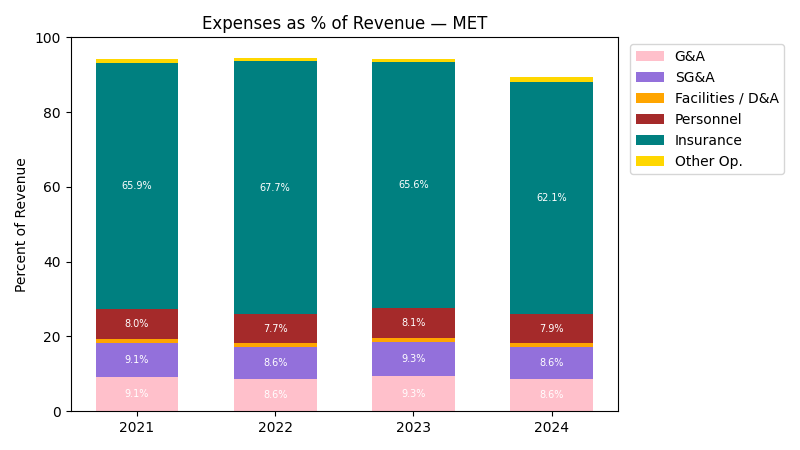
| Year | Revenue Change (%) | G&A Change (%) | SG&A Change (%) | Facilities / D&A Change (%) | Personnel Change (%) | Insurance / Claims Change (%) |
|---|---|---|---|---|---|---|
| 2023 | 0.78 | 5.41 | 5.41 | 6.69 | 3.04 | -5.21 |
| 2024 | 3.23 | -3.01 | -3.01 | -0.56 | 3.01 | -0.32 |
| 2025 | 7.88 | 4.76 | 4.76 | 5.46 | 3.74 | 13.01 |
| TTM | 0.41 | 2.15 | 2.15 | -100.00 | 2.26 | -0.21 |
No unmapped expenses.
Segment Performance
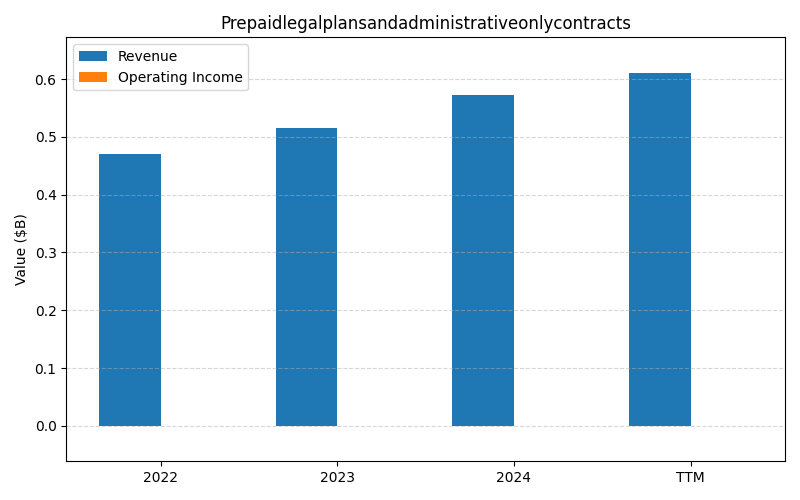
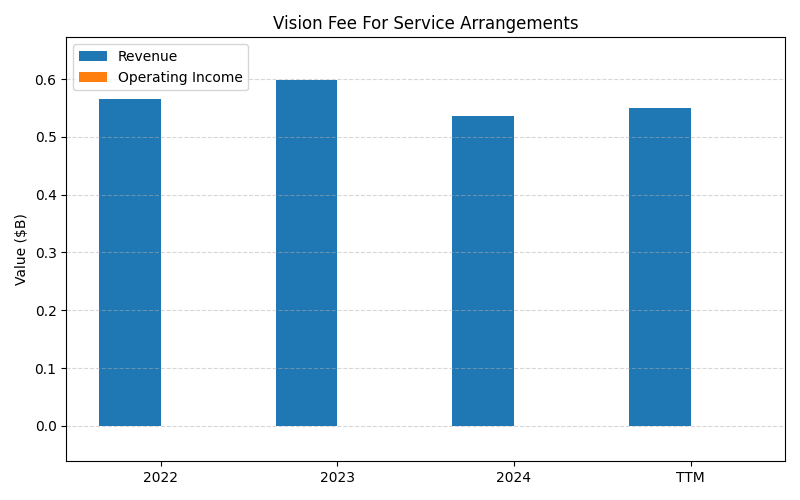
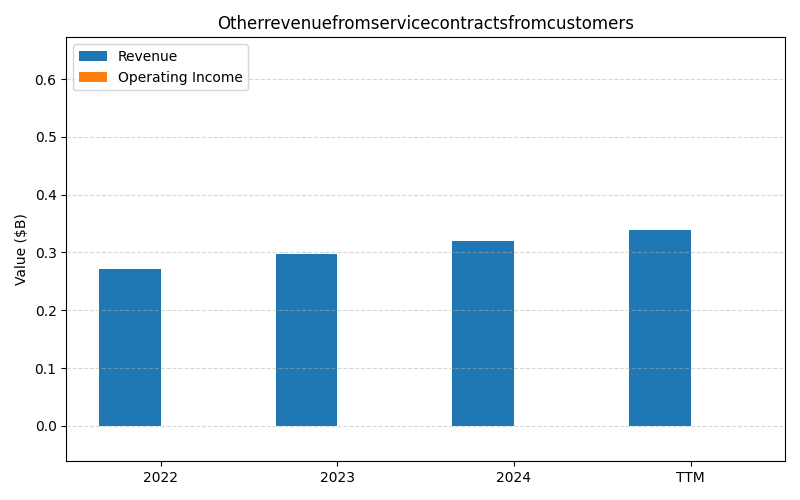
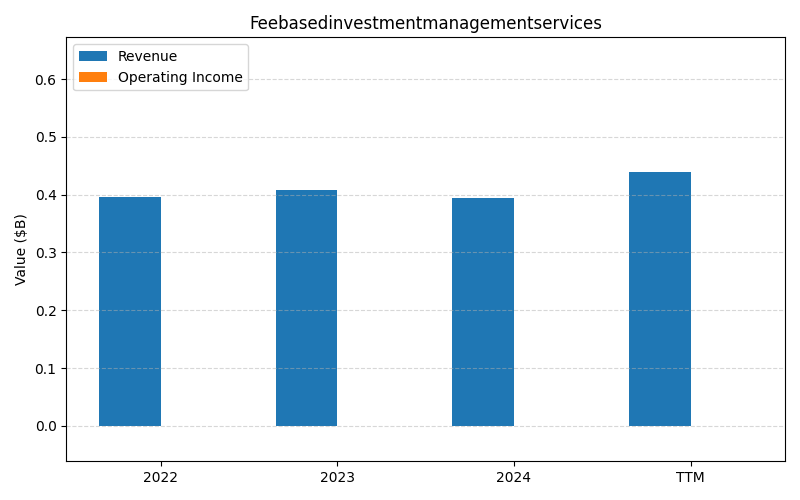
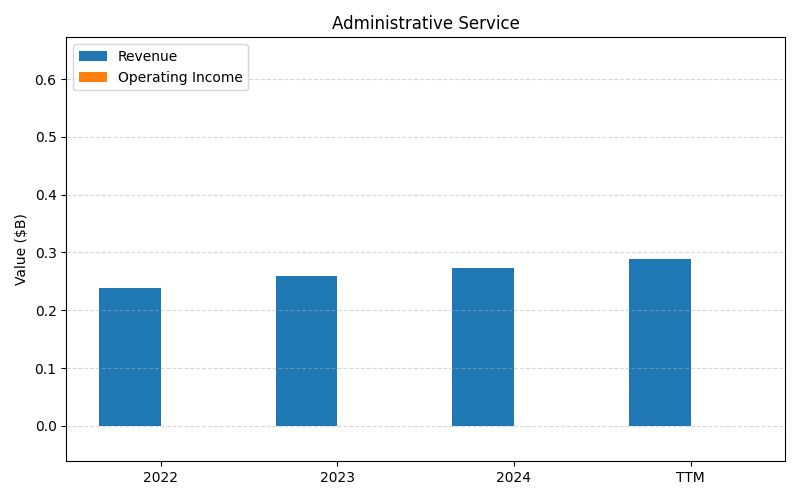
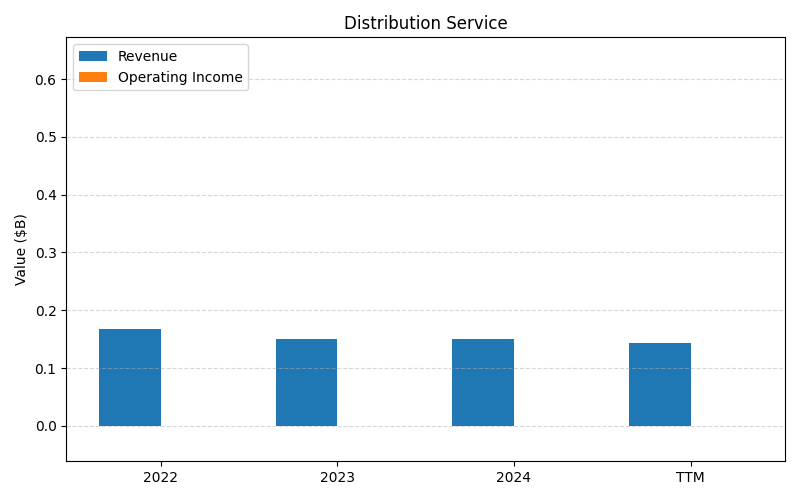
SEGMENTS v2025-09-09 · 2026-05-29 09:11 UTC — Units: $B. Rows list fiscal years (last 3 + TTM) with revenue for each segment; the final row shows the TTM revenue mix (operating income columns display “—” where mix is not applicable).
| Year | Prepaidlegalplansandadministrativeonlycontracts Rev | Vision Fee For Service Arrangements Rev | Otherrevenuefromservicecontractsfromcustomers Rev | Feebasedinvestmentmanagementservices Rev | Administrative Service Rev | Distribution Service Rev | Total Rev |
|---|---|---|---|---|---|---|---|
| 2023 | 0.52B | 0.60B | 0.39B | 0.32B | 0.26B | 0.15B | 2.23B |
| 2024 | 0.57B | 0.54B | 0.41B | 0.30B | 0.27B | 0.15B | 2.25B |
| 2025 | 0.64B | 0.56B | 0.43B | 0.37B | 0.29B | 0.14B | 2.44B |
| TTM | 1.55B | 1.41B | 1.05B | 0.93B | 0.72B | 0.36B | 6.03B |
| % of Total (TTM) | 25.7% | 23.4% | 17.4% | 15.5% | 12.0% | 6.0% | 100% |
Segment Performance (Axis 2)
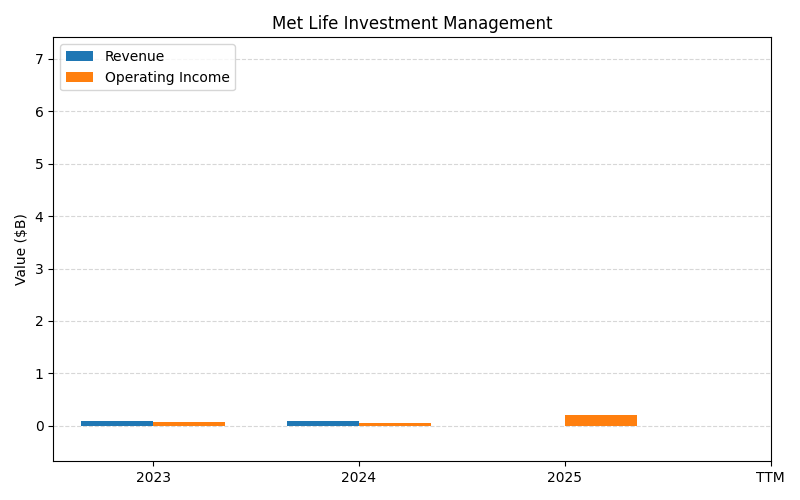
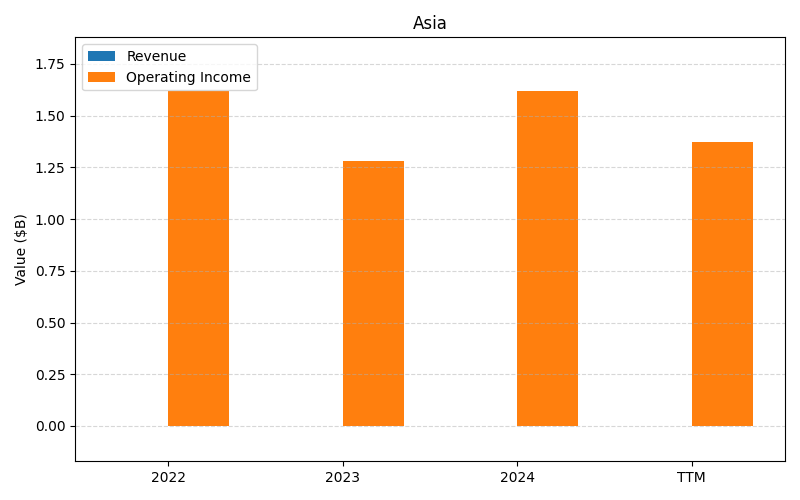
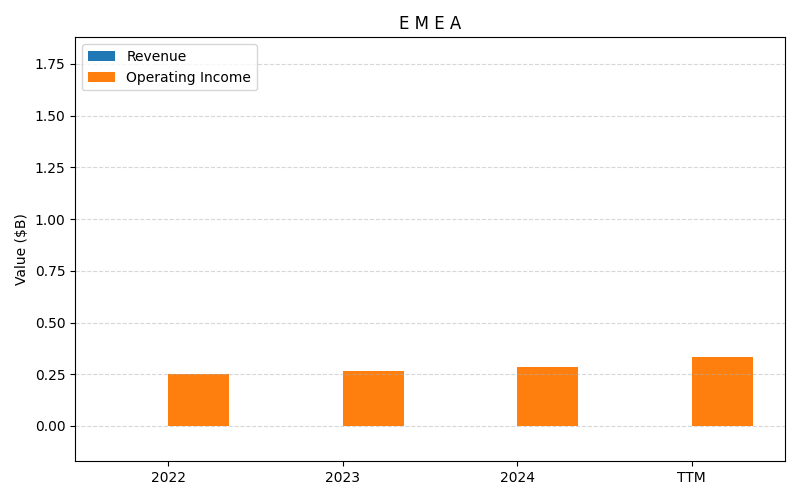

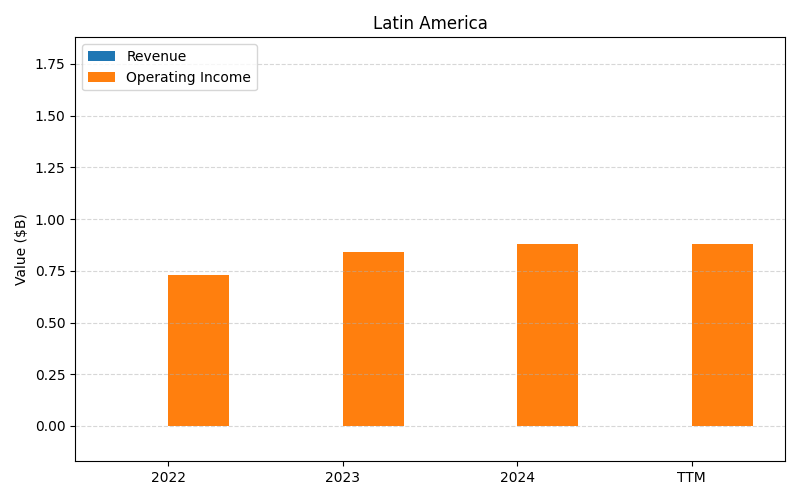
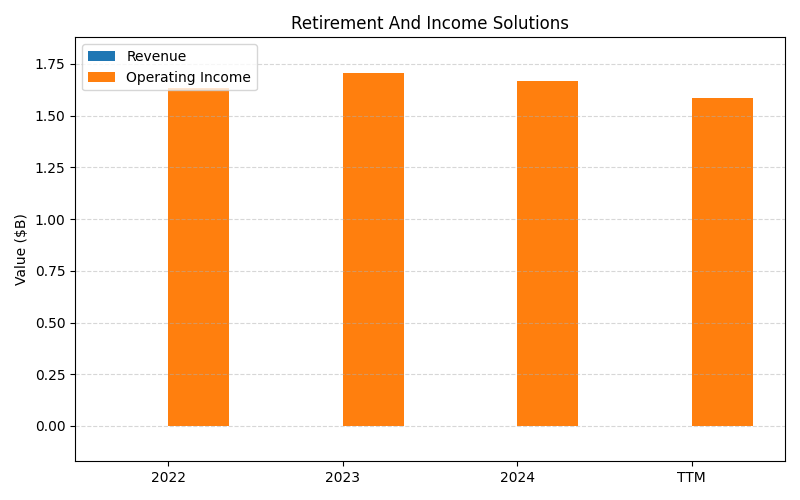
SEGMENTS v2025-09-09 · 2026-05-29 09:11 UTC — Units: $B. Rows list fiscal years (last 3 + TTM) with revenue and operating income for each segment; the final row shows the TTM revenue mix (operating income columns display “—” where mix is not applicable).
| Year | Met Life Investment Management Rev | Met Life Investment Management OI | Asia Rev | Asia OI | E M E A Rev | E M E A OI | Group Benefits Rev | Group Benefits OI | Latin America Rev | Latin America OI | Retirement And Income Solutions Rev | Retirement And Income Solutions OI | Total Rev | Total OI |
|---|---|---|---|---|---|---|---|---|---|---|---|---|---|---|
| 2023 | 0.09B | 0.07B | – | 1.28B | – | 0.27B | – | 1.66B | – | 0.84B | – | 1.71B | 0.09B | 5.82B |
| 2024 | 0.09B | 0.06B | – | 1.62B | – | 0.28B | – | 1.61B | – | 0.88B | – | 1.67B | 0.09B | 6.11B |
| 2025 | – | 0.20B | – | 1.70B | – | 0.37B | – | 1.69B | – | 0.80B | – | 1.67B | – | 6.43B |
| TTM | 0.12B | 0.33B | 0.00B | 4.18B | 0.00B | 0.84B | 0.00B | 4.11B | 0.00B | 2.13B | 0.00B | 4.20B | 0.12B | 15.8B |
| % of Total (TTM) | 100.0% | — | 0.0% | — | 0.0% | — | 0.0% | — | 0.0% | — | 0.0% | — | 100% | — |
Balance Sheet
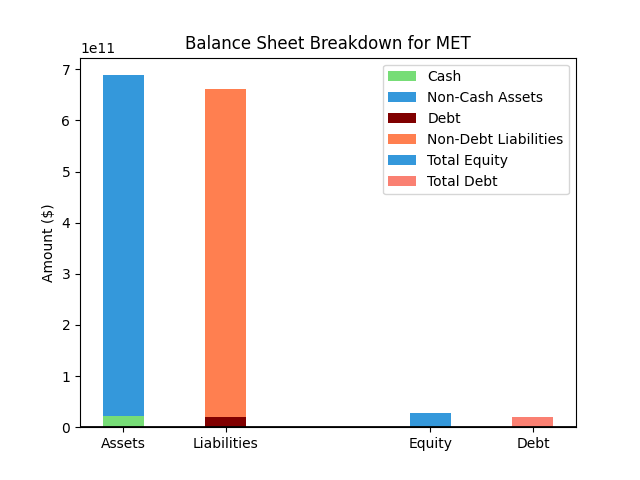
| Metric | Value | |
|---|---|---|
| 0 | Total Assets | $743,211M |
| 1 | Cash | $22,687M |
| 2 | Total Liabilities | $715,410M |
| 3 | Total Debt | $21,130M |
| 4 | Total Equity | $27,324M |
| 5 | Debt to Equity Ratio | 0.77 |
EPS & Dividend
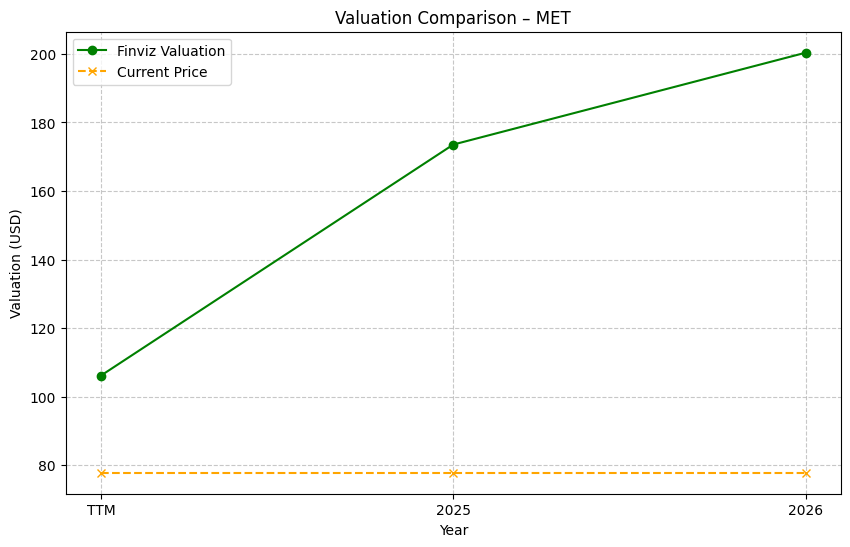
Valuation
| Share Price | Treasury Yield | Estimates | Fair Value (P/E) | Fair Value (P/S) | Current P/S | Current P/E |
|---|---|---|---|---|---|---|
| $82.69 | 4.5% | FINVIZ Growth: 12% | Nicks: 6 Finviz: 20 |
Nick's: 0.000 | 0.7 | 16.0 |
| Basis | Year | Nicks Valuation | Nicks vs Share Price | Finviz Valuation | Finviz vs Share Price |
|---|---|---|---|---|---|
| $5.17 EPS | TTM | $32.78 | -60.4% | $102.44 | 23.9% |
| $9.87 EPS | 2026 | $62.61 | -24.3% | $195.62 | 136.6% |
| $10.99 EPS | 2027 | $69.72 | -15.7% | $217.84 | 163.4% |
Implied Growth
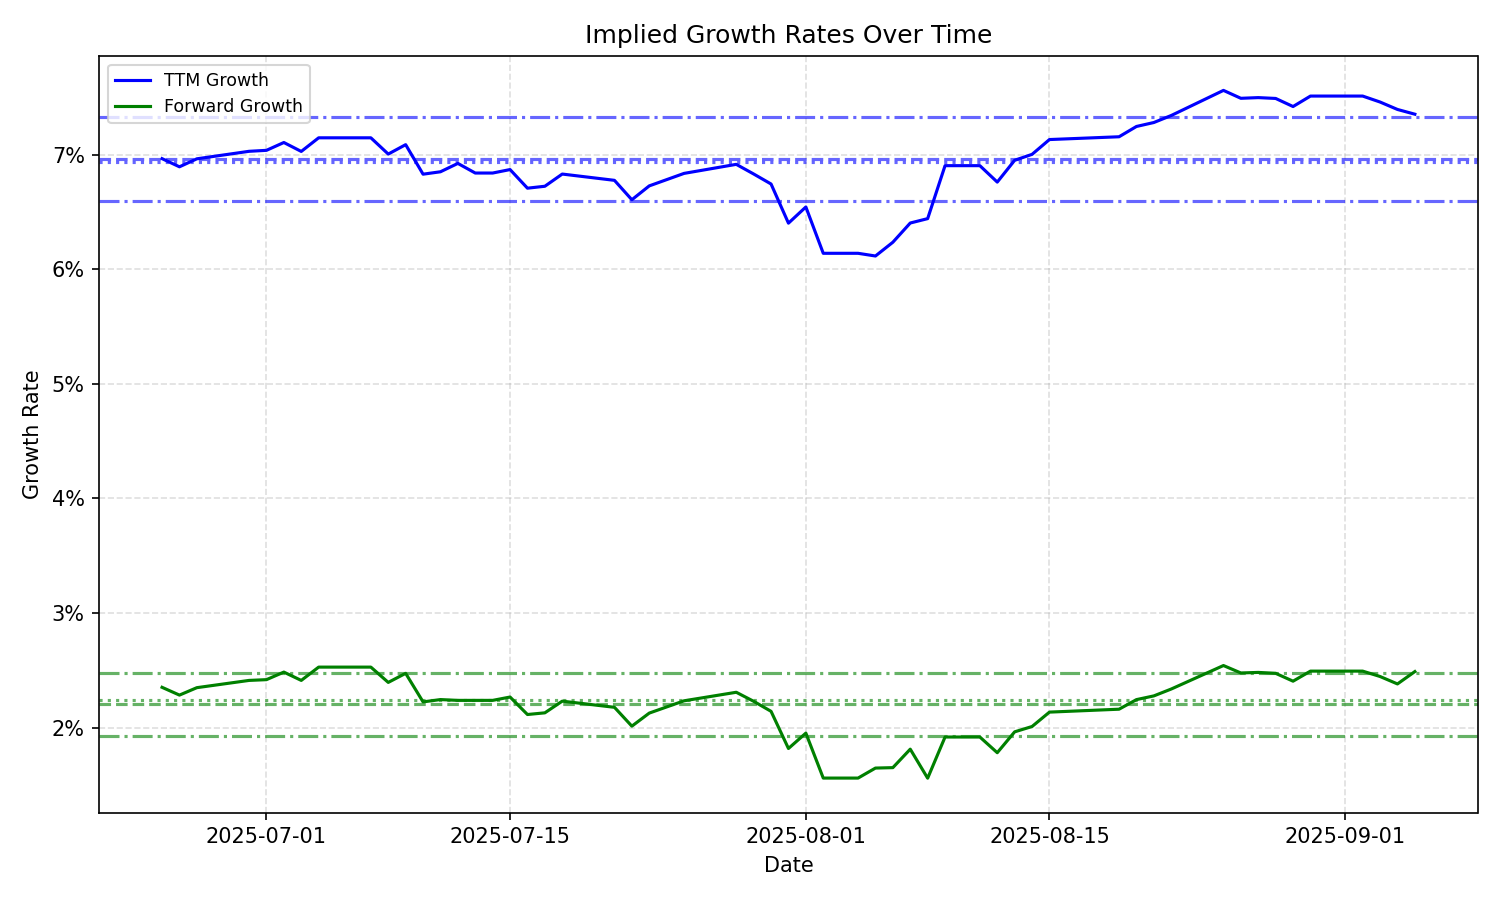
| Average | Median | Std Dev | Current | Percentile | ||||||
|---|---|---|---|---|---|---|---|---|---|---|
| TTM | Forward | TTM | Forward | TTM | Forward | TTM | Forward | TTM | Forward | |
| Timeframe | ||||||||||
| 1 Year | 7.47% | 2.06% | 7.28% | 2.10% | 0.74% | 0.35% | 9.17% | 1.56% | 94.8% | 6.5% |
| 3 Years | 7.47% | 2.06% | 7.28% | 2.10% | 0.74% | 0.35% | 9.17% | 1.56% | 94.8% | 6.5% |
| 5 Years | 7.47% | 2.06% | 7.28% | 2.10% | 0.74% | 0.35% | 9.17% | 1.56% | 94.8% | 6.5% |
| 10 Years | 7.47% | 2.06% | 7.28% | 2.10% | 0.74% | 0.35% | 9.17% | 1.56% | 94.8% | 6.5% |