Meta Platforms, Inc. — META
| Close Price | Market Cap | P/E Ratio | Forward P/E Ratio | Implied Growth* | Implied Forward Growth* | Dividend | P/B Ratio |
|---|---|---|---|---|---|---|---|
| $632.51 | $1.61T | 23.0 | 17.5 | 13.1% | 10.2% | $2.10 0.3% | 6.6 |
Latest Headlines
- · The insane rise and fall of MTV
- · Freddie Mac Issues Monthly Volume Summary for April 2026
- · Meta Expands Beyond Ads With Paid Facebook, Instagram, WhatsApp And AI Subscription
- · This $6.6 Billion AI CEO Has a Surprising Offer for Laid-Off Tech Workers
- · A Strategy On Meta Stock Has A Large Profit Zone With Little Upside Risk
- · CoreWeave Insiders Unload $107 Million in Stock
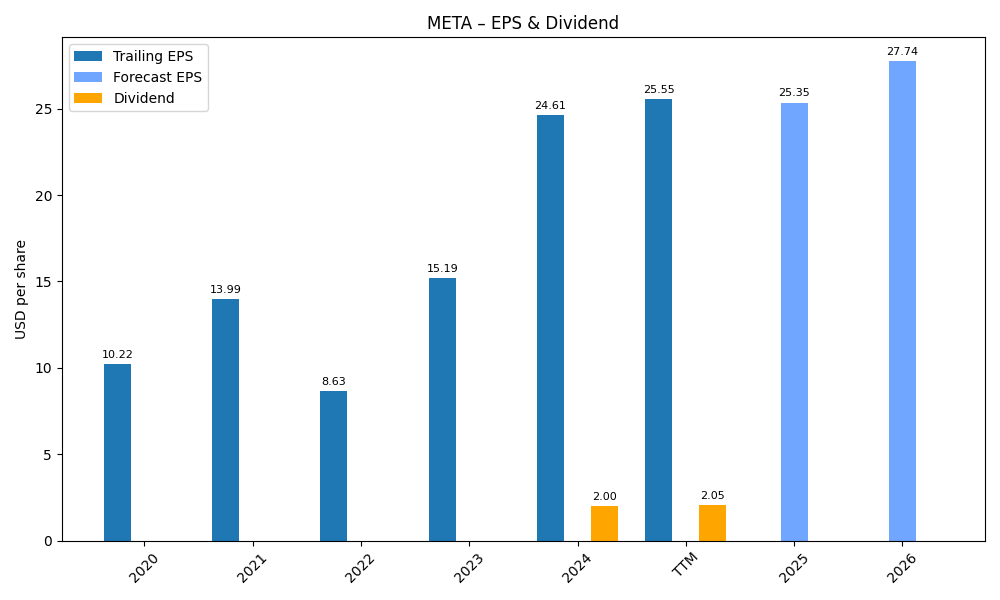
Revenue & Net Income
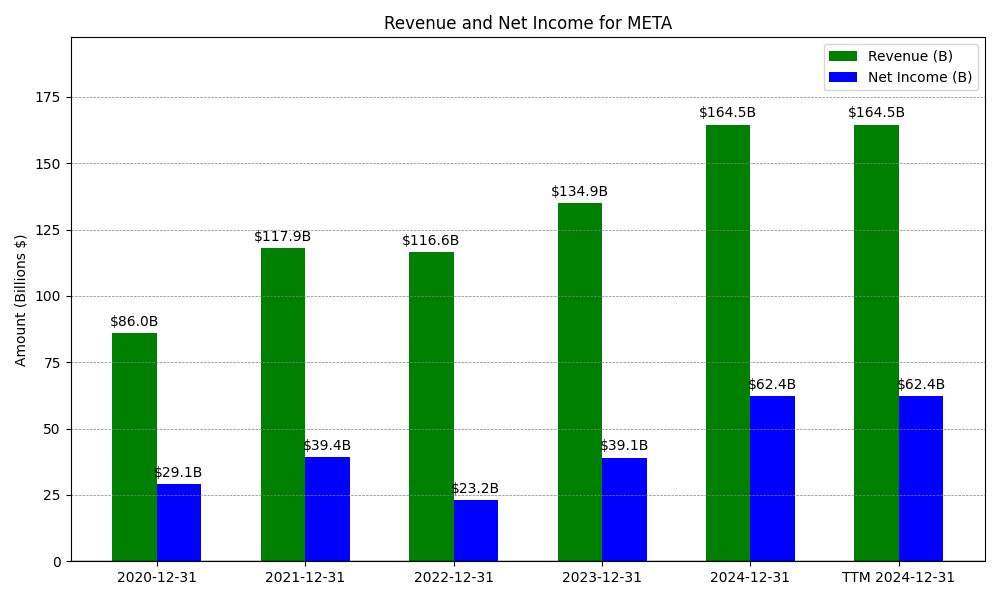
| Date | Revenue | Net_Income | EPS | Last_Updated | Revenue_Change | Net_Income_Change | EPS_Change | |
|---|---|---|---|---|---|---|---|---|
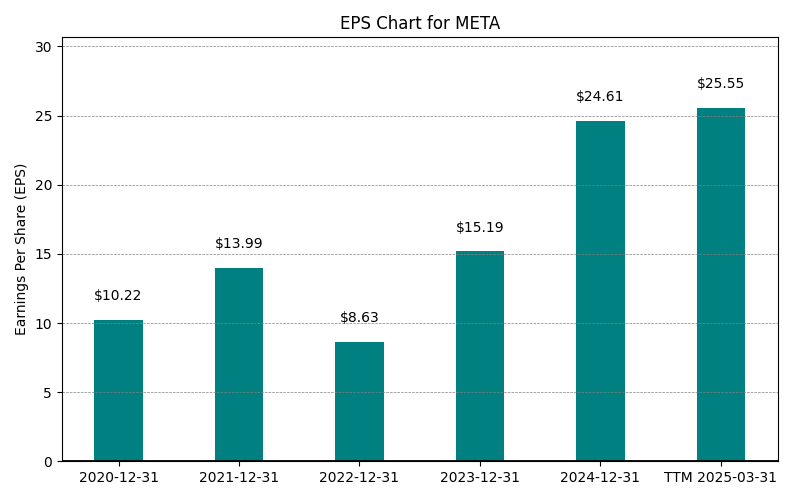
| 0 | 2020-12-31 | $85,965M | $29,146M | $10.22 | 2024-02-03 03:17:10 | N/A | N/A | N/A |
| 1 | 2021-12-31 | $116,609M | $23,200M | $13.99 | 2026-05-01 08:44:53 | 35.6% | -20.4% | 36.9% |
| 2 | 2022-12-31 | $116,609M | $23,200M | $8.63 | 2026-05-29 09:11:41 | 0.0% | 0.0% | -38.3% |
| 3 | 2023-12-31 | $134,902M | $39,098M | $15.19 | 2026-05-29 09:11:41 | 15.7% | 68.5% | 76.0% |
| 4 | 2024-12-31 | $164,501M | $62,360M | $24.61 | 2026-05-29 09:11:41 | 21.9% | 59.5% | 62.0% |
| 5 | 2025-12-31 | $200,966M | $60,458M | $23.98 | 2026-05-29 09:11:41 | 22.2% | -3.1% | -2.6% |
| 6 | TTM 2026-03-31 | $214,962M | $70,587M | $27.51 | 2026-05-01 08:44:54 | 7.0% | 16.8% | 14.7% |
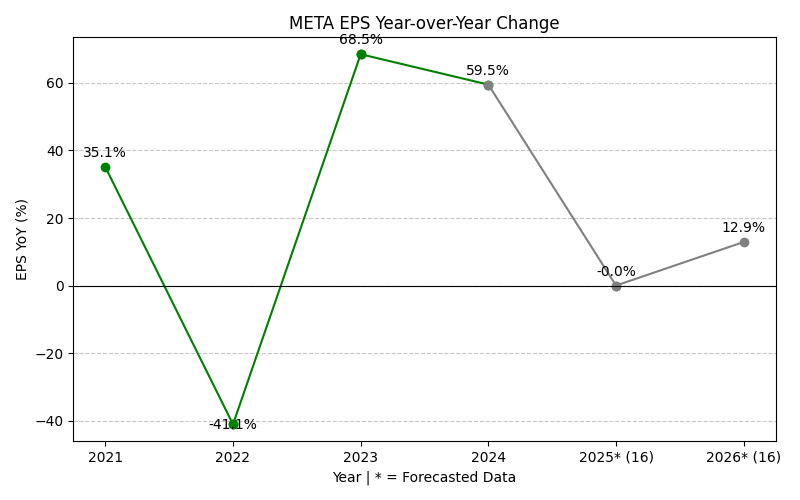
EPS
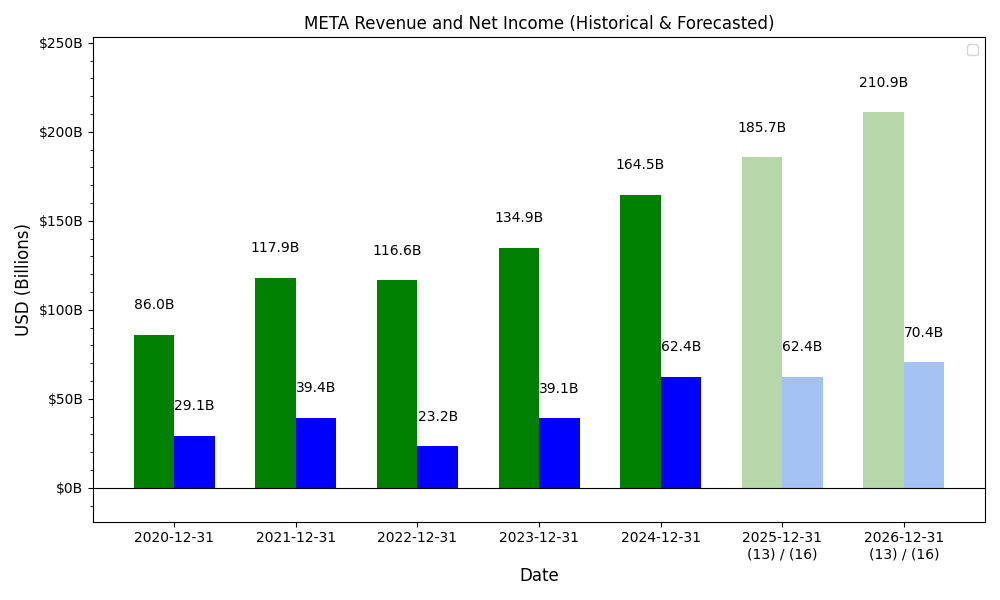
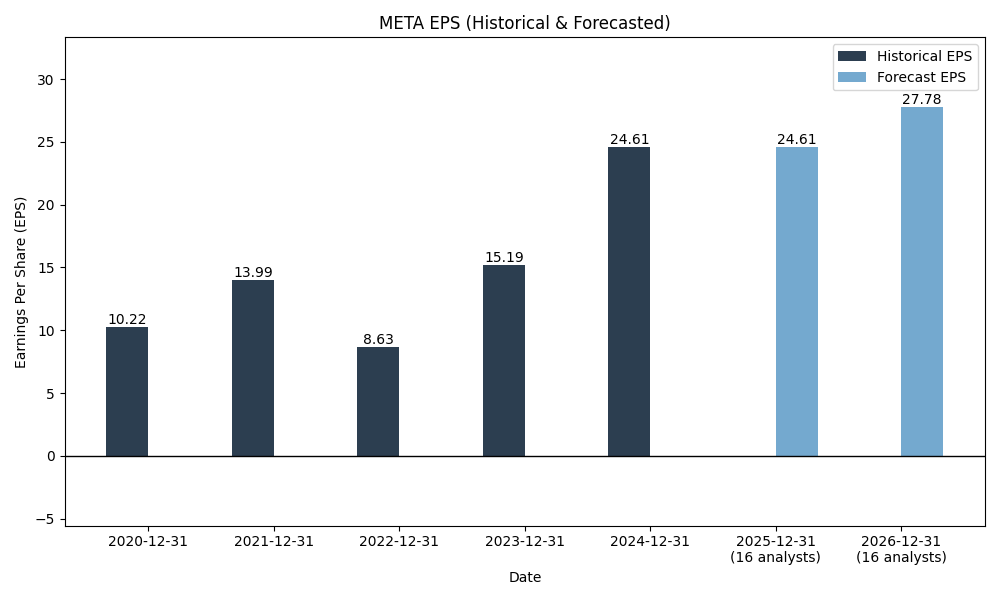
Forecasts
Y/Y % Change
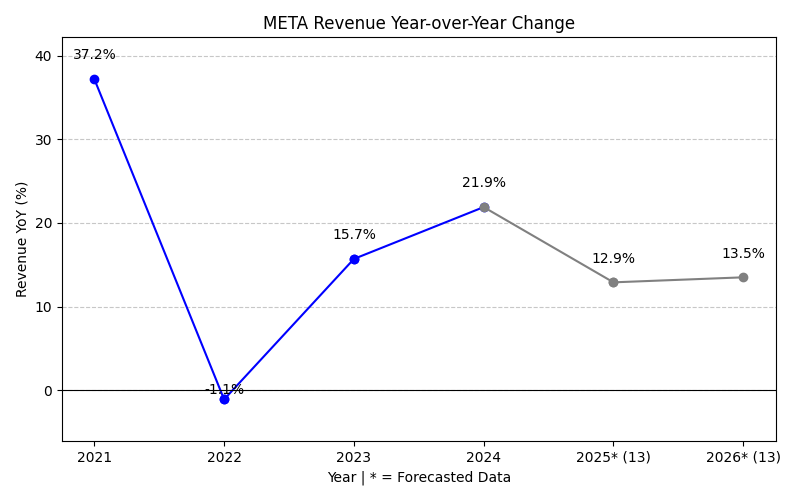
META Year-over-Year Growth
| 2020 | 2021 | 2022 | 2023 | 2024 | 2025 | 2026 | 2027 | Average | |
|---|---|---|---|---|---|---|---|---|---|
| Revenue Growth (%) | 35.6% | 0.0% | 15.7% | 21.9% | 22.2% | 26.0% | 19.3% | 20.1% | |
| Revenue Analysts (#) | 0 | 0 | 0 | 0 | 0 | 0 | 58 | 59 | |
| EPS Growth (%) | -20.4% | 0.0% | 68.5% | 59.5% | -3.1% | 38.0% | 5.8% | 21.2% | |
| EPS Analysts (#) | 0 | 0 | 0 | 0 | 0 | 0 | 53 | 53 |
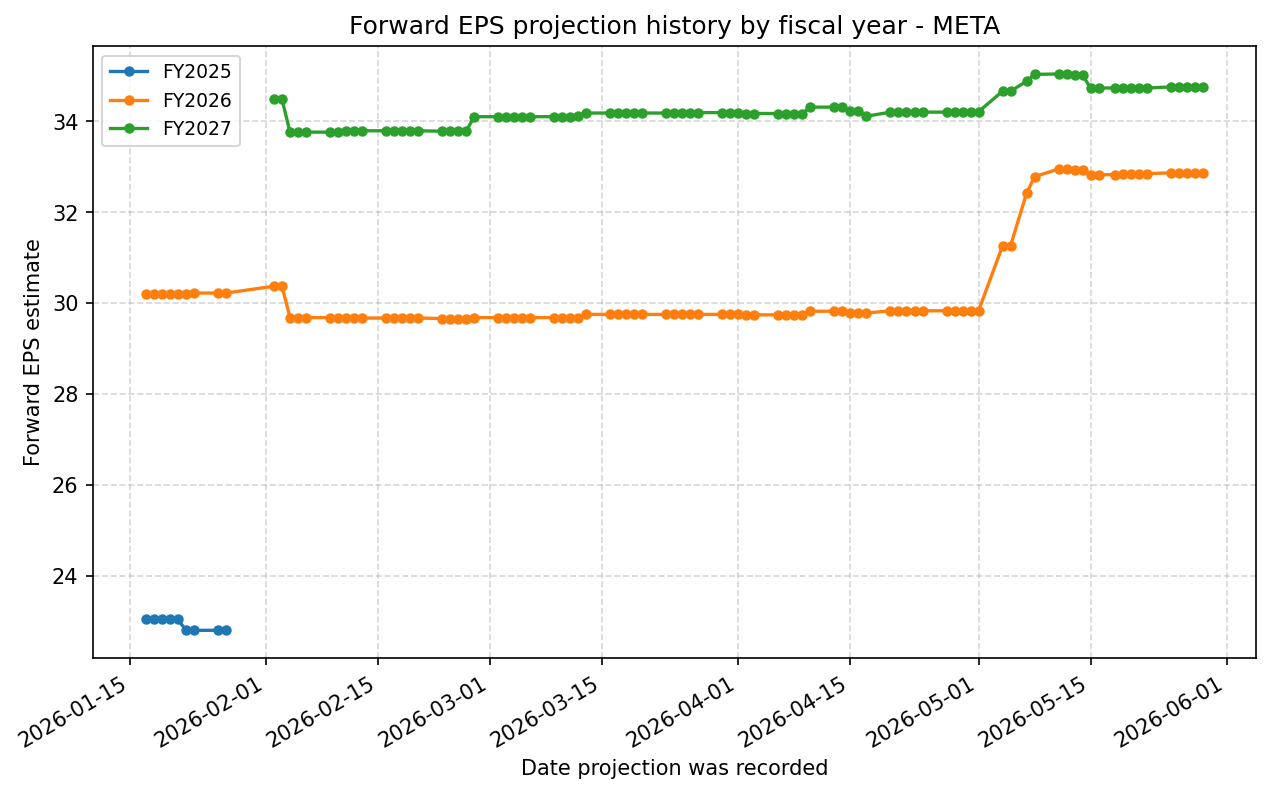
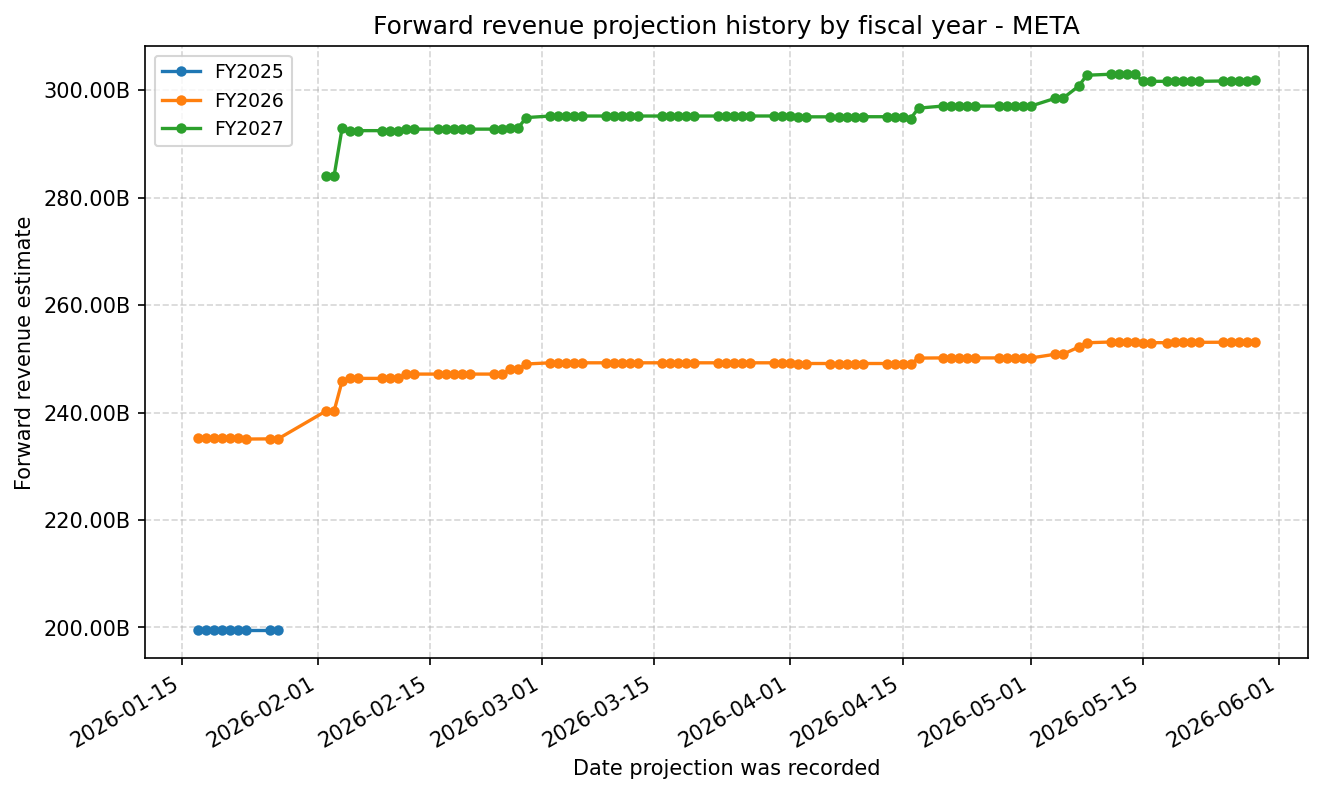
Forward Estimate History
How the next-FY EPS and revenue estimates have drifted over time. One line per fiscal year – past lines end when that FY became current.
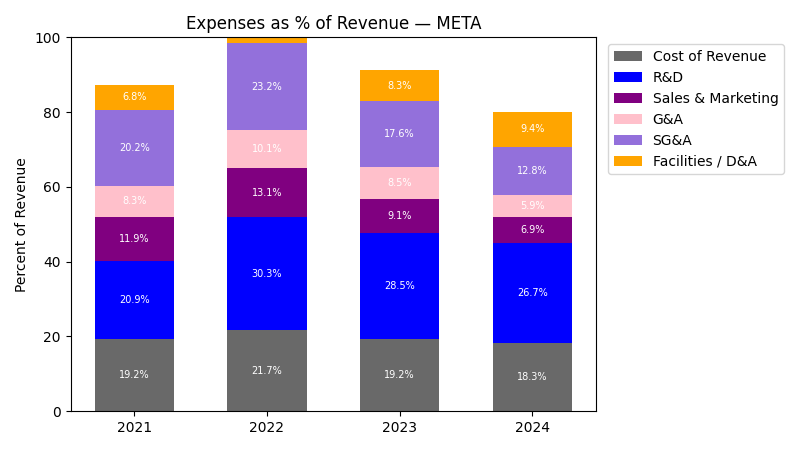
Expenses
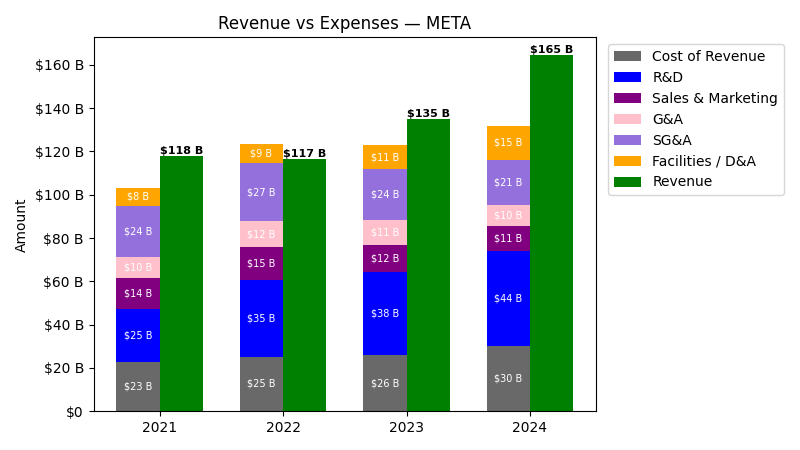
| Year | Revenue ($) | Cost of Revenue ($) | R&D ($) | Sales & Marketing ($) | G&A ($) | SG&A ($) | Facilities / D&A ($) |
|---|---|---|---|---|---|---|---|
| 2022 | $116.6B | $16.6B | $35.3B | $15.3B | $11.8B | $27.1B | $8.7B |
| 2023 | $134.9B | $14.8B | $38.5B | $12.3B | $11.4B | $23.7B | $11.2B |
| 2024 | $164.5B | $14.7B | $43.9B | $11.3B | $9.7B | $21.1B | $15.5B |
| 2025 | $201.0B | $17.6B | $57.4B | $12.0B | $12.2B | $24.1B | $18.6B |
| TTM | $215.0B | $18.1B | $62.9B | $12.1B | $12.5B | $24.6B | $20.7B |
| Year | Revenue Change (%) | Cost of Revenue Change (%) | R&D Change (%) | Sales & Marketing Change (%) | G&A Change (%) | SG&A Change (%) | Facilities / D&A Change (%) |
|---|---|---|---|---|---|---|---|
| 2023 | 15.69 | -10.76 | 8.90 | -19.40 | -3.45 | -12.44 | 28.69 |
| 2024 | 21.94 | -0.80 | 14.01 | -7.76 | -14.62 | -11.06 | 38.65 |
| 2025 | 22.17 | 19.75 | 30.77 | 5.68 | 24.76 | 14.49 | 20.12 |
| TTM | 6.96 | 3.12 | 9.67 | 1.26 | 2.75 | 2.01 | 11.28 |
No unmapped expenses.
Segment Performance
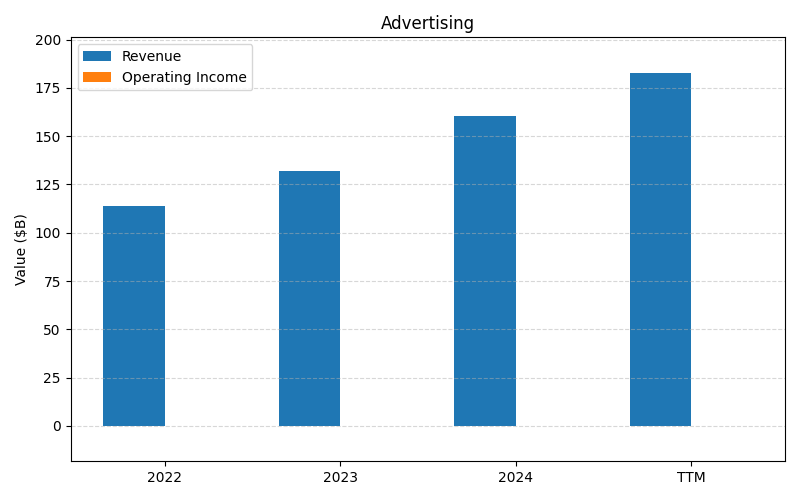
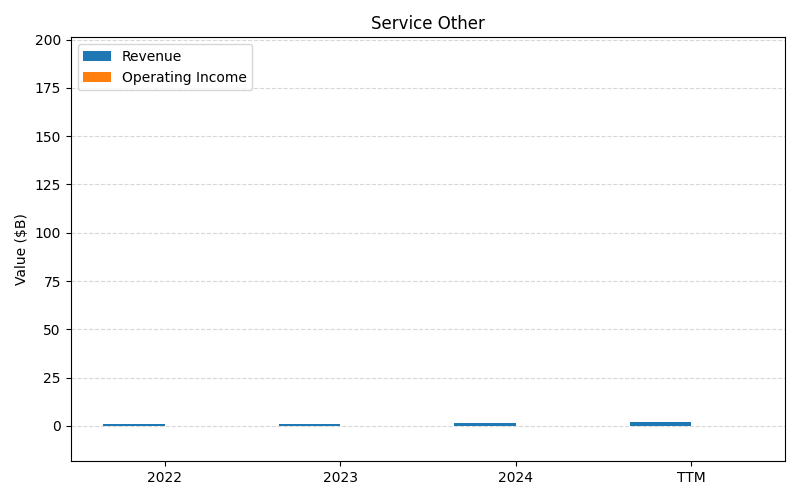
SEGMENTS v2025-09-09 · 2026-05-29 09:11 UTC — Units: $B. Rows list fiscal years (last 3 + TTM) with revenue for each segment; the final row shows the TTM revenue mix (operating income columns display “—” where mix is not applicable).
| Year | Advertising Rev | Service Other Rev | Total Rev |
|---|---|---|---|
| 2023 | 131.9B | 1.06B | 133B |
| 2024 | 160.6B | 1.72B | 162.4B |
| 2025 | 196.2B | 2.58B | 198.8B |
| TTM | 453.2B | 5.70B | 458.9B |
| % of Total (TTM) | 98.8% | 1.2% | 100% |
Segment Performance (Axis 2)
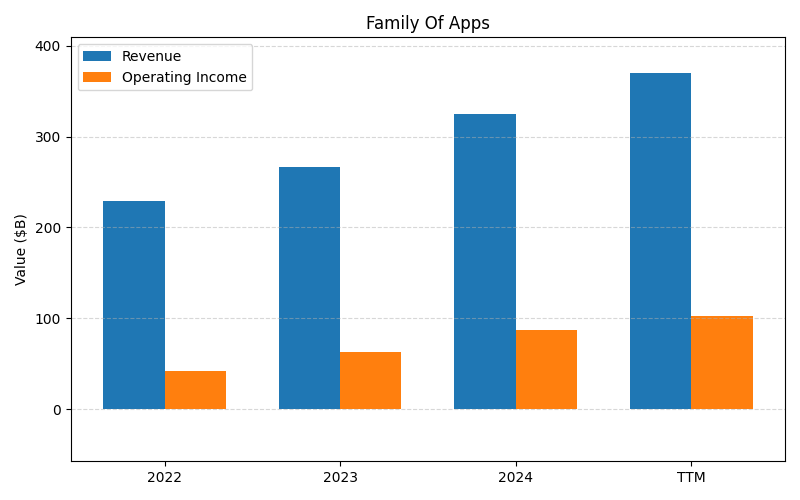
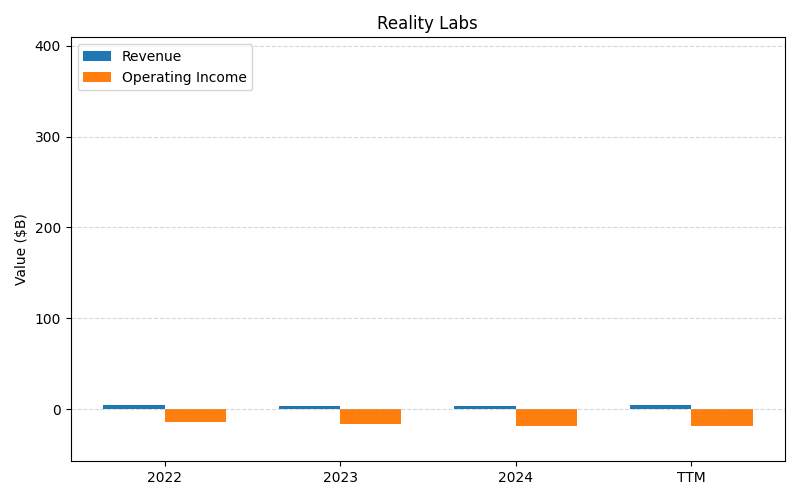
SEGMENTS v2025-09-09 · 2026-05-29 09:11 UTC — Units: $B. Rows list fiscal years (last 3 + TTM) with revenue and operating income for each segment; the final row shows the TTM revenue mix (operating income columns display “—” where mix is not applicable).
| Year | Family Of Apps Rev | Family Of Apps OI | Reality Labs Rev | Reality Labs OI | Total Rev | Total OI |
|---|---|---|---|---|---|---|
| 2023 | 266B | 62.9B | 3.79B | -16.1B | 269.8B | 46.8B |
| 2024 | 324.7B | 87.1B | 4.29B | -17.7B | 329B | 69.4B |
| 2025 | 397.5B | 102.5B | 4.41B | -19.2B | 401.9B | 83.3B |
| TTM | 917.9B | 238.2B | 10.3B | -45.2B | 928.2B | 193.1B |
| % of Total (TTM) | 98.9% | — | 1.1% | — | 100% | — |
Balance Sheet
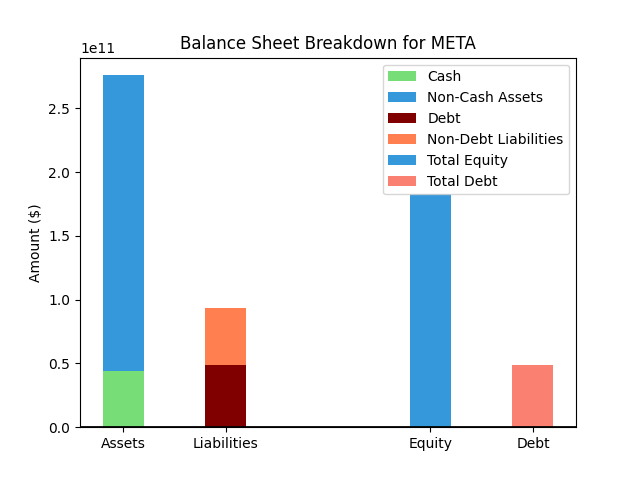
| Metric | Value | |
|---|---|---|
| 0 | Total Assets | $395,250M |
| 1 | Cash | $23,426M |
| 2 | Total Liabilities | $151,569M |
| 3 | Total Debt | $86,769M |
| 4 | Total Equity | $243,681M |
| 5 | Debt to Equity Ratio | 0.36 |
EPS & Dividend
Valuation
| Share Price | Treasury Yield | Estimates | Fair Value (P/E) | Fair Value (P/S) | Current P/S | Current P/E |
|---|---|---|---|---|---|---|
| $632.51 | 4.5% | Nicks Growth: 6% Nick's Expected Margin: 30% FINVIZ Growth: 19% |
Nicks: 12 Finviz: 40 |
Nick's: 3.498 | 7.5 | 23.0 |
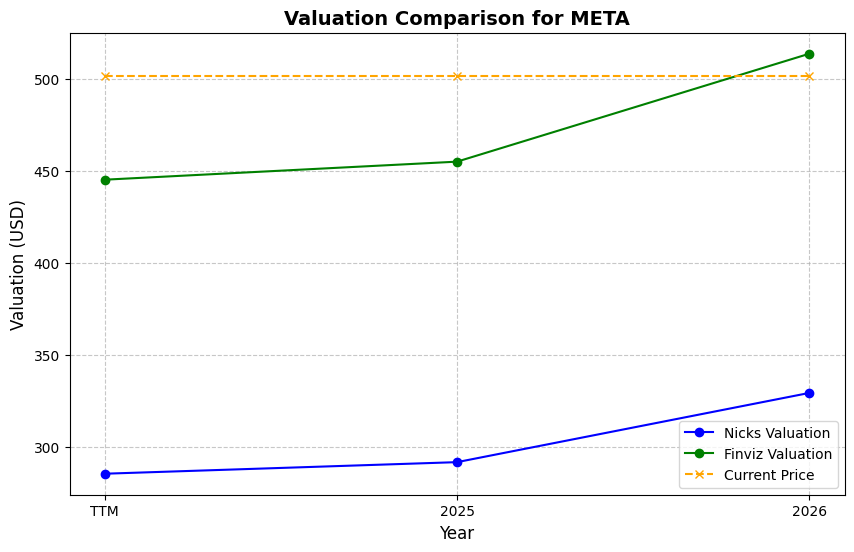
| Basis | Year | Nicks Valuation | Nicks vs Share Price | Finviz Valuation | Finviz vs Share Price |
|---|---|---|---|---|---|
| $27.51 EPS | TTM | $320.75 | -49.3% | $1111.68 | 75.8% |
| $32.86 EPS | 2026 | $383.18 | -39.4% | $1328.05 | 110.0% |
| $34.75 EPS | 2027 | $405.21 | -35.9% | $1404.42 | 122.0% |
Implied Growth
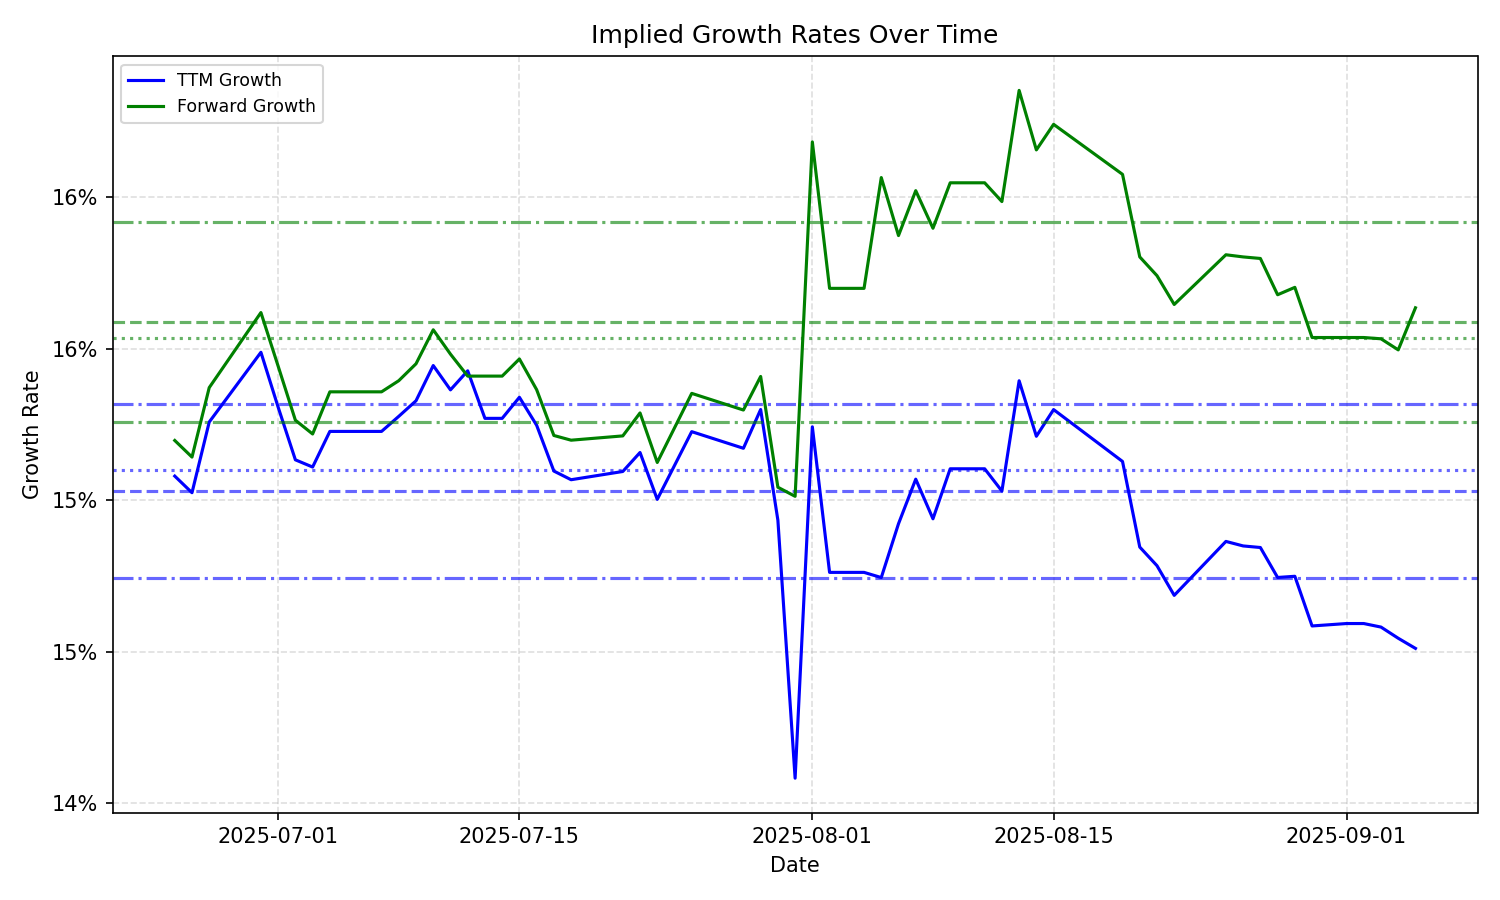
| Average | Median | Std Dev | Current | Percentile | ||||||
|---|---|---|---|---|---|---|---|---|---|---|
| TTM | Forward | TTM | Forward | TTM | Forward | TTM | Forward | TTM | Forward | |
| Timeframe | ||||||||||
| 1 Year | 14.64% | 13.01% | 14.81% | 13.39% | 0.75% | 2.44% | 13.18% | 10.25% | 9.1% | 22.3% |
| 3 Years | 14.64% | 13.01% | 14.81% | 13.39% | 0.75% | 2.44% | 13.18% | 10.25% | 9.1% | 22.3% |
| 5 Years | 14.64% | 13.01% | 14.81% | 13.39% | 0.75% | 2.44% | 13.18% | 10.25% | 9.1% | 22.3% |
| 10 Years | 14.64% | 13.01% | 14.81% | 13.39% | 0.75% | 2.44% | 13.18% | 10.25% | 9.1% | 22.3% |