Mastercard Incorporated — MA
| Close Price | Market Cap | P/E Ratio | Forward P/E Ratio | Implied Growth* | Implied Forward Growth* | Dividend | P/B Ratio |
|---|---|---|---|---|---|---|---|
| $493.98 | $436.47B | 28.6 | 21.7 | 15.5% | 12.5% | $3.48 0.7% | 65.2 |
Latest Headlines
- · Weekly Wrap: Crypto Prices Breakdown As Bitcoin Falls In May
- · Crypto Card Payment Volumes More Than Double In A Year, Growth Surges Since Stablecoin Act Passage
- · Payments Stocks in the Stablecoin Era: 3 to Buy and 1 to Avoid
- · SoFi Technologies Surges 12% on Stablecoin Launch; Robinhood, Upstart Extend Fintech Bounce
- · AI-driven scam stores put retailers on alert
- · How Is Mastercard's Stock Performance Compared to Other FinTech Stocks?
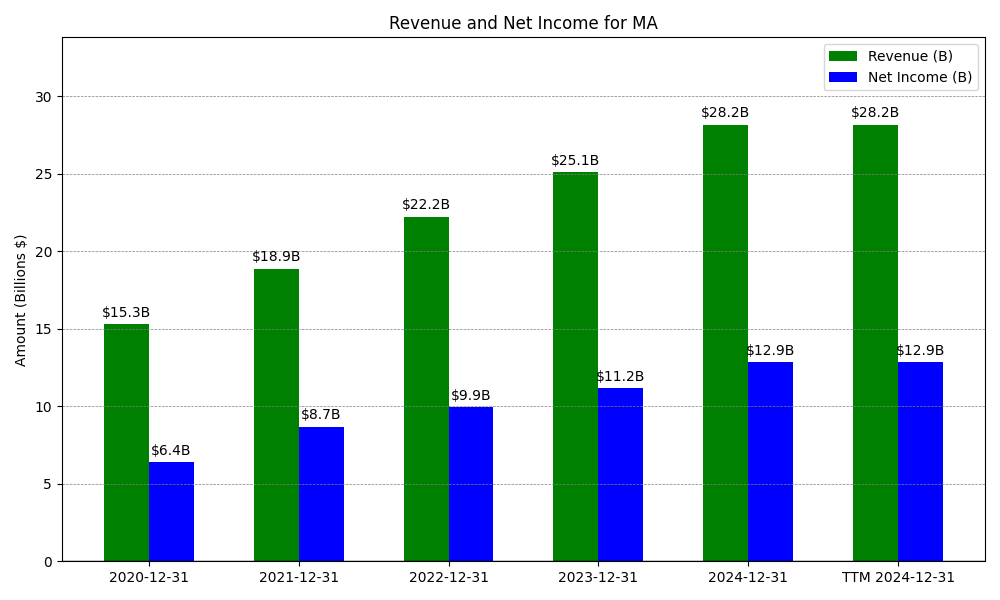
Revenue & Net Income
| Date | Revenue | Net_Income | EPS | Last_Updated | Revenue_Change | Net_Income_Change | EPS_Change | |
|---|---|---|---|---|---|---|---|---|
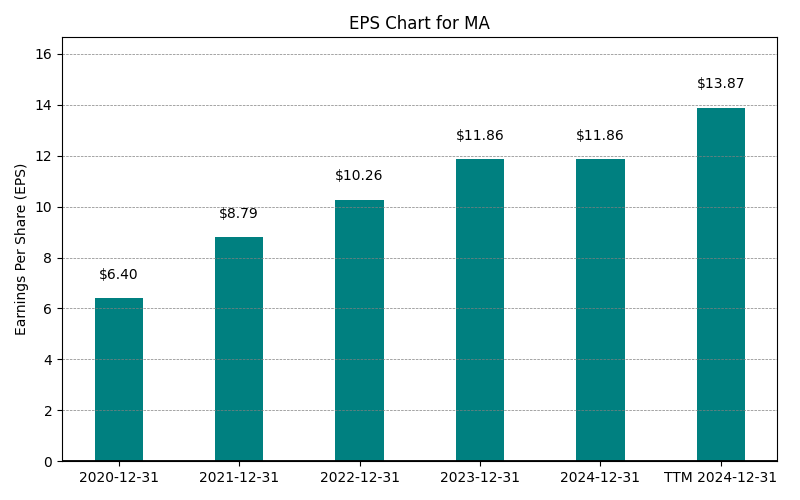
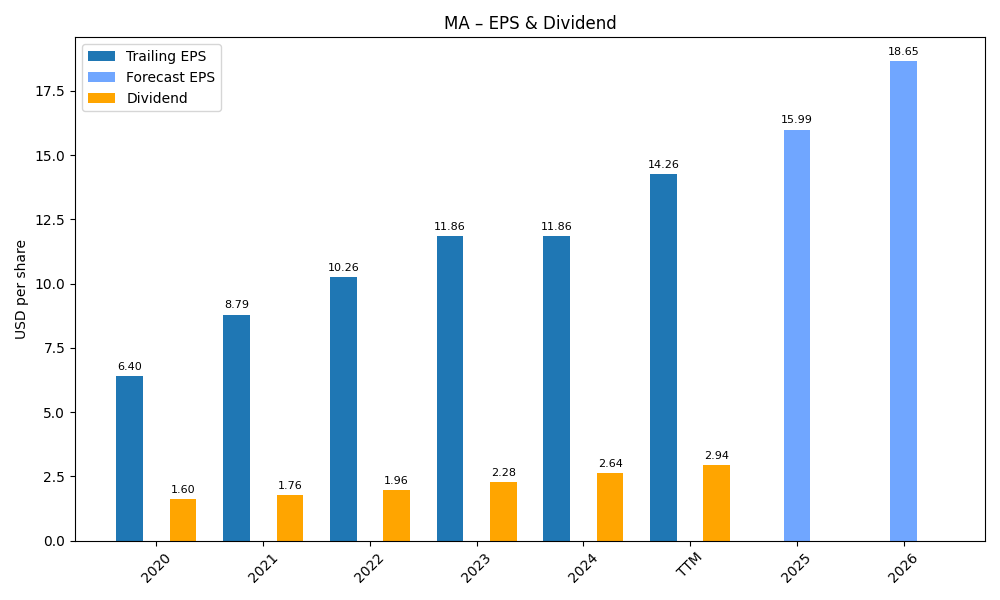
| 0 | 2020-12-31 | $15,301M | $6,411M | $6.40 | 2024-02-03 03:17:10 | N/A | N/A | N/A |
| 1 | 2021-12-31 | $18,884M | $8,687M | $8.79 | 2026-02-13 08:40:59 | 23.4% | 35.5% | 37.3% |
| 2 | 2022-12-31 | $22,237M | $9,930M | $10.26 | 2026-05-29 09:11:08 | 17.8% | 14.3% | 16.7% |
| 3 | 2023-12-31 | $25,098M | $11,195M | $11.86 | 2026-05-29 09:11:08 | 12.9% | 12.7% | 15.6% |
| 4 | 2024-12-31 | $28,167M | $12,874M | $13.91 | 2026-05-29 09:11:08 | 12.2% | 15.0% | 17.3% |
| 5 | 2025-12-31 | $32,791M | $14,968M | $16.54 | 2026-05-29 09:11:08 | 16.4% | 16.3% | 18.9% |
| 6 | TTM 2026-03-31 | $33,939M | $15,570M | $17.28 | 2026-05-04 08:55:48 | 3.5% | 4.0% | 4.5% |
EPS
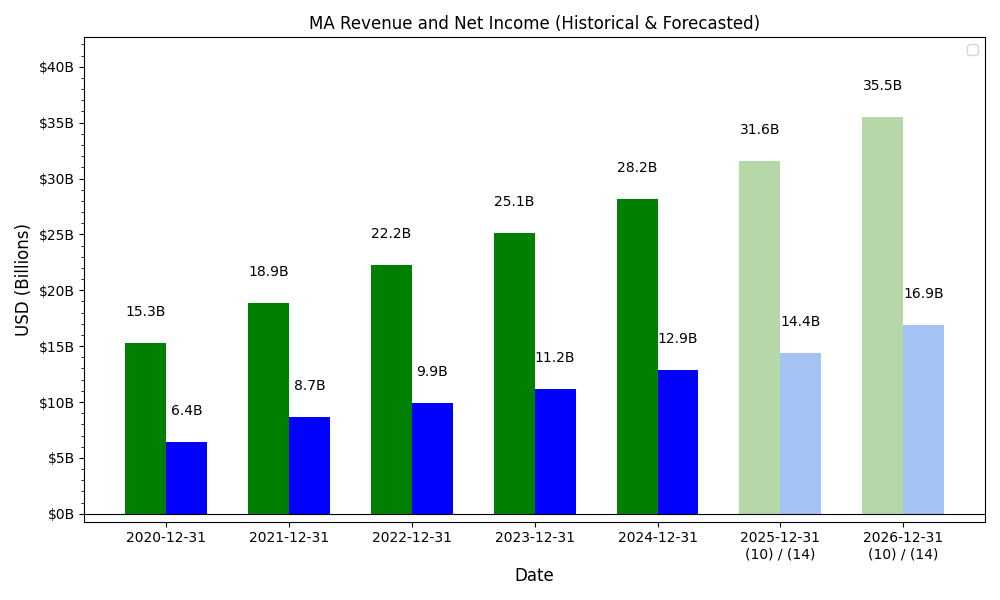
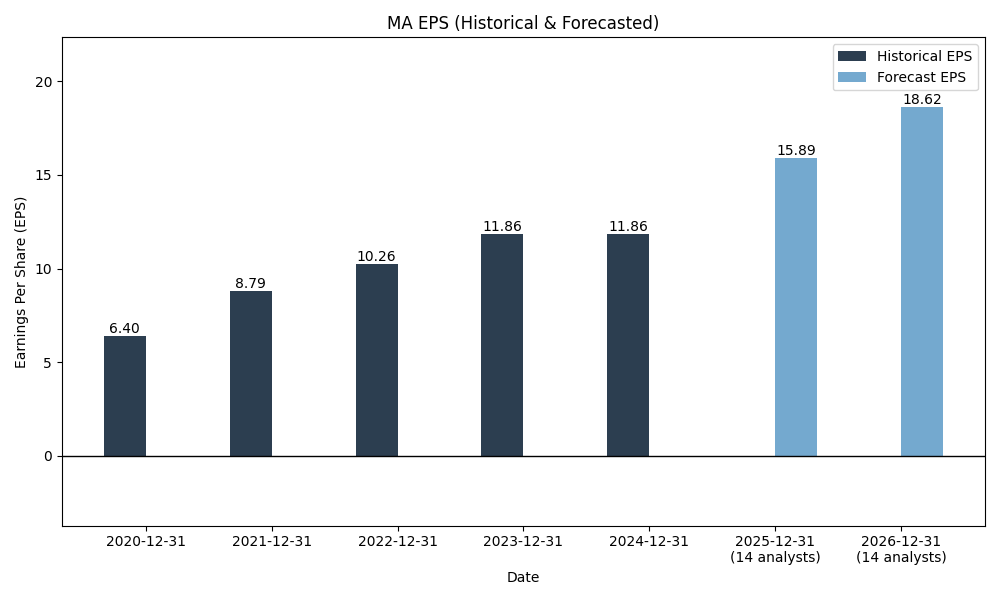
Forecasts
Y/Y % Change
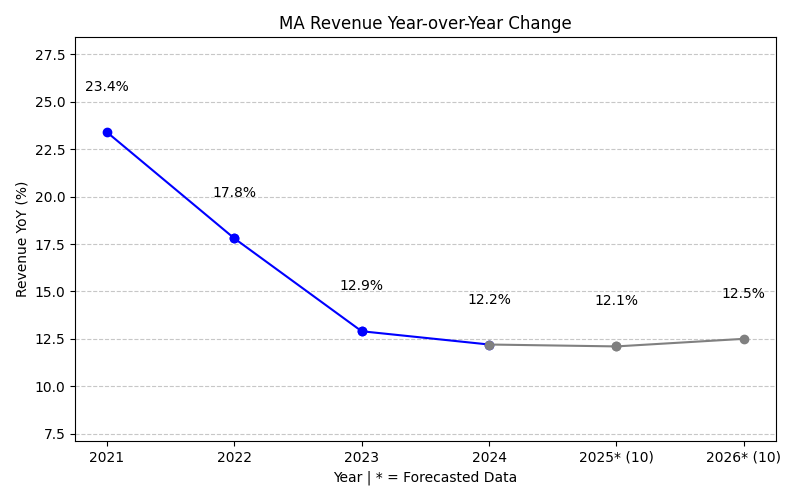
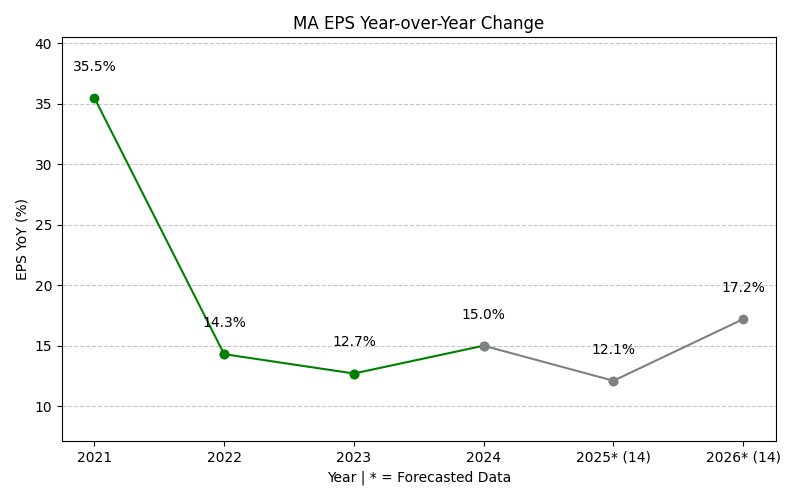
MA Year-over-Year Growth
| 2020 | 2021 | 2022 | 2023 | 2024 | 2025 | 2026 | 2027 | Average | |
|---|---|---|---|---|---|---|---|---|---|
| Revenue Growth (%) | 23.4% | 17.8% | 12.9% | 12.2% | 16.4% | 13.0% | 12.5% | 15.5% | |
| Revenue Analysts (#) | 0 | 0 | 0 | 0 | 0 | 0 | 36 | 36 | |
| EPS Growth (%) | 35.5% | 14.3% | 12.7% | 15.0% | 16.3% | 16.0% | 15.9% | 18.0% | |
| EPS Analysts (#) | 0 | 0 | 0 | 0 | 0 | 0 | 37 | 37 |
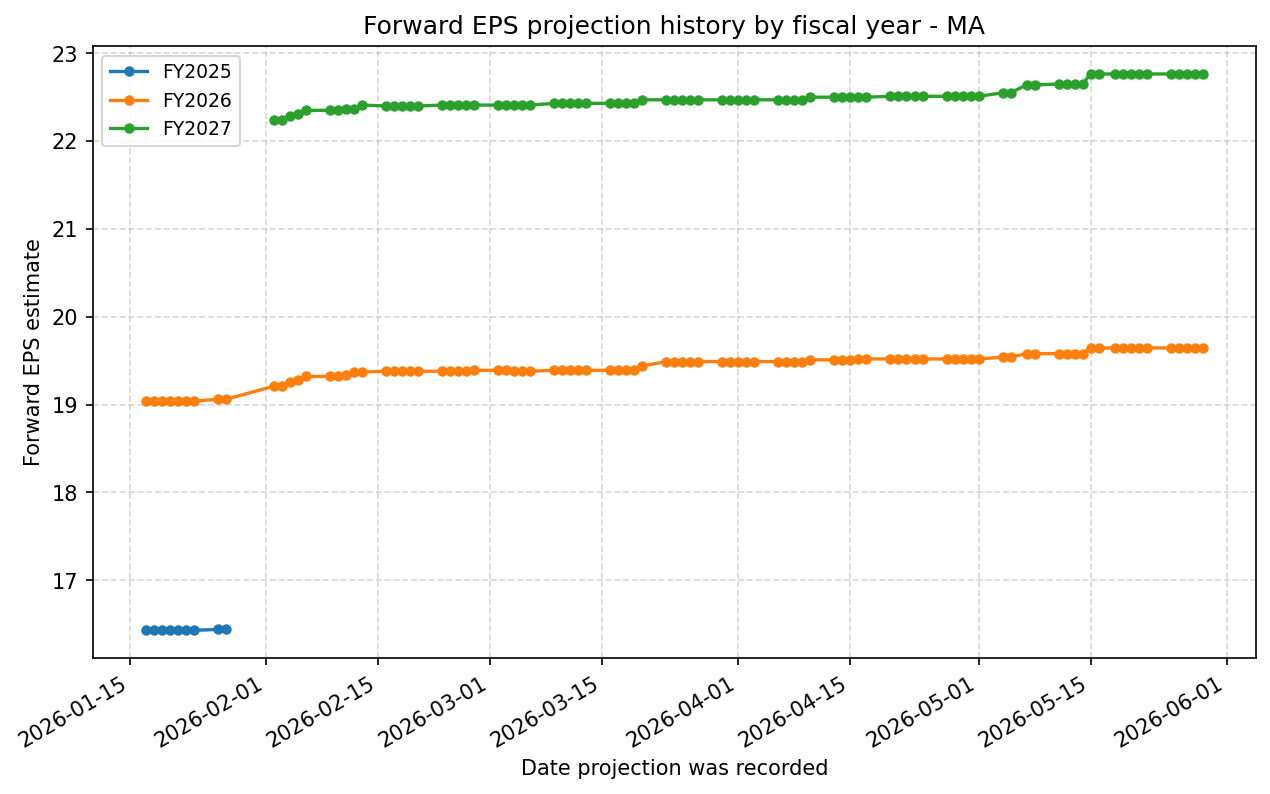
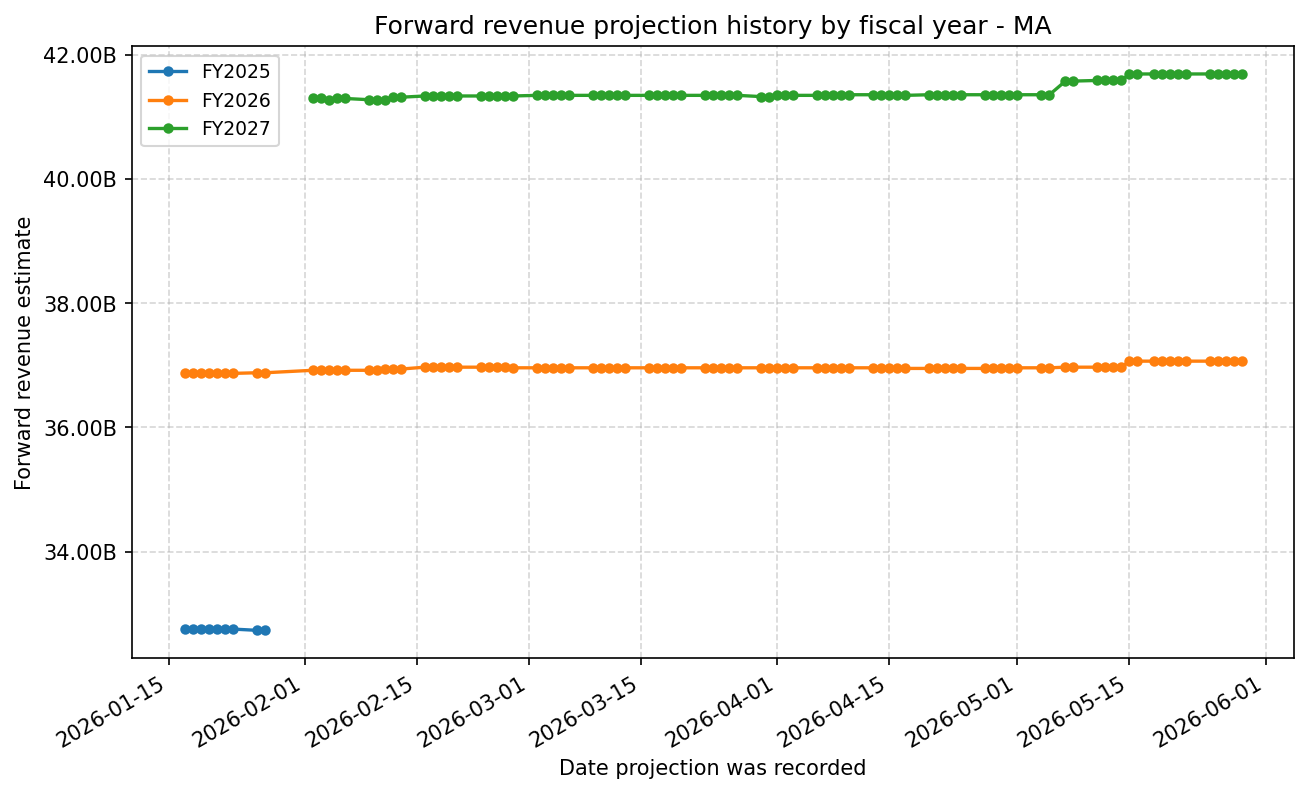
Forward Estimate History
How the next-FY EPS and revenue estimates have drifted over time. One line per fiscal year – past lines end when that FY became current.
Expenses
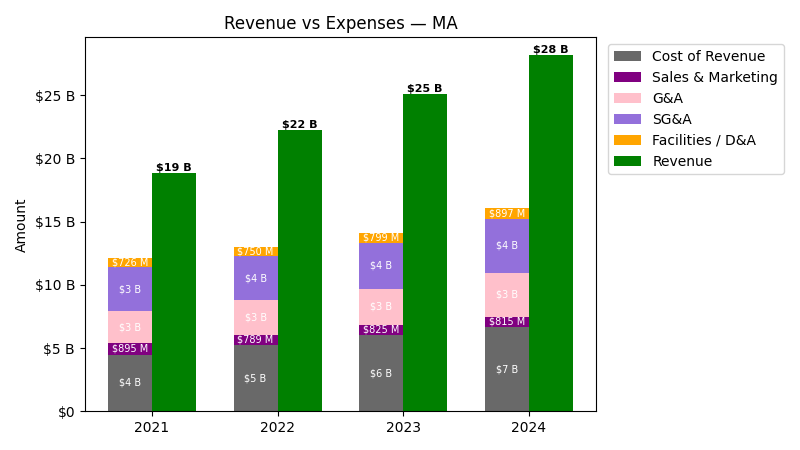
| Year | Revenue ($) | Cost of Revenue ($) | Sales & Marketing ($) | G&A ($) | SG&A ($) | Facilities / D&A ($) |
|---|---|---|---|---|---|---|
| 2021 | $18.9B | $3.8B | $895.0M | $2.5B | $3.4B | $726.0M |
| 2022 | $22.2B | $4.5B | $789.0M | $2.7B | $3.5B | $750.0M |
| 2023 | $25.1B | $5.2B | $825.0M | $2.8B | $3.6B | $799.0M |
| 2024 | $28.2B | $5.8B | $815.0M | $3.5B | $4.3B | $897.0M |
| 2025 | $32.8B | $6.1B | $929.0M | $4.0B | $4.9B | $1.1B |
| TTM | $33.9B | $6.4B | $930.0M | $4.1B | $5.0B | $1.2B |
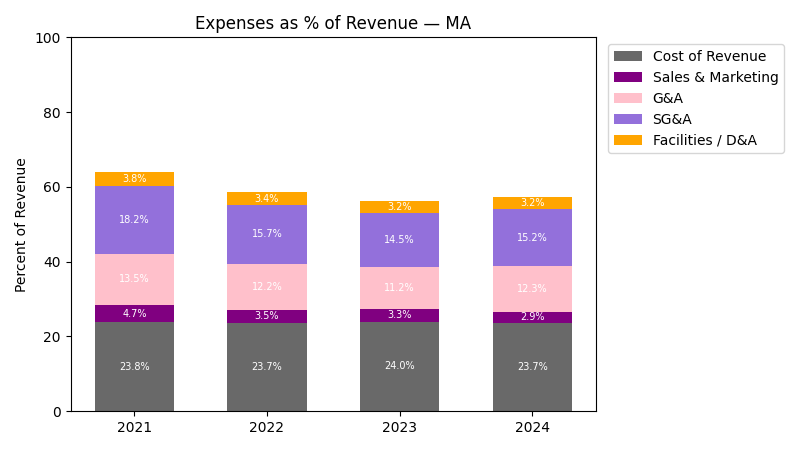
| Year | Revenue Change (%) | Cost of Revenue Change (%) | Sales & Marketing Change (%) | G&A Change (%) | SG&A Change (%) | Facilities / D&A Change (%) |
|---|---|---|---|---|---|---|
| 2022 | 17.76 | 19.93 | -11.84 | 6.52 | 1.74 | 3.31 |
| 2023 | 12.87 | 15.73 | 4.56 | 4.02 | 4.14 | 6.53 |
| 2024 | 12.23 | 10.59 | -1.21 | 22.43 | 17.08 | 12.27 |
| 2025 | 16.42 | 5.75 | 13.99 | 14.44 | 14.36 | 27.42 |
| TTM | 3.50 | 5.32 | 0.11 | 2.78 | 2.27 | 2.10 |
No unmapped expenses.
Segment Performance
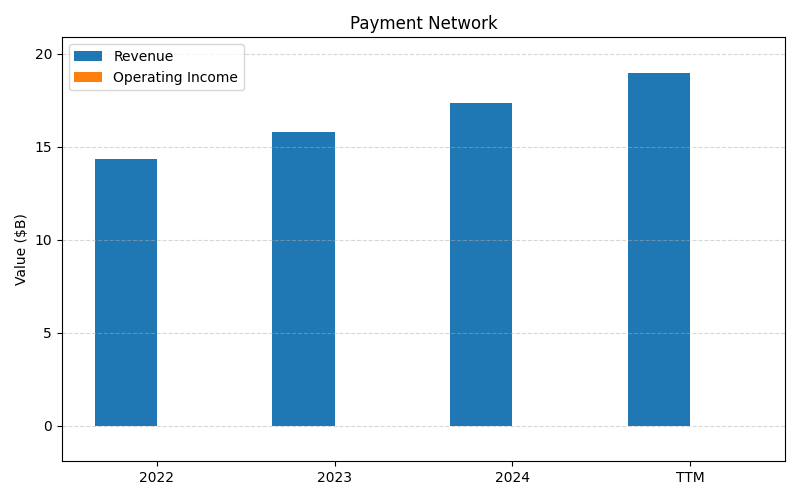
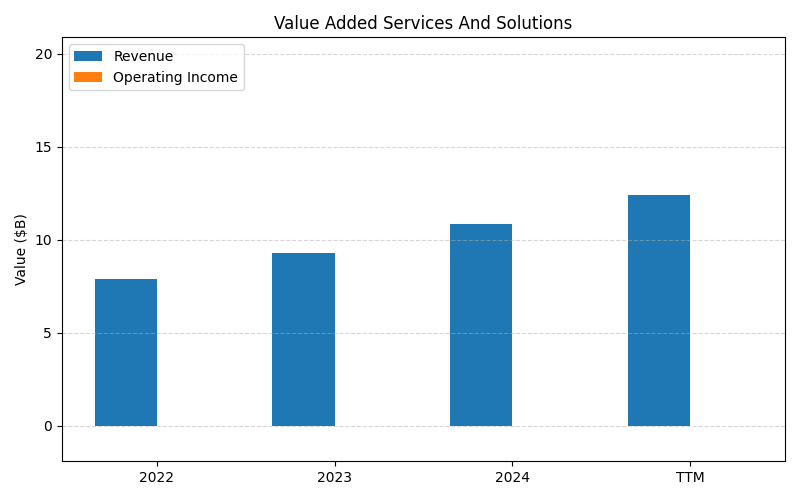
SEGMENTS v2025-09-09 · 2026-05-29 09:11 UTC — Units: $B. Rows list fiscal years (last 3 + TTM) with revenue for each segment; the final row shows the TTM revenue mix (operating income columns display “—” where mix is not applicable).
| Year | Payment Network Rev | Value Added Services And Solutions Rev | Total Rev |
|---|---|---|---|
| 2023 | 15.8B | 9.27B | 25.1B |
| 2024 | 17.3B | 10.8B | 28.2B |
| 2025 | 19.5B | 13.3B | 32.8B |
| TTM | 46.2B | 30.4B | 76.6B |
| % of Total (TTM) | 60.3% | 39.7% | 100% |
Balance Sheet
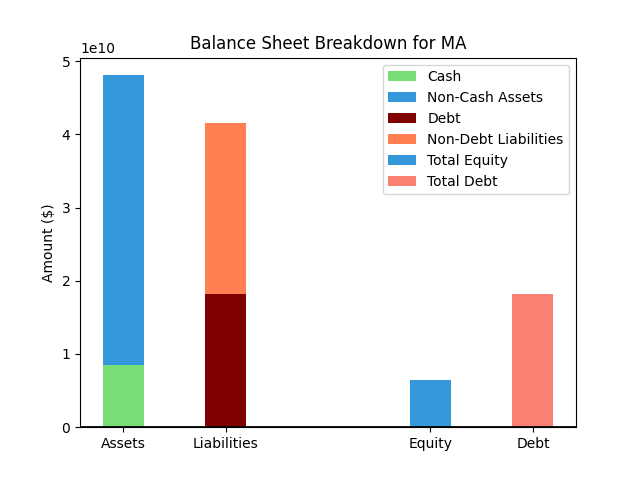
| Metric | Value | |
|---|---|---|
| 0 | Total Assets | $52,449M |
| 1 | Cash | $7,906M |
| 2 | Total Liabilities | $45,727M |
| 3 | Total Debt | $18,960M |
| 4 | Total Equity | $6,719M |
| 5 | Debt to Equity Ratio | 2.82 |
EPS & Dividend
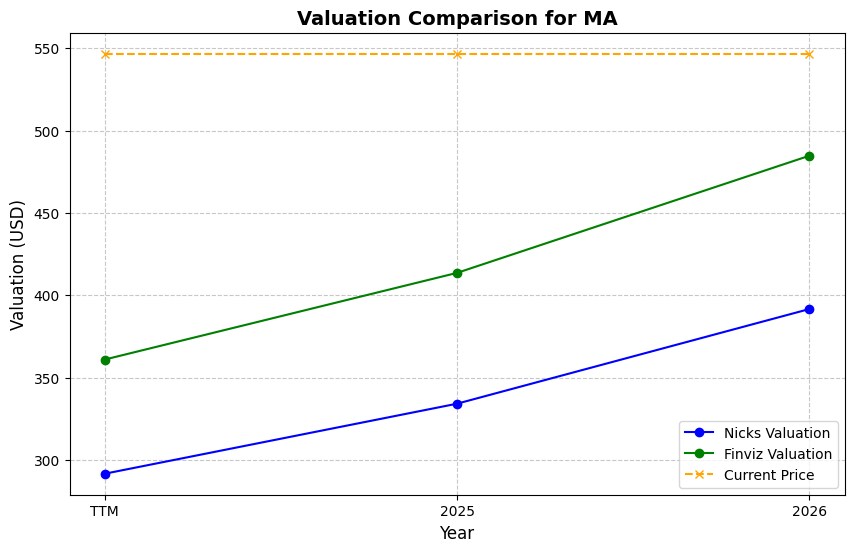
Valuation
| Share Price | Treasury Yield | Estimates | Fair Value (P/E) | Fair Value (P/S) | Current P/S | Current P/E |
|---|---|---|---|---|---|---|
| $493.98 | 4.5% | Nicks Growth: 12% Nick's Expected Margin: 45% FINVIZ Growth: 16% |
Nicks: 21 Finviz: 29 |
Nick's: 9.315 | 12.9 | 28.6 |
| Basis | Year | Nicks Valuation | Nicks vs Share Price | Finviz Valuation | Finviz vs Share Price |
|---|---|---|---|---|---|
| $17.28 EPS | TTM | $357.71 | -27.6% | $508.94 | 3.0% |
| $19.65 EPS | 2026 | $406.67 | -17.7% | $578.61 | 17.1% |
| $22.76 EPS | 2027 | $471.24 | -4.6% | $670.48 | 35.7% |
Implied Growth
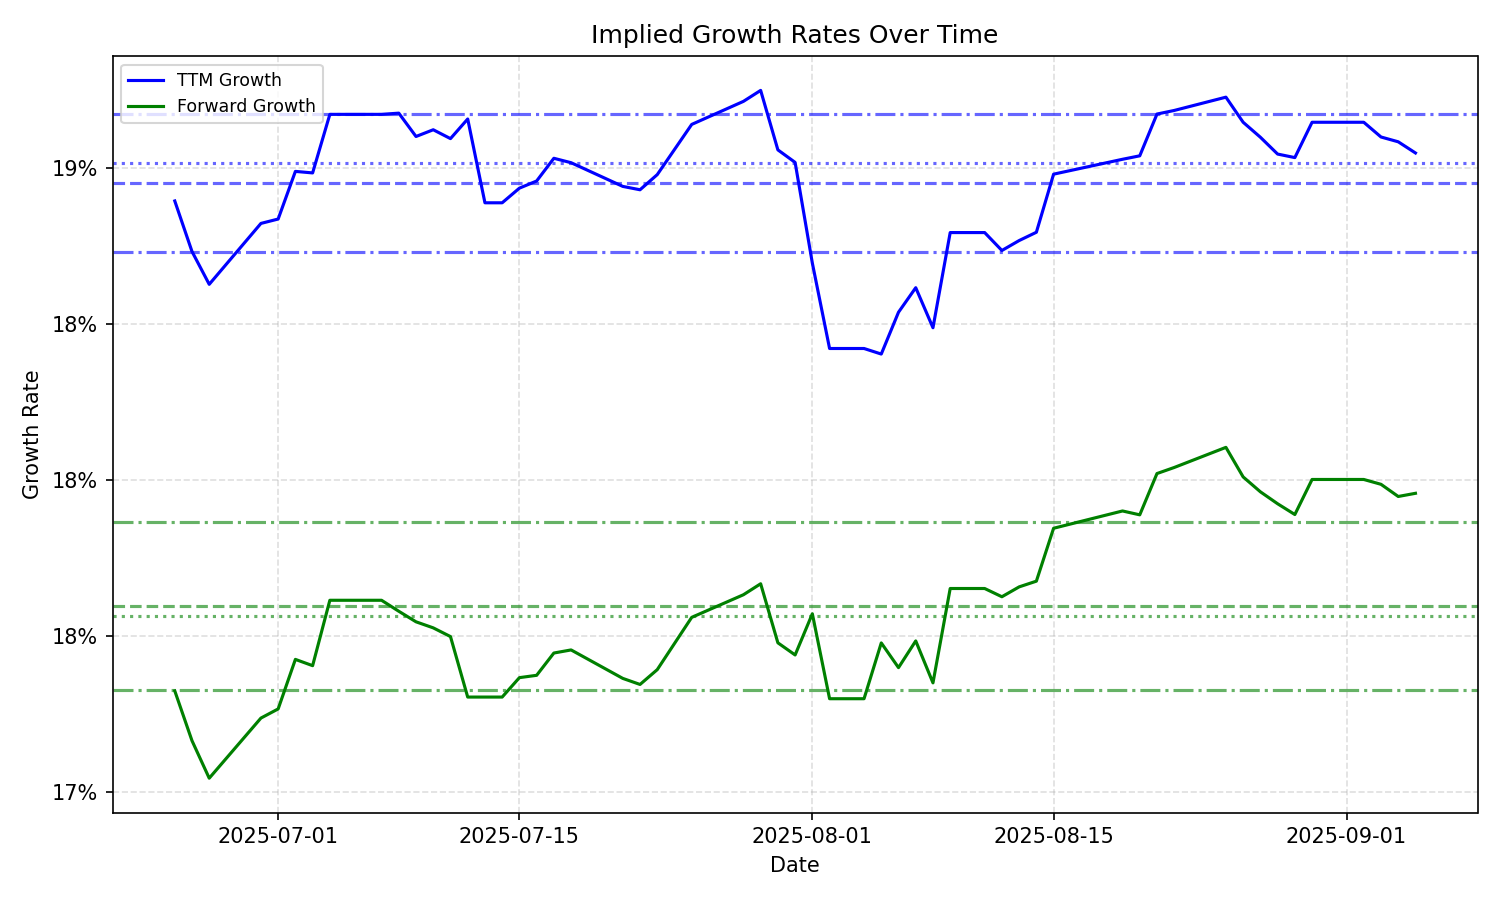
| Average | Median | Std Dev | Current | Percentile | ||||||
|---|---|---|---|---|---|---|---|---|---|---|
| TTM | Forward | TTM | Forward | TTM | Forward | TTM | Forward | TTM | Forward | |
| Timeframe | ||||||||||
| 1 Year | 17.58% | 15.61% | 17.70% | 16.83% | 1.23% | 2.15% | 15.52% | 12.50% | 2.5% | 7.3% |
| 3 Years | 17.58% | 15.61% | 17.70% | 16.83% | 1.23% | 2.15% | 15.52% | 12.50% | 2.5% | 7.3% |
| 5 Years | 17.58% | 15.61% | 17.70% | 16.83% | 1.23% | 2.15% | 15.52% | 12.50% | 2.5% | 7.3% |
| 10 Years | 17.58% | 15.61% | 17.70% | 16.83% | 1.23% | 2.15% | 15.52% | 12.50% | 2.5% | 7.3% |