Mama's Creations, Inc. — MAMA
| Close Price | Market Cap | P/E Ratio | Forward P/E Ratio | Implied Growth* | Implied Forward Growth* | Dividend | P/B Ratio |
|---|---|---|---|---|---|---|---|
| $13.80 | $561.76M | 106.2 | 46.0 | 31.1% | 20.9% | - | 10.7 |
Latest Headlines
- · MAMA Stock: The One-Stop-Shop Deli Strategy Could Be a 2027 Theme
- · MAMA Stock: Buy, Hold, or Watch? A Risk-Reward Checklist
- · MAMA Stock: What Is Driving Mama's Creations Growth in 2026?
- · Mama’s Creations to Host First Quarter Fiscal 2027 Earnings Call on June 8 at 4:30 p.m. Eastern Time
- · Three Companies Priced Below Estimated Value In May 2026
- · Two Small-Cap Stocks Under $15 For Retail Investors
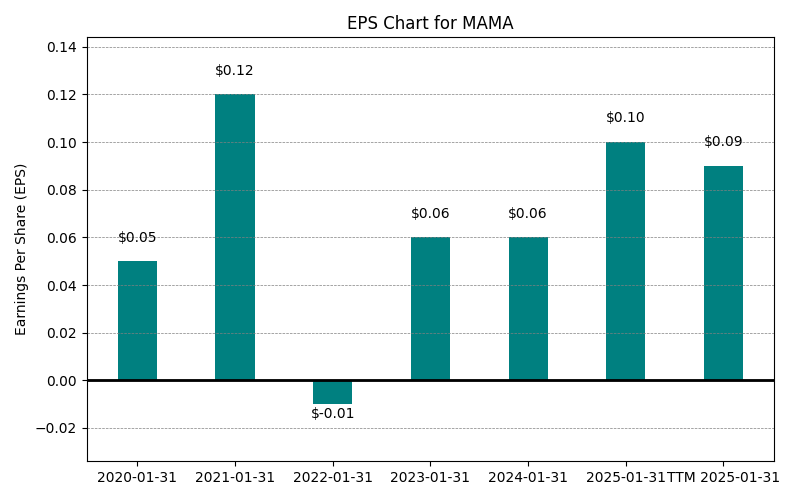
Revenue & Net Income
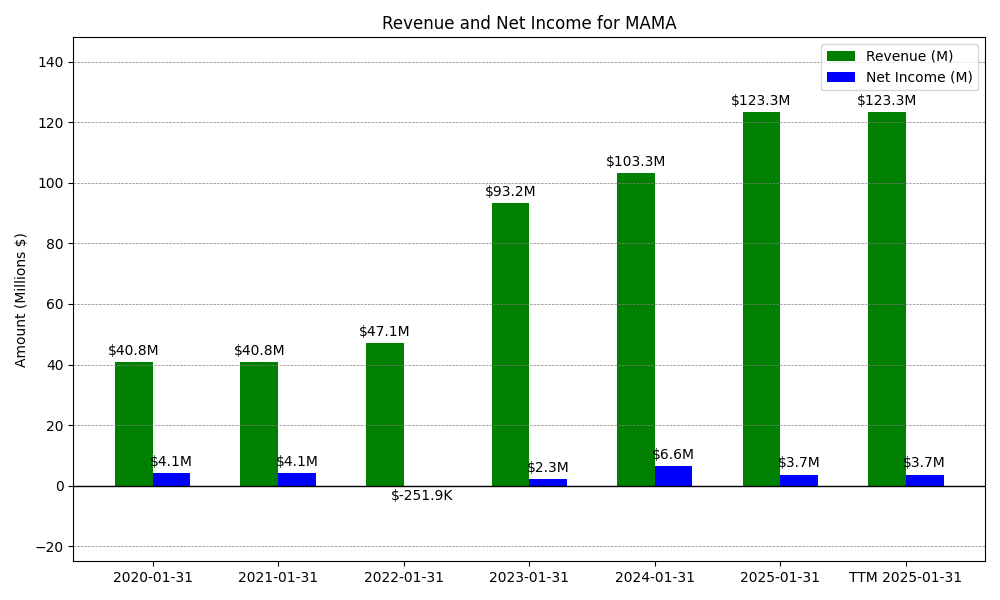
| Date | Revenue | Net_Income | EPS | Last_Updated | Revenue_Change | Net_Income_Change | EPS_Change | |
|---|---|---|---|---|---|---|---|---|
| 0 | 2020-01-31 | $41M | $4M | $0.05 | 2024-05-25 13:11:34 | N/A | N/A | N/A |
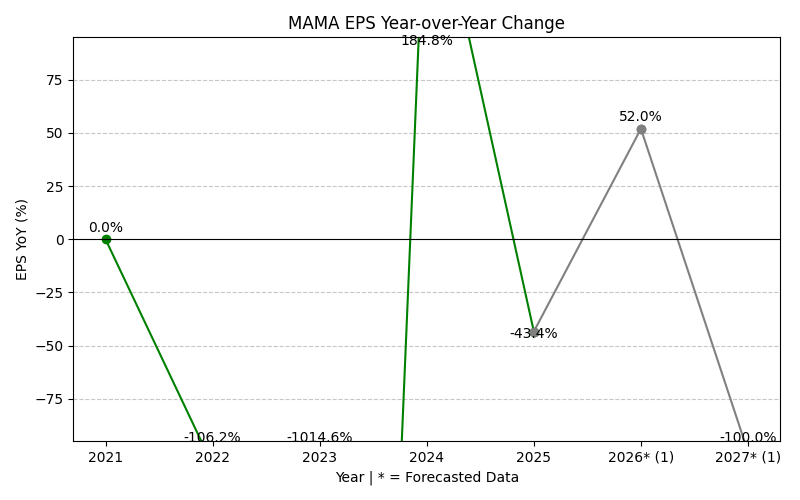
| 1 | 2021-01-31 | $41M | $4M | $0.12 | 2024-04-27 14:48:59 | 0.0% | 0.0% | 140.0% |
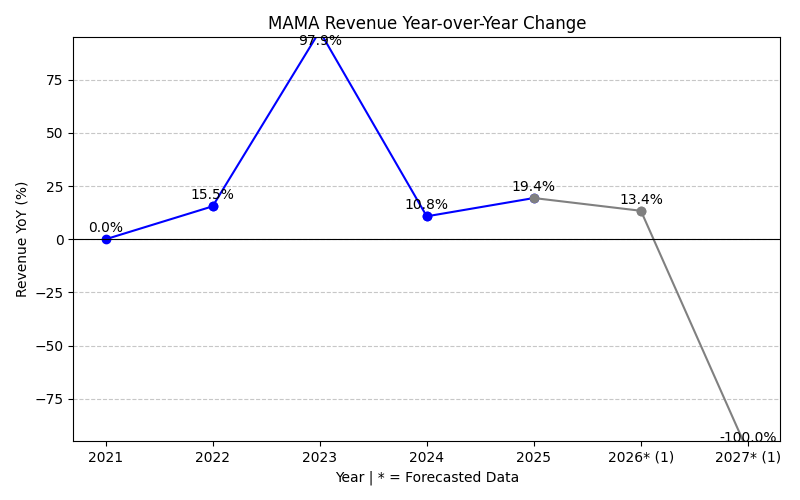
| 2 | 2022-01-31 | $47M | $-0M | $-0.01 | 2026-04-15 08:39:12 | 15.5% | -106.2% | -108.3% |
| 3 | 2023-01-31 | $93M | $2M | $0.06 | 2026-05-29 09:11:15 | 97.9% | -1014.6% | -700.0% |
| 4 | 2024-01-31 | $103M | $7M | $0.18 | 2026-05-29 09:11:15 | 10.8% | 184.8% | 200.0% |
| 5 | 2025-01-31 | $123M | $4M | $0.10 | 2026-05-29 09:11:15 | 19.4% | -43.4% | -44.4% |
| 6 | 2026-01-31 | $172M | $5M | $0.14 | 2026-05-29 09:11:15 | 39.2% | 42.4% | 40.0% |
| 7 | TTM 2026-01-31 | $172M | $5M | $0.13 | 2026-04-16 08:39:18 | 0.0% | 0.0% | -7.1% |
EPS
Forecasts
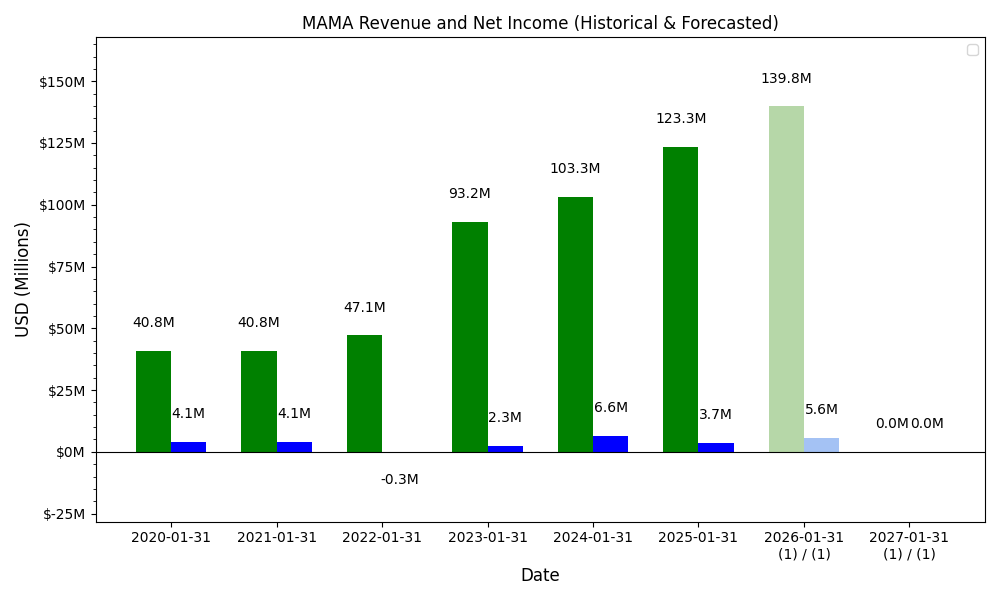
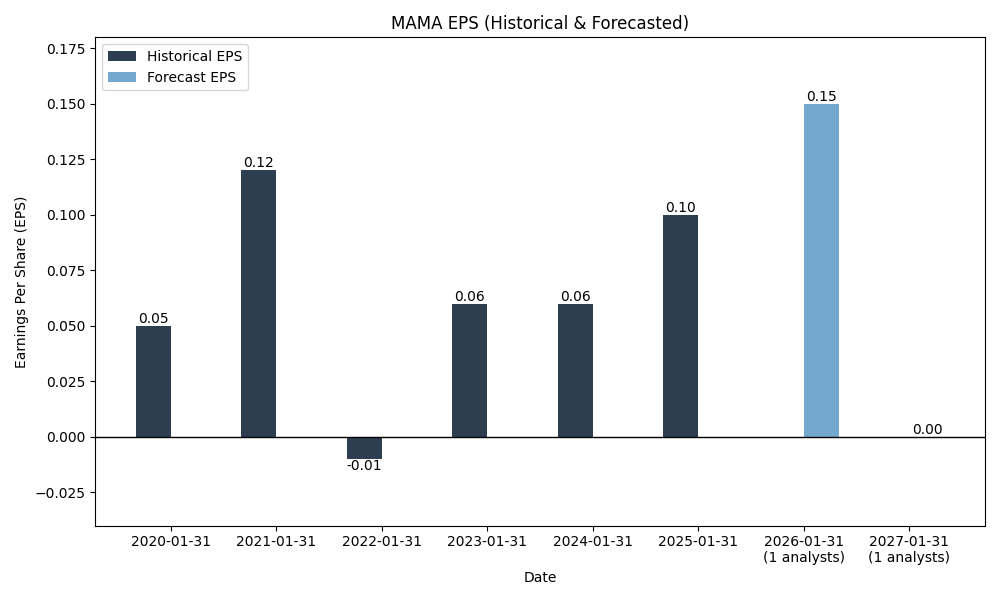
Y/Y % Change
MAMA Year-over-Year Growth
| 2020 | 2021 | 2022 | 2023 | 2024 | 2025 | 2026 | 2027 | 2028 | Average | |
|---|---|---|---|---|---|---|---|---|---|---|
| Revenue Growth (%) | 0.0% | 15.5% | 97.9% | 10.8% | 19.4% | 39.2% | 29.3% | 13.2% | 28.2% | |
| Revenue Analysts (#) | 0 | 0 | 0 | 0 | 0 | 0 | 0 | 6 | 5 | |
| EPS Growth (%) | 0.0% | -106.2% | -1014.6% | 184.8% | -43.4% | 42.4% | 72.5% | 60.7% | -100.5% | |
| EPS Analysts (#) | 0 | 0 | 0 | 0 | 0 | 0 | 0 | 5 | 4 |
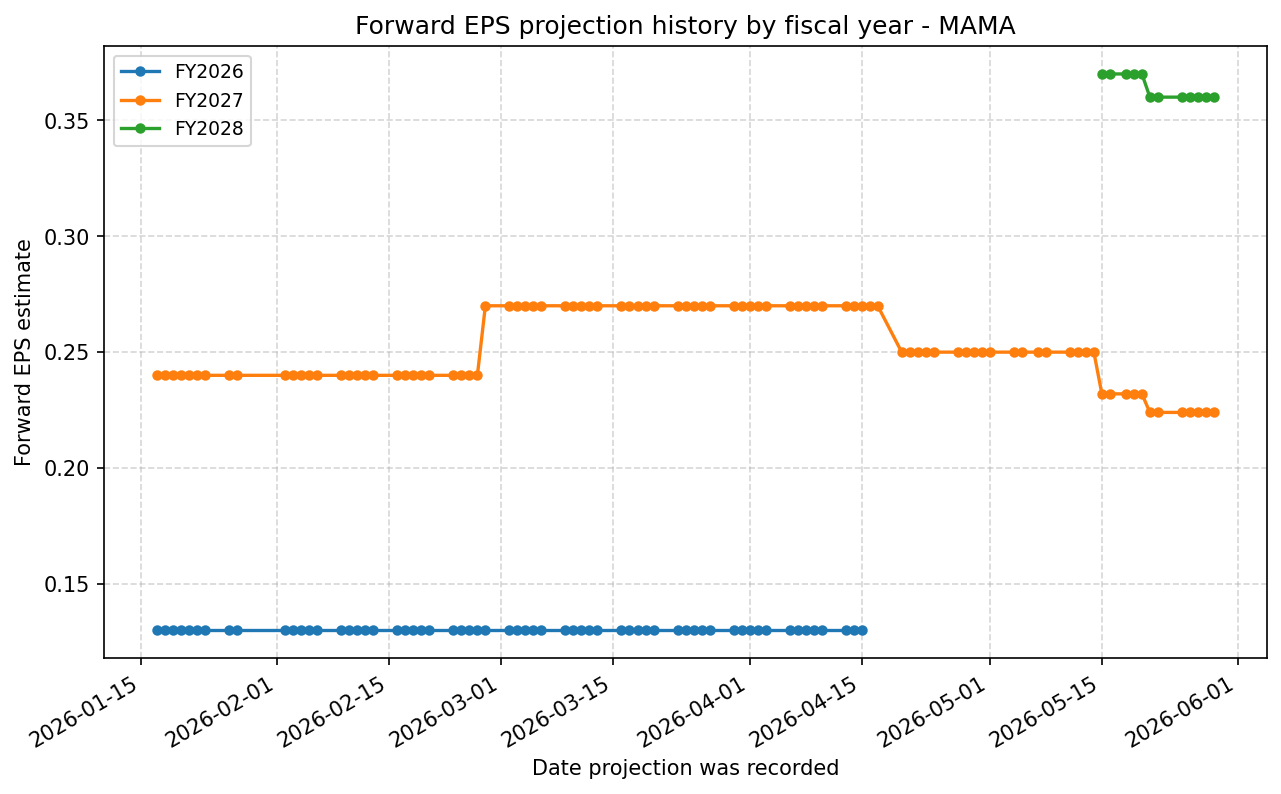
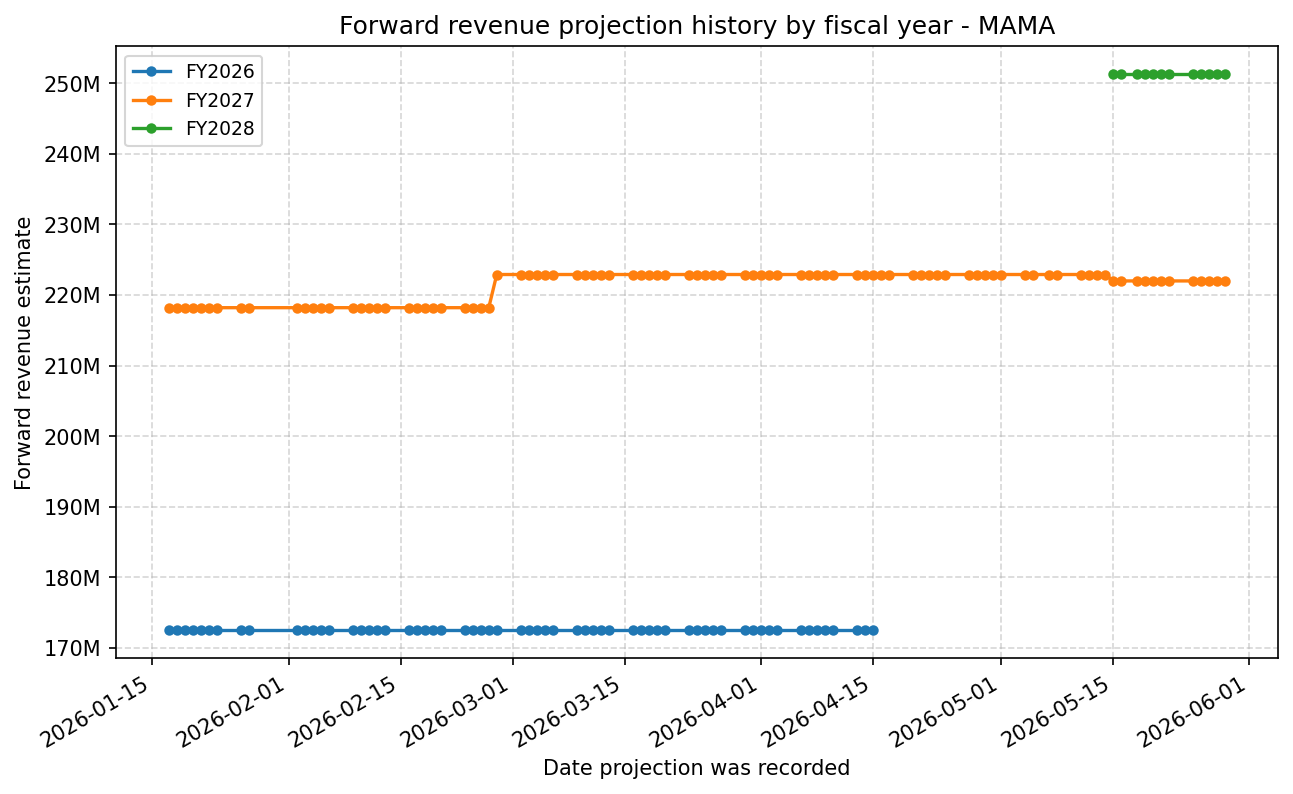
Forward Estimate History
How the next-FY EPS and revenue estimates have drifted over time. One line per fiscal year – past lines end when that FY became current.
Expenses
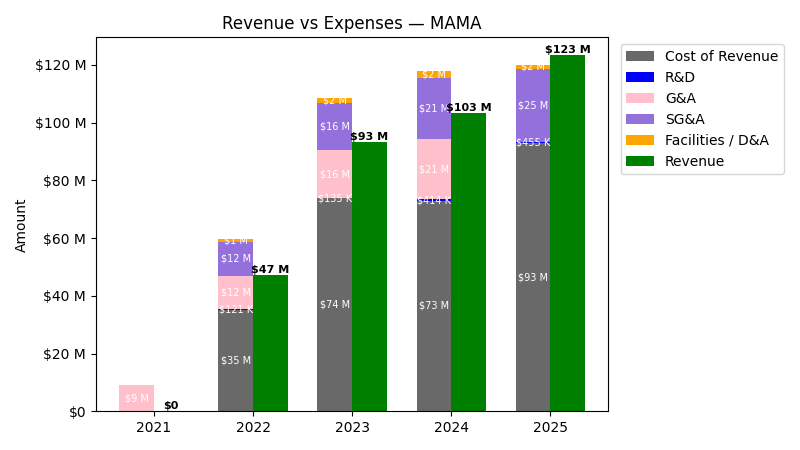
| Year | Revenue ($) | Cost of Revenue ($) | R&D ($) | G&A ($) | SG&A ($) | Facilities / D&A ($) |
|---|---|---|---|---|---|---|
| 2023 | $93.2M | $72.0M | $135.0K | $16.5M | $16.5M | $1.8M |
| 2024 | $103.3M | $70.8M | $414.0K | $21.0M | $21.0M | $2.1M |
| 2025 | $123.3M | $89.7M | $455.0K | $0.0 | $25.2M | $3.1M |
| 2026 | $171.7M | $123.8M | $288.0K | $0.0 | $35.6M | $4.9M |
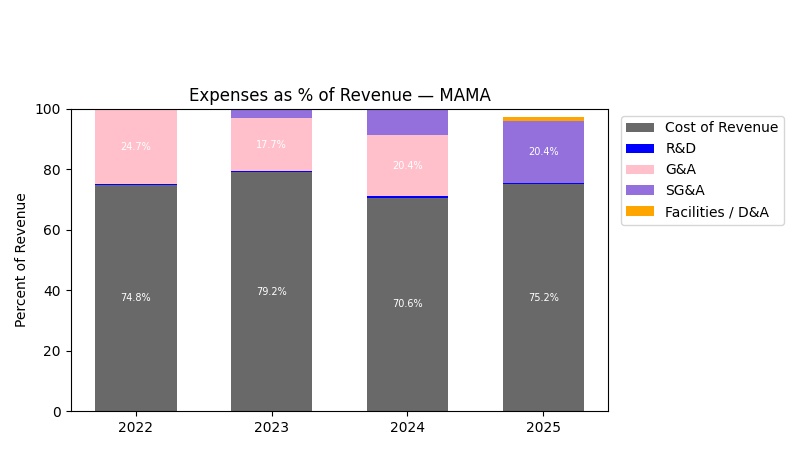
| Year | Revenue Change (%) | Cost of Revenue Change (%) | R&D Change (%) | G&A Change (%) | SG&A Change (%) | Facilities / D&A Change (%) |
|---|---|---|---|---|---|---|
| 2024 | 10.83 | -1.64 | 206.67 | 27.75 | 27.76 | 20.49 |
| 2025 | 19.41 | 26.59 | 9.90 | -100.00 | 19.84 | 47.67 |
| 2026 | 39.23 | 38.05 | -36.70 | NaN | 41.45 | 55.95 |
No unmapped expenses.
Balance Sheet
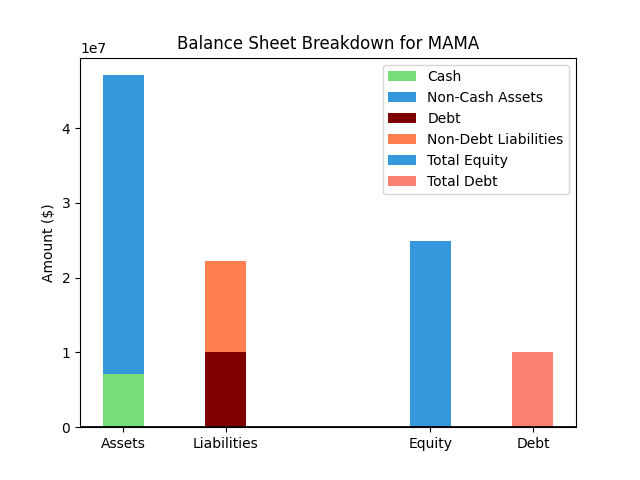
| Metric | Value | |
|---|---|---|
| 0 | Total Assets | $86M |
| 1 | Cash | $20M |
| 2 | Total Liabilities | $33M |
| 3 | Total Debt | $14M |
| 4 | Total Equity | $53M |
| 5 | Debt to Equity Ratio | 0.27 |
EPS & Dividend

Valuation
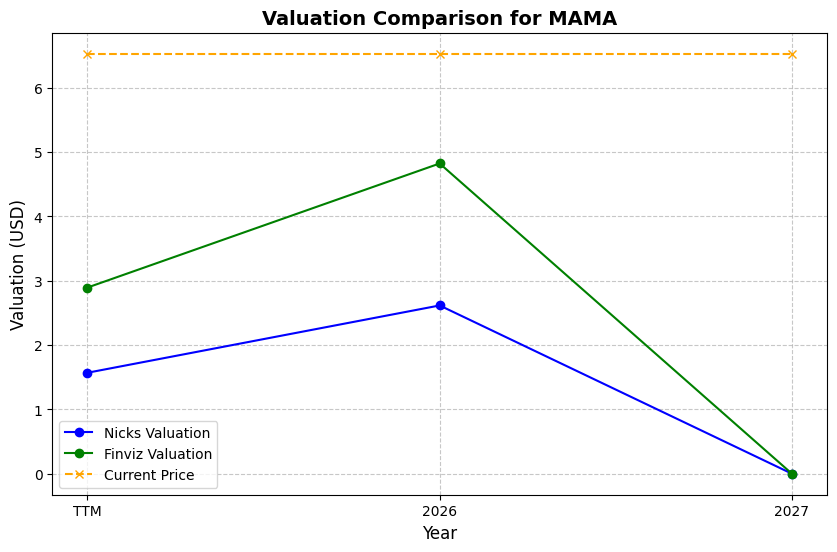
| Share Price | Treasury Yield | Estimates | Fair Value (P/E) | Fair Value (P/S) | Current P/S | Current P/E |
|---|---|---|---|---|---|---|
| $13.80 | 4.5% | Nicks Growth: 10% Nick's Expected Margin: 5% FINVIZ Growth: 43% |
Nicks: 17 Finviz: 260 |
Nick's: 0.858 | 3.3 | 106.2 |
| Basis | Year | Nicks Valuation | Nicks vs Share Price | Finviz Valuation | Finviz vs Share Price |
|---|---|---|---|---|---|
| $0.13 EPS | TTM | $2.23 | -83.8% | $33.83 | 145.1% |
| $0.22 EPS | 2027 | $3.84 | -72.1% | $58.29 | 322.4% |
| $0.36 EPS | 2028 | $6.18 | -55.2% | $93.68 | 578.8% |
Implied Growth
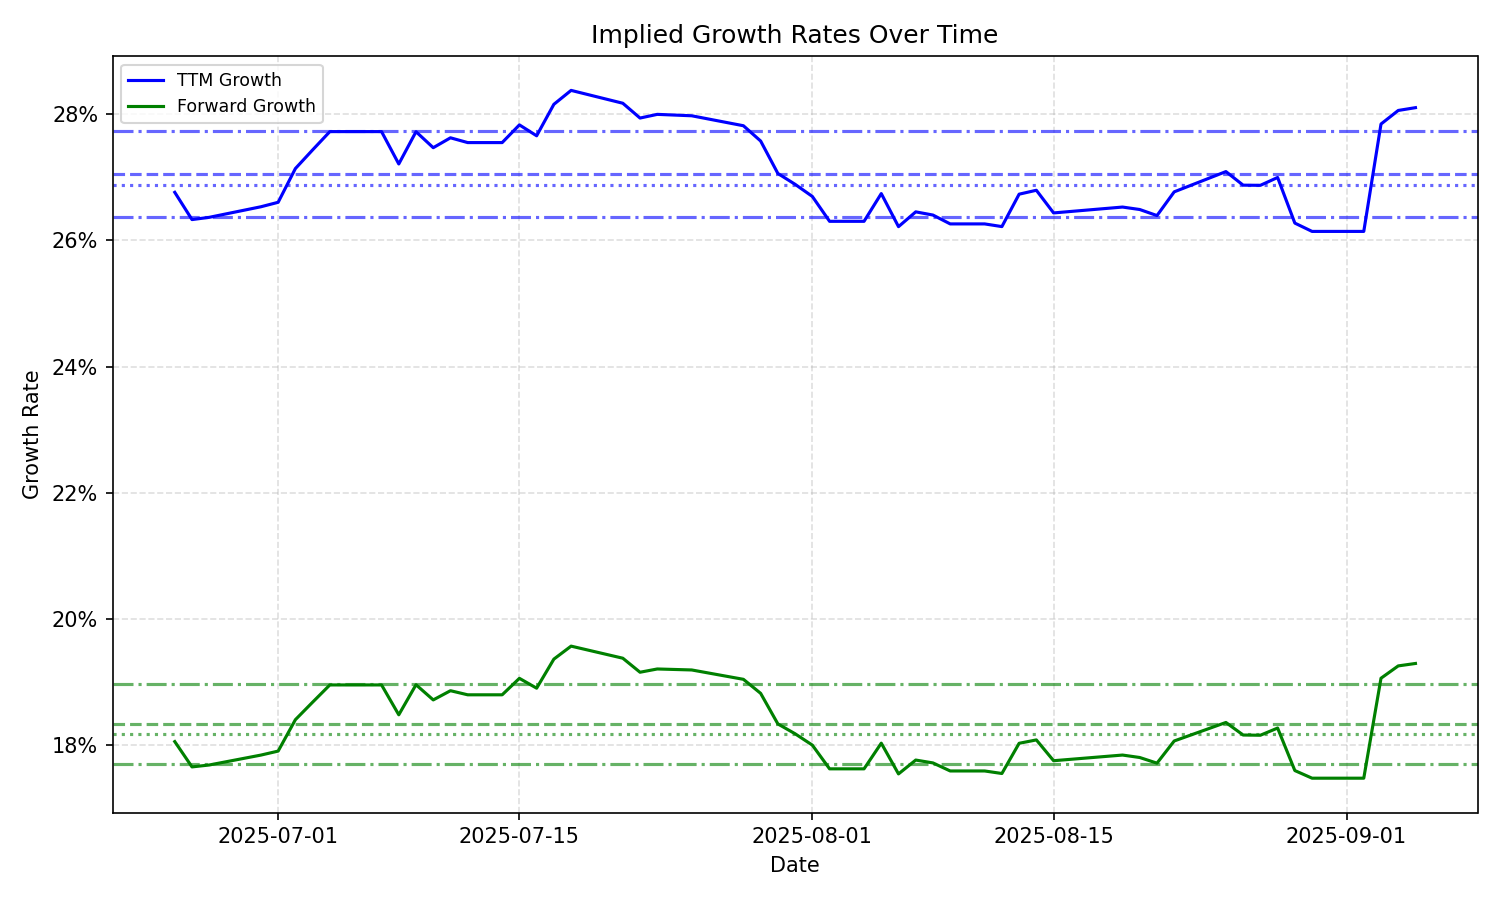
| Average | Median | Std Dev | Current | Percentile | ||||||
|---|---|---|---|---|---|---|---|---|---|---|
| TTM | Forward | TTM | Forward | TTM | Forward | TTM | Forward | TTM | Forward | |
| Timeframe | ||||||||||
| 1 Year | 30.28% | 20.47% | 30.22% | 20.69% | 2.41% | 1.49% | 31.73% | 21.52% | 69.8% | 74.0% |
| 3 Years | 30.28% | 20.47% | 30.22% | 20.69% | 2.41% | 1.49% | 31.73% | 21.52% | 69.8% | 74.0% |
| 5 Years | 30.28% | 20.47% | 30.22% | 20.69% | 2.41% | 1.49% | 31.73% | 21.52% | 69.8% | 74.0% |
| 10 Years | 30.28% | 20.47% | 30.22% | 20.69% | 2.41% | 1.49% | 31.73% | 21.52% | 69.8% | 74.0% |