Southwest Airlines Company — LUV
| Close Price | Market Cap | P/E Ratio | Forward P/E Ratio | Implied Growth* | Implied Forward Growth* | Dividend | P/B Ratio |
|---|---|---|---|---|---|---|---|
| $42.95 | $20.99B | 28.6 | 9.5 | 15.5% | 3.9% | $0.72 1.7% | 3.1 |
Latest Headlines
- · Yes, Airfares Are Rising—But Airline Executives Say That Isn't Stopping You From Flying
- · Southwest limited-time offer: Earn up to 90,000 Rapid Rewards points before your summer vacation
- · Stocks Settle Mixed on Conflicting US-Iran Signals
- · Greg Abel Is Trying to Break Berkshire Hathaway’s Losing Streak on Airlines with New Delta Stock Bet
- · Stocks Mixed Awaiting Fresh Iran News
- · Airline stocks rally as oil retreat eases fuel cost pressure
Revenue & Net Income
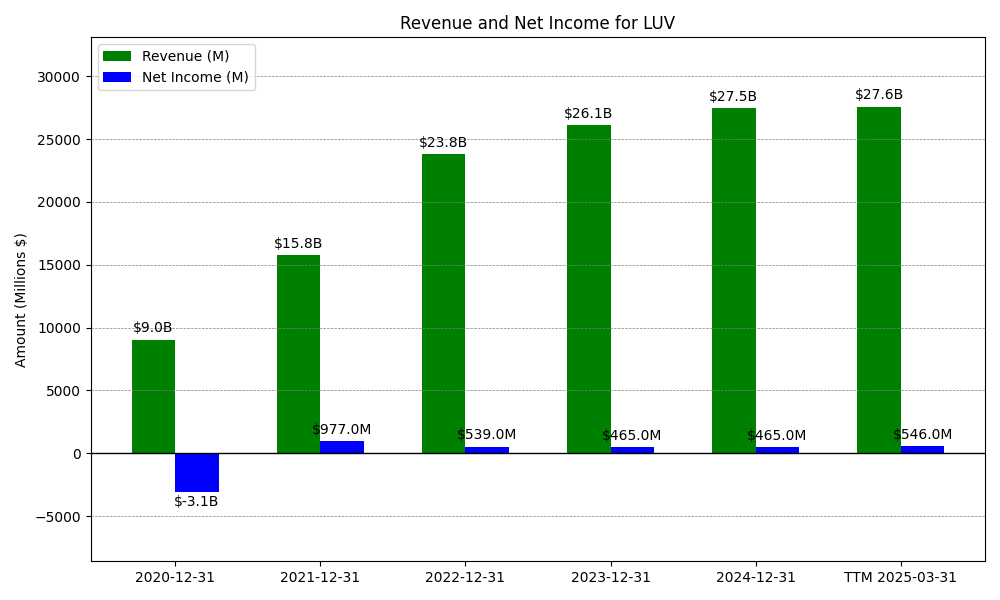
| Date | Revenue | Net_Income | EPS | Last_Updated | Revenue_Change | Net_Income_Change | EPS_Change | |
|---|---|---|---|---|---|---|---|---|
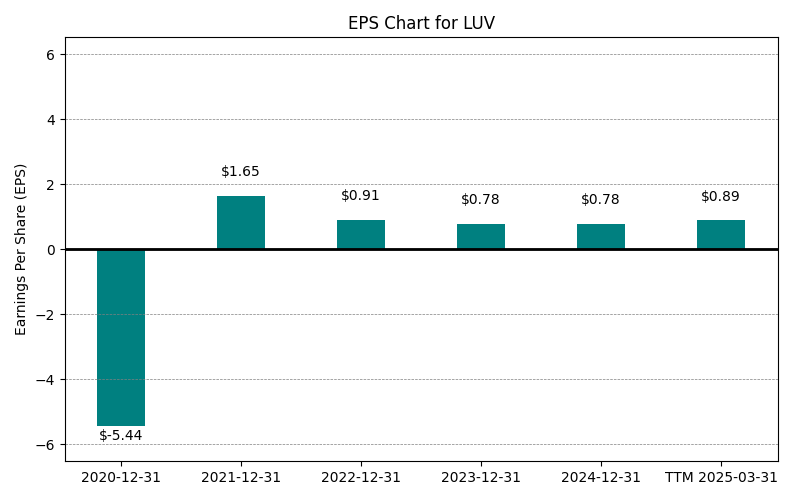
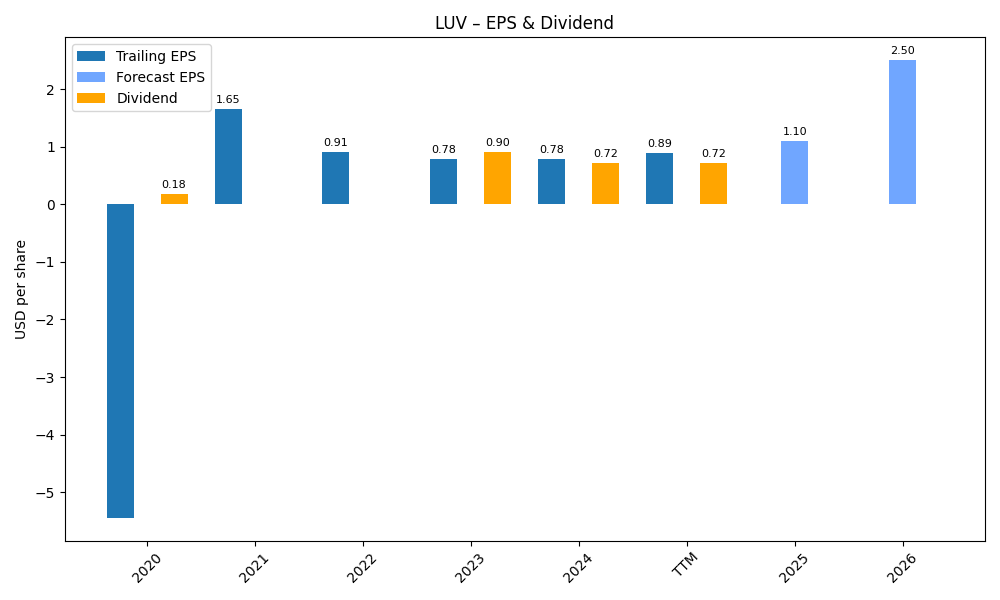
| 0 | 2020-12-31 | $9,048M | $-3,074M | $-5.44 | 2024-02-08 22:12:14 | N/A | N/A | N/A |
| 1 | 2021-12-31 | $15,790M | $977M | $0.91 | 2026-02-06 08:38:00 | 74.5% | -131.8% | -116.7% |
| 2 | 2022-12-31 | $23,814M | $539M | $0.91 | 2026-05-29 09:11:02 | 50.8% | -44.8% | 0.0% |
| 3 | 2023-12-31 | $26,091M | $465M | $0.84 | 2026-05-29 09:11:02 | 9.6% | -13.7% | -7.7% |
| 4 | 2024-12-31 | $27,483M | $465M | $0.78 | 2026-05-29 09:11:02 | 5.3% | 0.0% | -7.1% |
| 5 | 2025-12-31 | $28,063M | $441M | $0.82 | 2026-05-29 09:11:02 | 2.1% | -5.2% | 5.1% |
| 6 | TTM 2026-03-31 | $28,884M | $817M | $1.50 | 2026-04-24 08:46:18 | 2.9% | 85.3% | 82.9% |
EPS
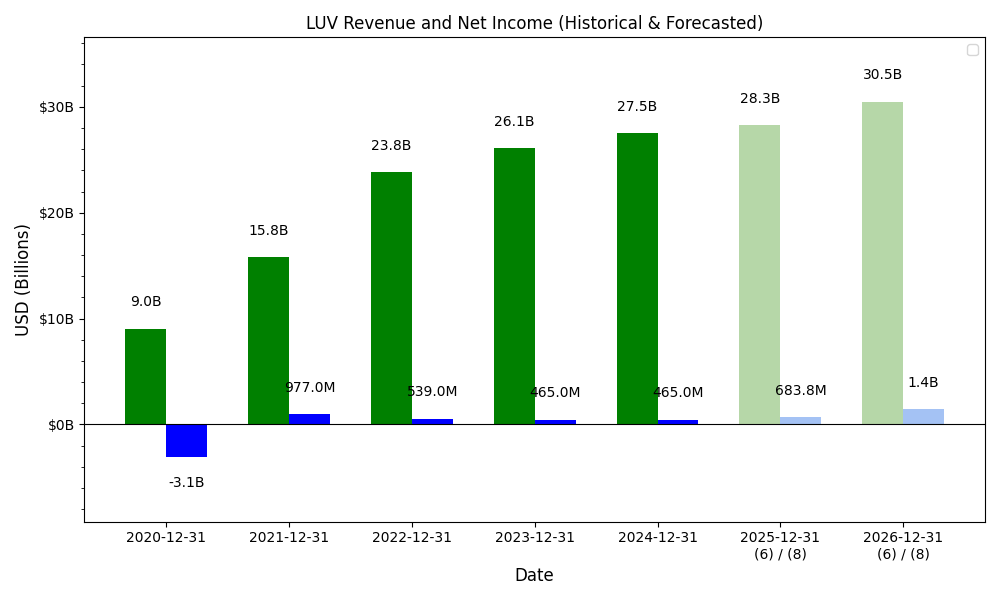
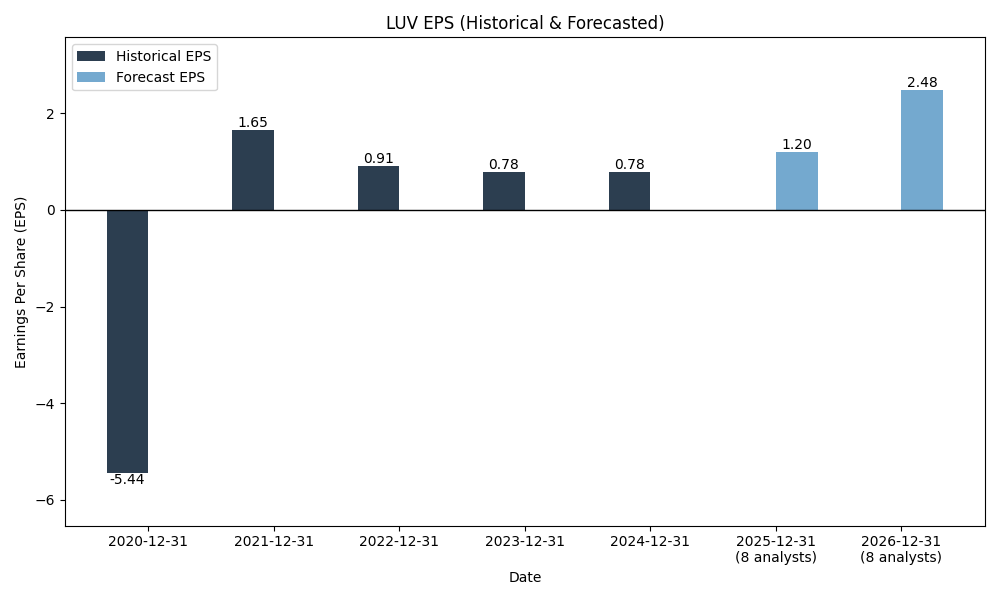
Forecasts
Y/Y % Change
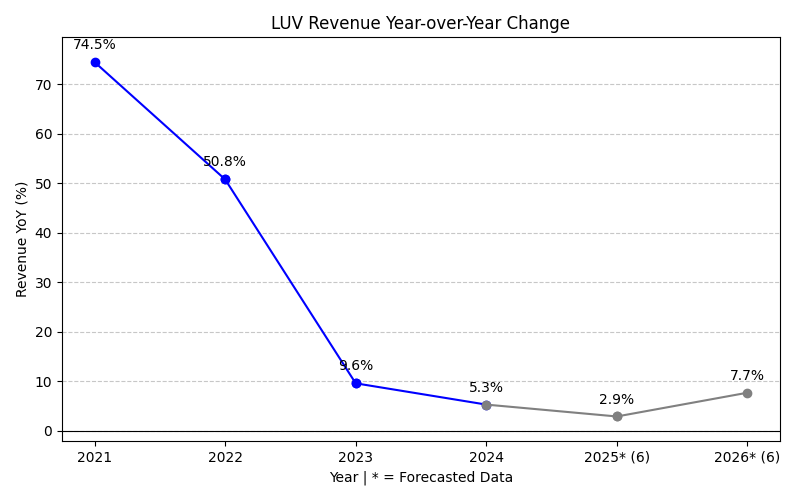
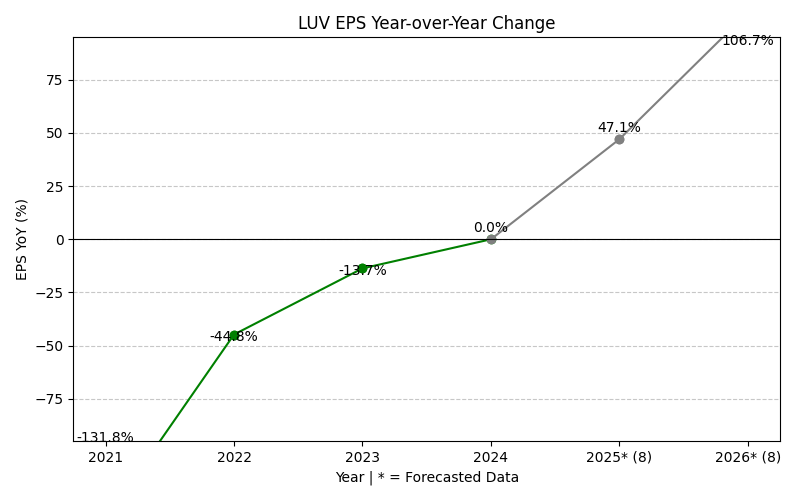
LUV Year-over-Year Growth
| 2020 | 2021 | 2022 | 2023 | 2024 | 2025 | 2026 | 2027 | Average | |
|---|---|---|---|---|---|---|---|---|---|
| Revenue Growth (%) | 74.5% | 50.8% | 9.6% | 5.3% | 2.1% | 16.6% | 3.0% | 23.1% | |
| Revenue Analysts (#) | 0 | 0 | 0 | 0 | 0 | 0 | 21 | 21 | |
| EPS Growth (%) | -131.8% | -44.8% | -13.7% | 0.0% | -5.2% | 199.0% | 67.9% | 10.2% | |
| EPS Analysts (#) | 0 | 0 | 0 | 0 | 0 | 0 | 23 | 22 |
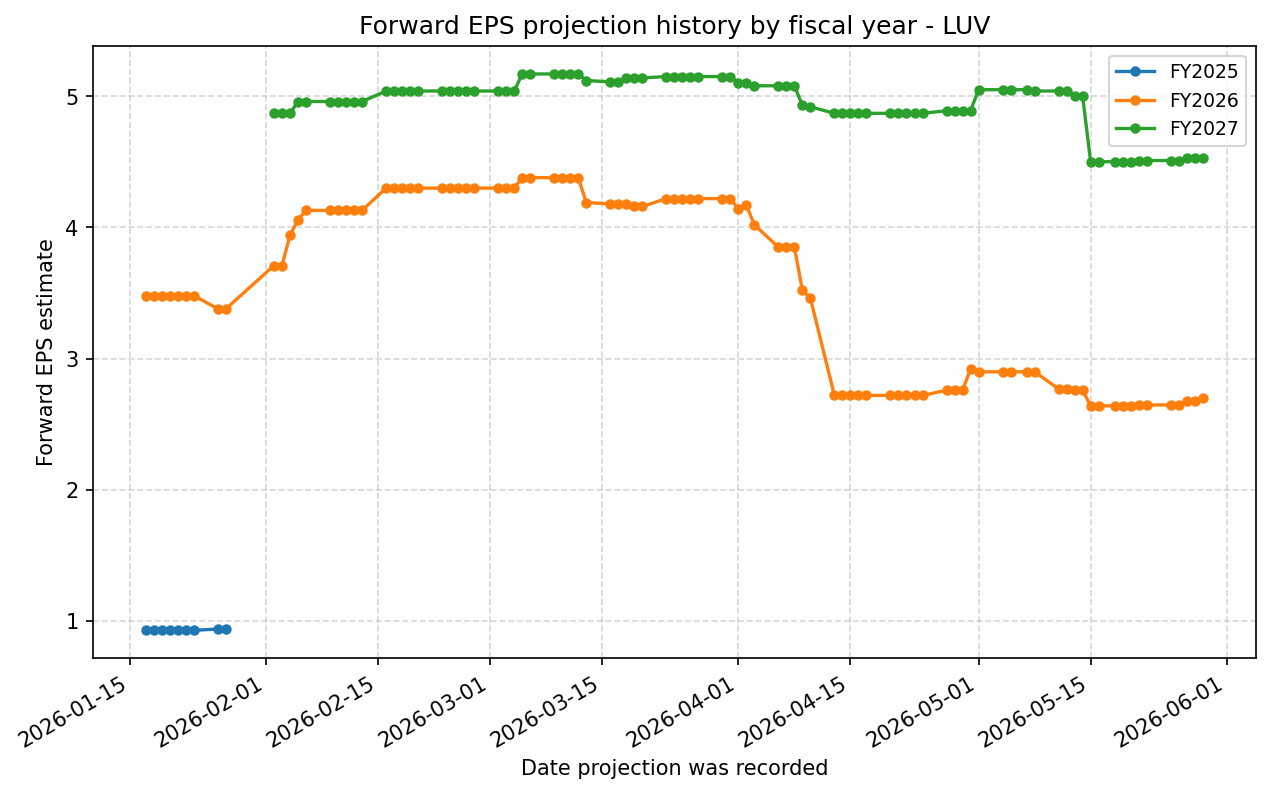
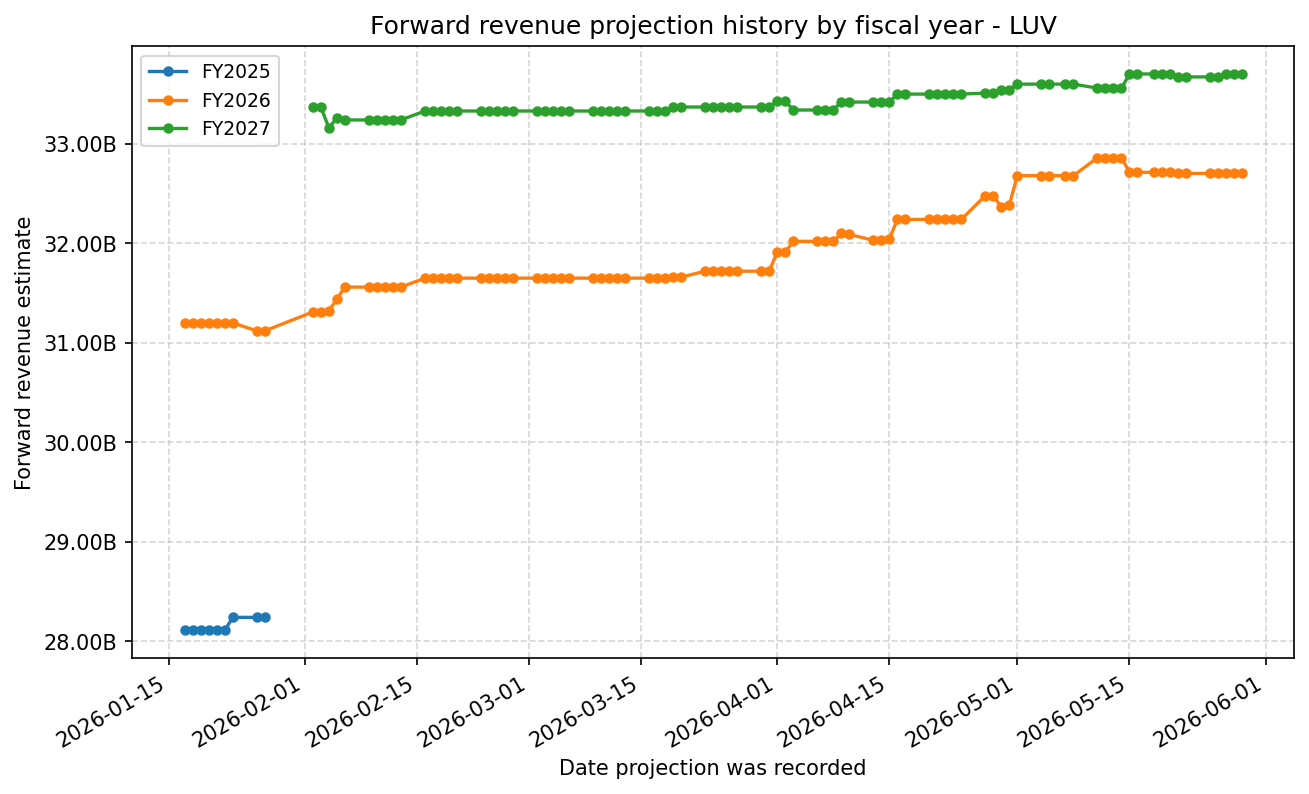
Forward Estimate History
How the next-FY EPS and revenue estimates have drifted over time. One line per fiscal year – past lines end when that FY became current.
Expenses
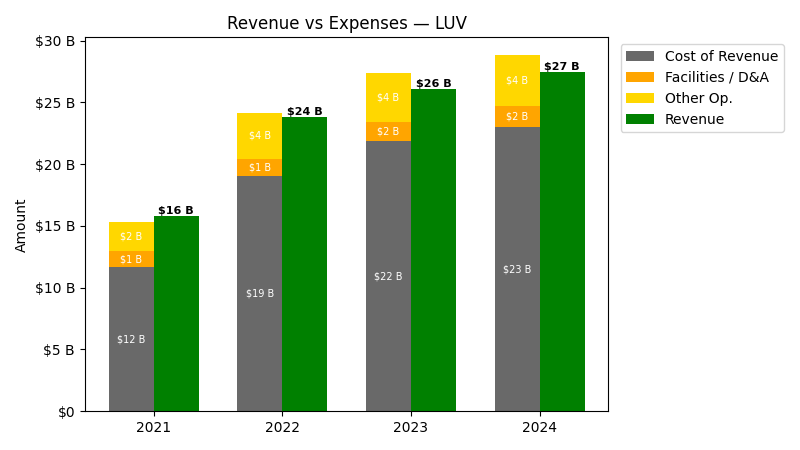
| Year | Revenue ($) | Cost of Revenue ($) | Facilities / D&A ($) |
|---|---|---|---|
| 2022 | $23.8B | $17.7B | $1.4B |
| 2023 | $26.1B | $20.3B | $1.5B |
| 2024 | $27.5B | $21.4B | $1.7B |
| 2025 | $28.1B | $21.6B | $1.6B |
| TTM | $28.9B | $21.9B | $1.6B |
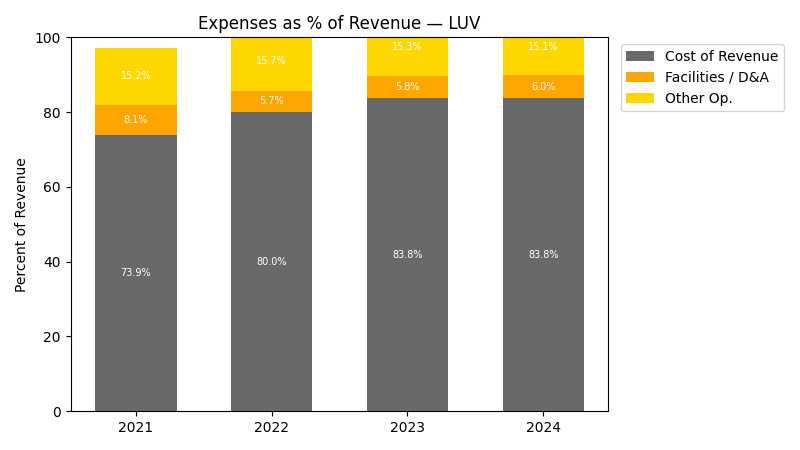
| Year | Revenue Change (%) | Cost of Revenue Change (%) | Facilities / D&A Change (%) |
|---|---|---|---|
| 2023 | 9.56 | 14.88 | 12.66 |
| 2024 | 5.34 | 5.02 | 8.87 |
| 2025 | 2.11 | 1.13 | -5.85 |
| TTM | 2.93 | 1.47 | 0.19 |
No unmapped expenses.
Segment Performance
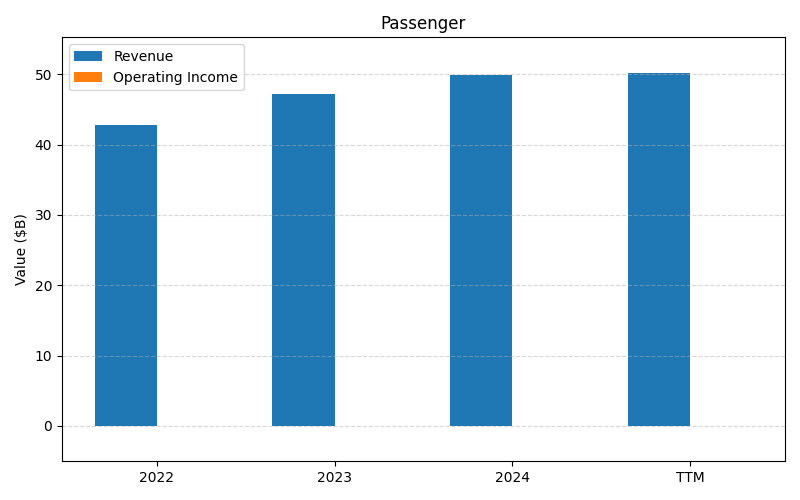
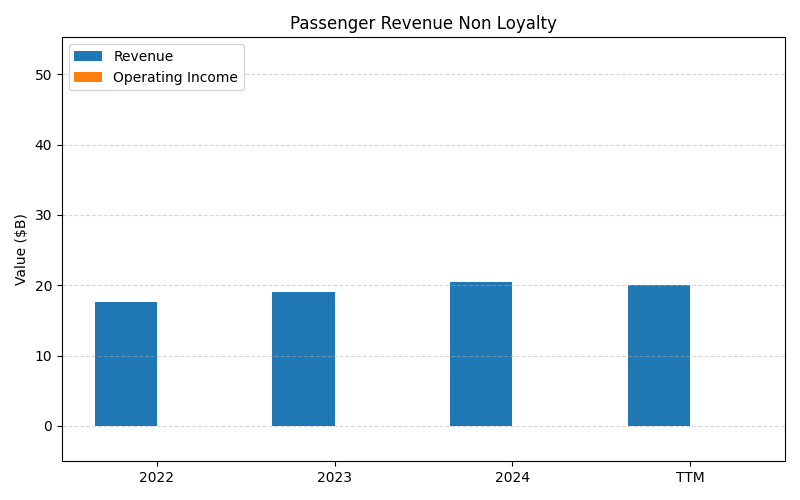
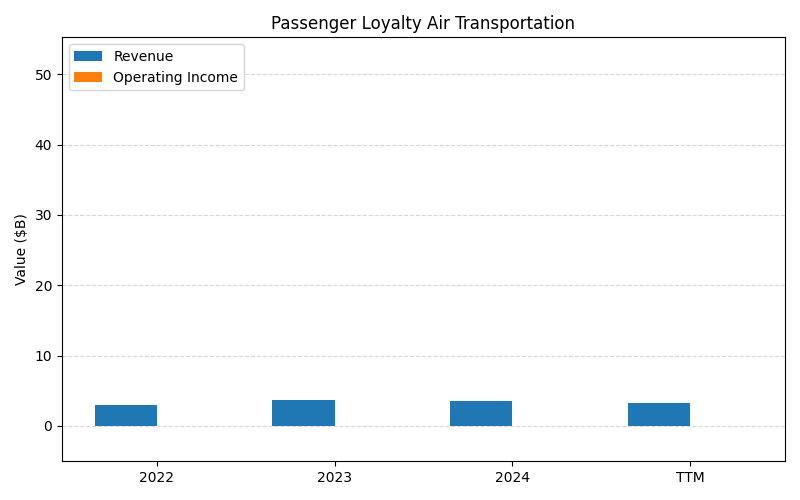
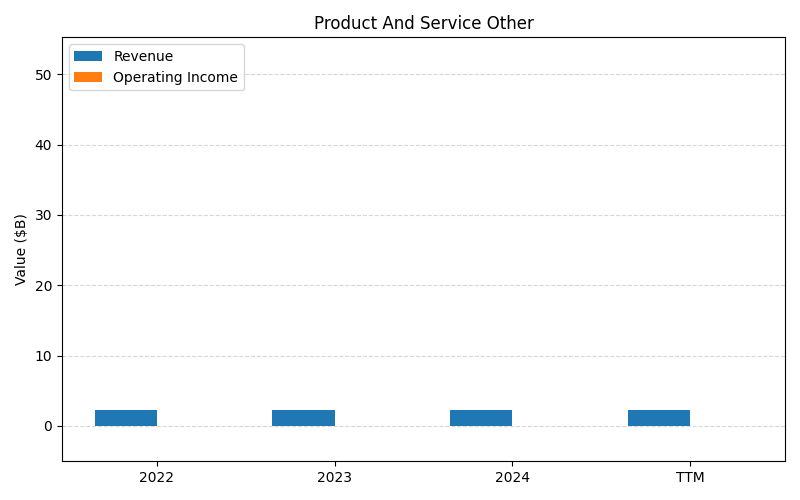
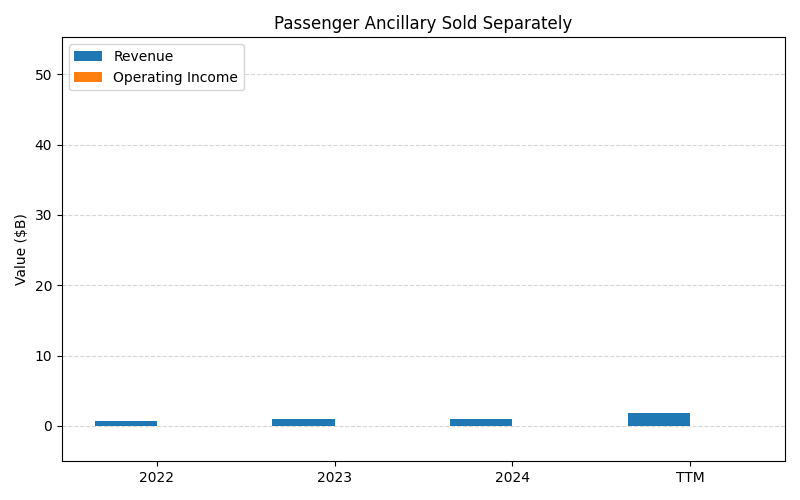
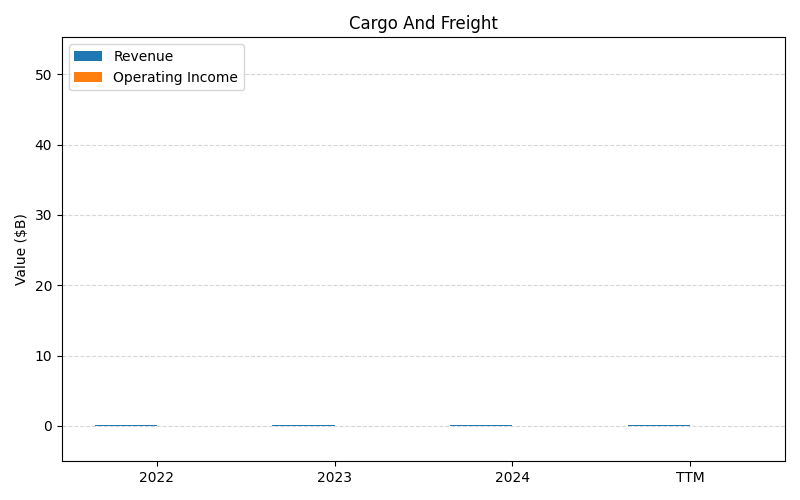
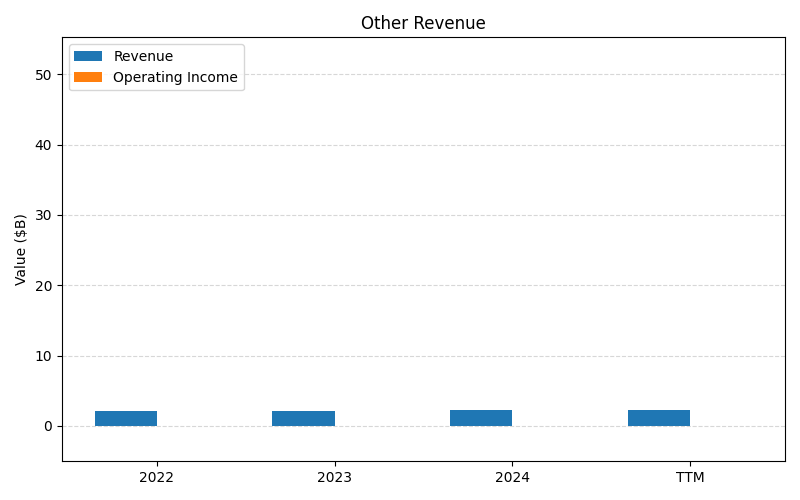
SEGMENTS v2025-09-09 · 2026-05-29 09:11 UTC — Units: $B. Rows list fiscal years (last 3 + TTM) with revenue for each segment; the final row shows the TTM revenue mix (operating income columns display “—” where mix is not applicable).
| Year | Passenger Rev | Passenger Revenue Non Loyalty Rev | Passenger Loyalty Air Transportation Rev | Product And Service Other Rev | Passenger Ancillary Sold Separately Rev | Cargo And Freight Rev | Other Revenue Rev | Total Rev |
|---|---|---|---|---|---|---|---|---|
| 2023 | 47.3B | 19.1B | 3.64B | 2.28B | 0.93B | 0.17B | 2.10B | 75.5B |
| 2024 | 50B | 20.5B | 3.48B | 2.33B | 1.03B | 0.17B | 2.20B | 79.6B |
| 2025 | 51.1B | 20.4B | 3.26B | 2.36B | 1.83B | 0.17B | 2.60B | 81.7B |
| TTM | 125.8B | 50.9B | 8.23B | 7.07B | 3.82B | 0.43B | – | 196.2B |
| % of Total (TTM) | 64.1% | 25.9% | 4.2% | 3.6% | 1.9% | 0.2% | – | 100% |
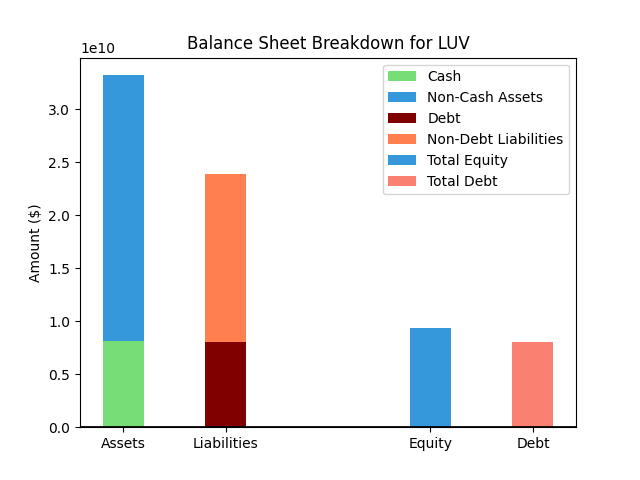
Balance Sheet
| Metric | Value | |
|---|---|---|
| 0 | Total Assets | $29,355M |
| 1 | Cash | $3,328M |
| 2 | Total Liabilities | $22,480M |
| 3 | Total Debt | $6,396M |
| 4 | Total Equity | $6,875M |
| 5 | Debt to Equity Ratio | 0.93 |
EPS & Dividend
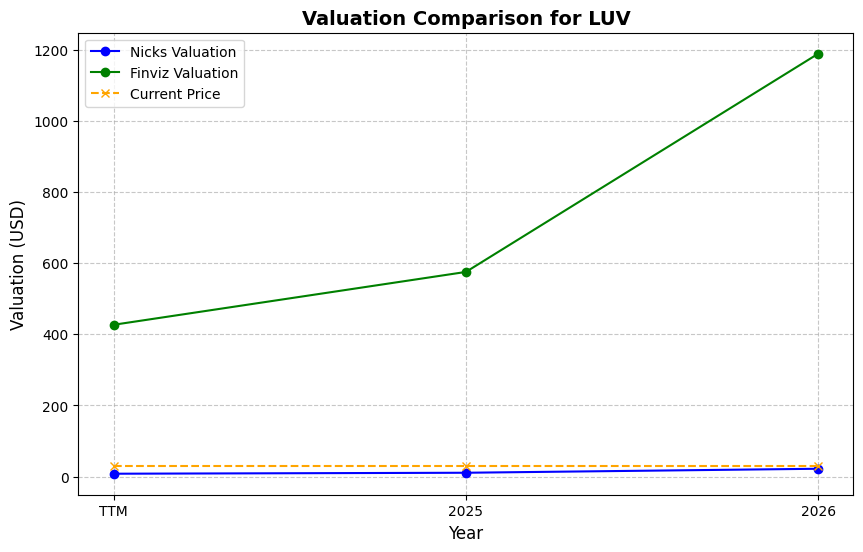
Valuation
| Share Price | Treasury Yield | Estimates | Fair Value (P/E) | Fair Value (P/S) | Current P/S | Current P/E |
|---|---|---|---|---|---|---|
| $42.95 | 4.5% | Nicks Growth: 3% Nick's Expected Margin: 2% FINVIZ Growth: 77% |
Nicks: 9 Finviz: 2320 |
Nick's: 0.173 | 0.7 | 28.6 |
| Basis | Year | Nicks Valuation | Nicks vs Share Price | Finviz Valuation | Finviz vs Share Price |
|---|---|---|---|---|---|
| $1.50 EPS | TTM | $12.96 | -69.8% | $3480.49 | 8003.6% |
| $2.70 EPS | 2026 | $23.30 | -45.7% | $6259.01 | 14472.8% |
| $4.53 EPS | 2027 | $39.11 | -8.9% | $10506.11 | 24361.3% |
Implied Growth
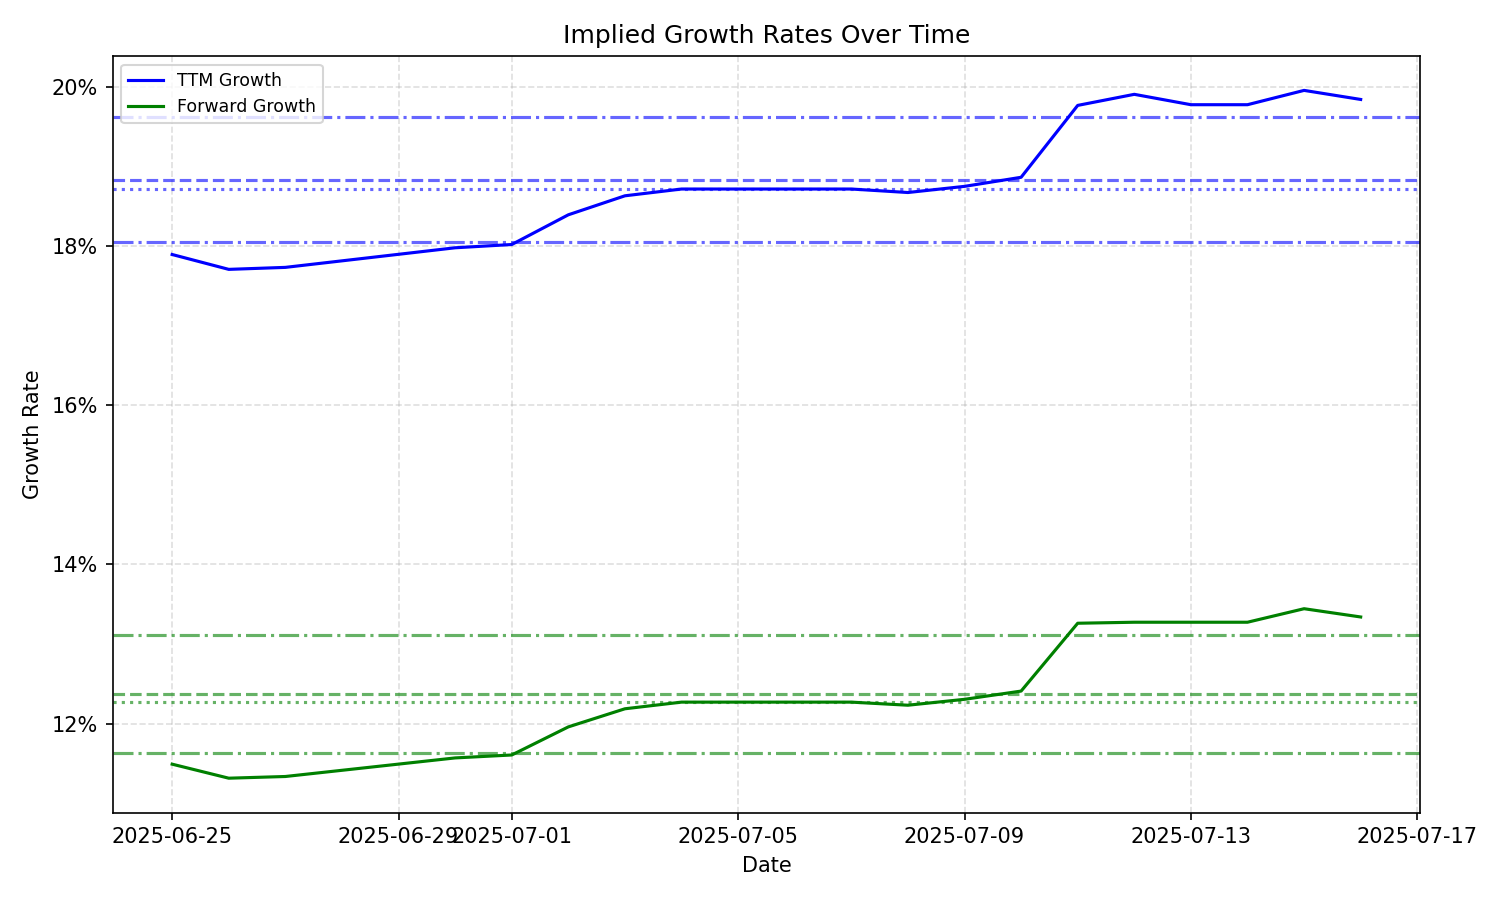
| Average | Median | Std Dev | Current | Percentile | ||||||
|---|---|---|---|---|---|---|---|---|---|---|
| TTM | Forward | TTM | Forward | TTM | Forward | TTM | Forward | TTM | Forward | |
| Timeframe | ||||||||||
| 1 Year | 21.40% | 8.36% | 21.75% | 10.70% | 2.91% | 3.88% | 15.64% | 4.01% | 10.3% | 25.6% |
| 3 Years | 21.40% | 8.36% | 21.75% | 10.70% | 2.91% | 3.88% | 15.64% | 4.01% | 10.3% | 25.6% |
| 5 Years | 21.40% | 8.36% | 21.75% | 10.70% | 2.91% | 3.88% | 15.64% | 4.01% | 10.3% | 25.6% |
| 10 Years | 21.40% | 8.36% | 21.75% | 10.70% | 2.91% | 3.88% | 15.64% | 4.01% | 10.3% | 25.6% |