lululemon athletica inc. — LULU
| Close Price | Market Cap | P/E Ratio | Forward P/E Ratio | Implied Growth* | Implied Forward Growth* | Dividend | P/B Ratio |
|---|---|---|---|---|---|---|---|
| $131.18 | $15.68B | 9.9 | 9.9 | 4.3% | 4.4% | - | 3.1 |
Latest Headlines
- · The Spill: Is Ralph Lauren (RL) Finally Worth Its Premium Price?
- · Lululemon Stock Has Crashed 60% Over the Past Year, But 1 Ugly Distraction Is Finally Gone
- · Lululemon Earnings Could Swing Stock
- · Earnings Preview: Lululemon (LULU) Q1 Earnings Expected to Decline
- · lululemon Pre-Q1 Earnings: Is it the Right Time to Buy the Stock?
- · Lululemon settles proxy battle with founder as new directors join board
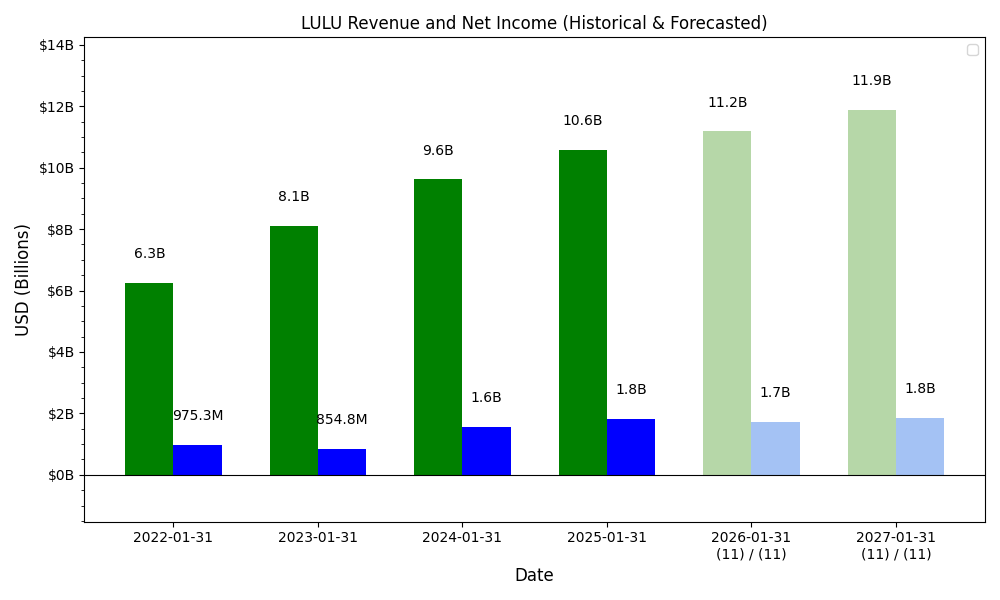
Revenue & Net Income

| Date | Revenue | Net_Income | EPS | Last_Updated | Revenue_Change | Net_Income_Change | EPS_Change | |
|---|---|---|---|---|---|---|---|---|
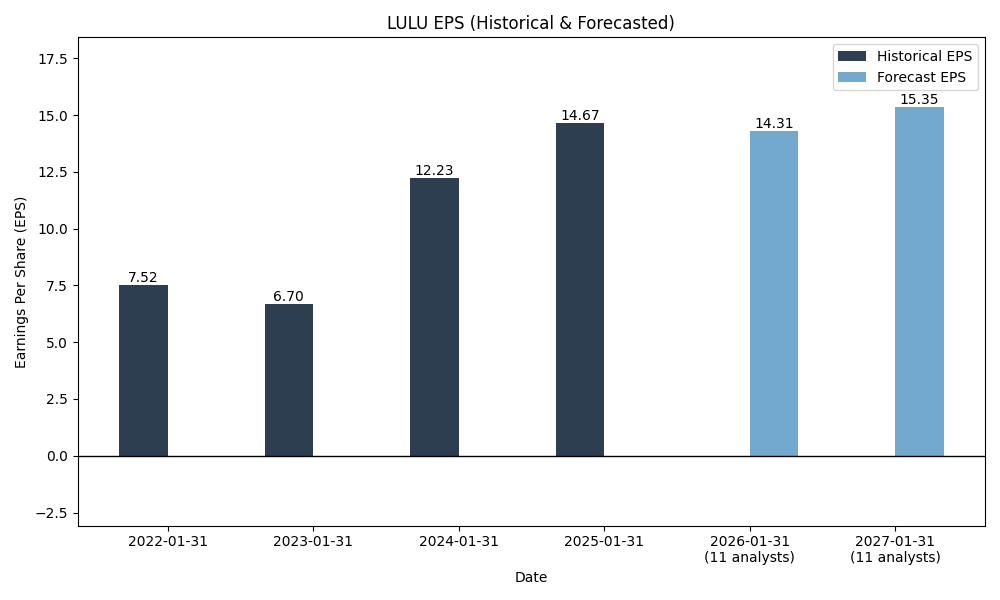
| 0 | 2022-01-31 | $6,257M | $975M | $7.52 | 2026-03-30 13:20:34 | N/A | N/A | N/A |
| 1 | 2023-01-31 | $8,111M | $855M | $6.70 | 2026-05-29 09:10:55 | 29.6% | -12.4% | -10.9% |
| 2 | 2024-01-31 | $9,619M | $1,550M | $12.23 | 2026-05-29 09:10:55 | 18.6% | 81.4% | 82.5% |
| 3 | 2025-01-31 | $10,588M | $1,815M | $14.67 | 2026-05-29 09:10:55 | 10.1% | 17.1% | 20.0% |
| 4 | 2026-01-31 | $11,103M | $1,579M | $13.27 | 2026-05-29 09:10:55 | 4.9% | -13.0% | -9.5% |
| 5 | TTM 2026-01-31 | $11,103M | $1,579M | $13.26 | 2026-03-31 08:53:52 | 0.0% | 0.0% | -0.1% |
EPS

Forecasts
Y/Y % Change
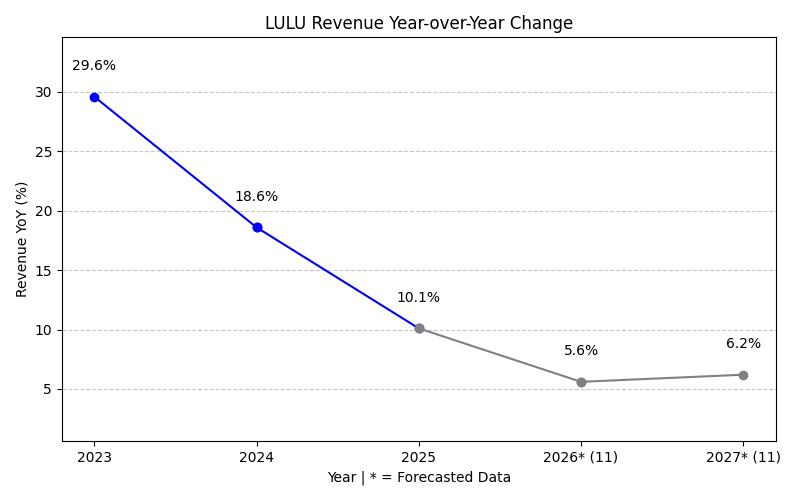
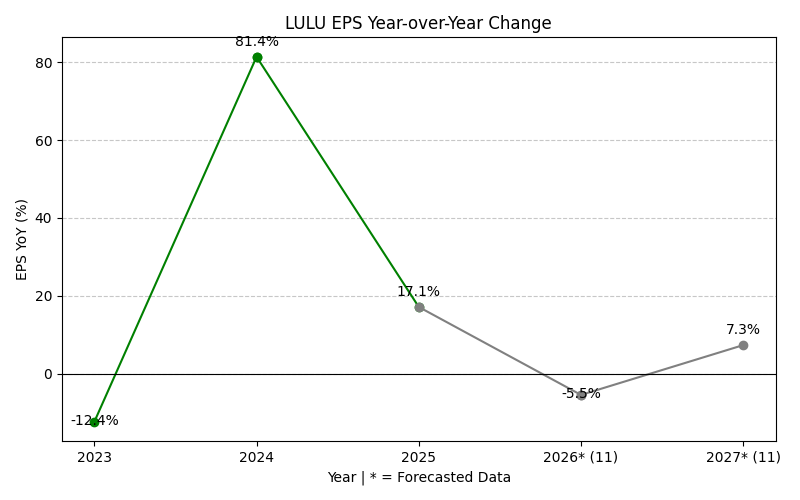
LULU Year-over-Year Growth
| 2022 | 2023 | 2024 | 2025 | 2026 | 2027 | 2028 | Average | |
|---|---|---|---|---|---|---|---|---|
| Revenue Growth (%) | 29.6% | 18.6% | 10.1% | 4.9% | 3.3% | 4.4% | 11.8% | |
| Revenue Analysts (#) | 0 | 0 | 0 | 0 | 0 | 30 | 29 | |
| EPS Growth (%) | -12.4% | 81.4% | 17.1% | -13.0% | -7.0% | 8.2% | 12.4% | |
| EPS Analysts (#) | 0 | 0 | 0 | 0 | 0 | 23 | 22 |
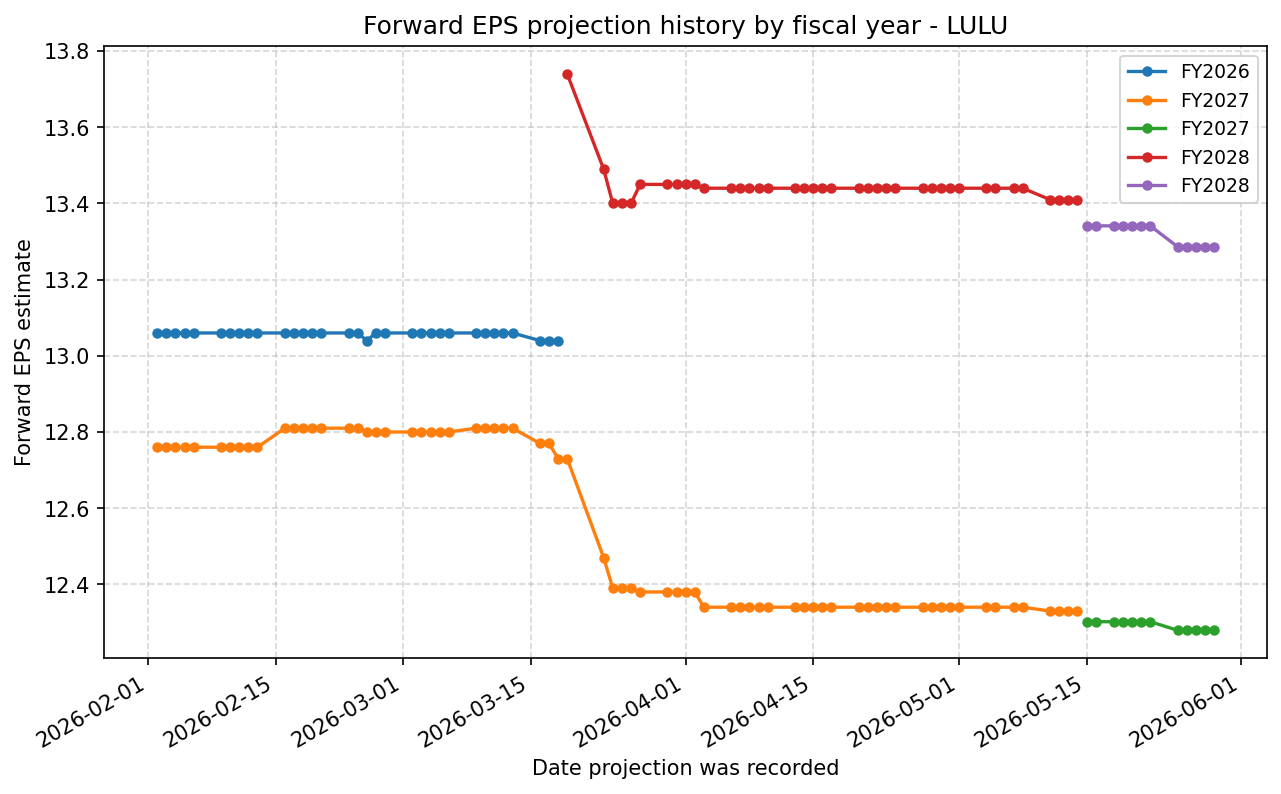
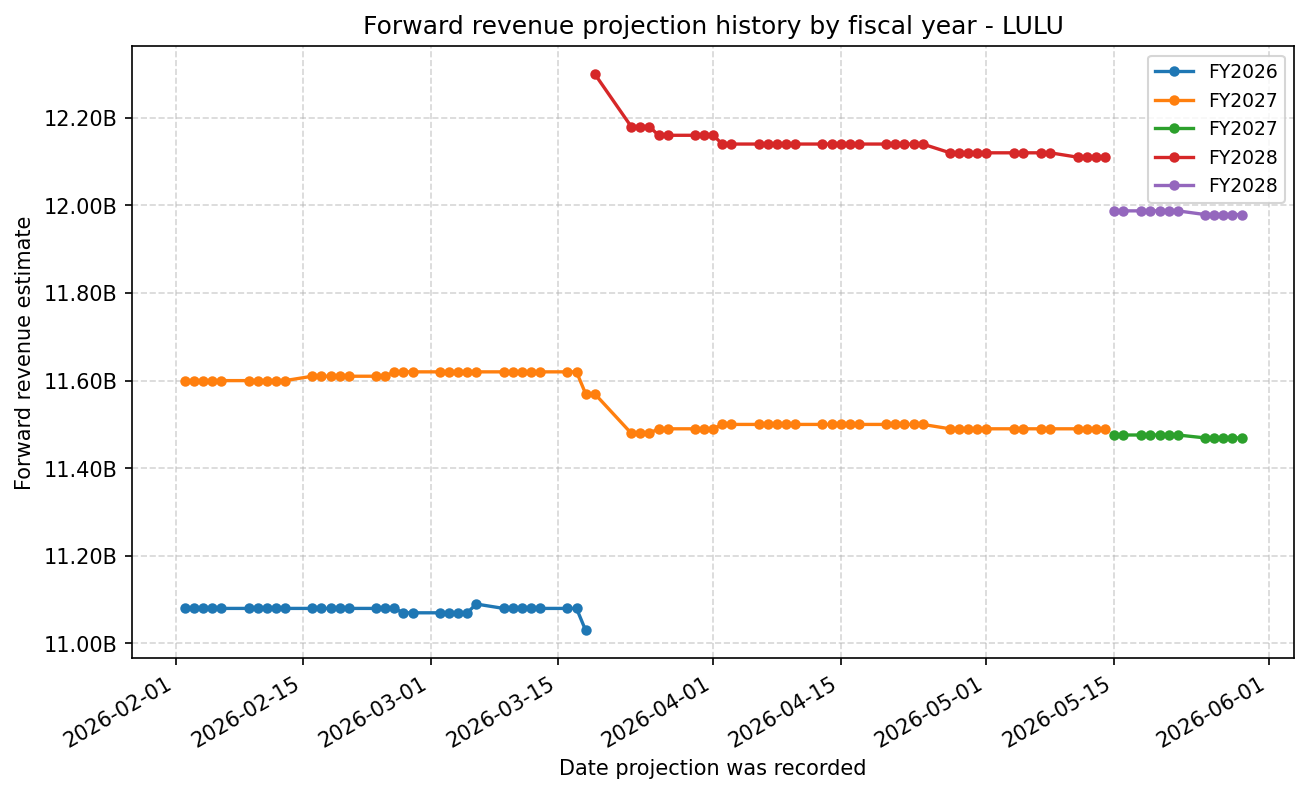
Forward Estimate History
How the next-FY EPS and revenue estimates have drifted over time. One line per fiscal year – past lines end when that FY became current.
Expenses

| Year | Revenue ($) | Cost of Revenue ($) | SG&A ($) | Facilities / D&A ($) |
|---|---|---|---|---|
| 2023 | $8.1B | $3.0B | $2.8B | $291.8M |
| 2024 | $9.6B | $3.3B | $3.4B | $379.4M |
| 2025 | $10.6B | $3.4B | $3.8B | $446.5M |
| 2026 | $11.1B | $3.8B | $4.1B | $496.2M |

| Year | Revenue Change (%) | Cost of Revenue Change (%) | SG&A Change (%) | Facilities / D&A Change (%) |
|---|---|---|---|---|
| 2024 | 18.60 | 6.99 | 23.20 | 30.02 |
| 2025 | 10.07 | 5.25 | 10.75 | 17.70 |
| 2026 | 4.86 | 11.85 | 8.08 | 11.13 |
No unmapped expenses.
Segment Performance
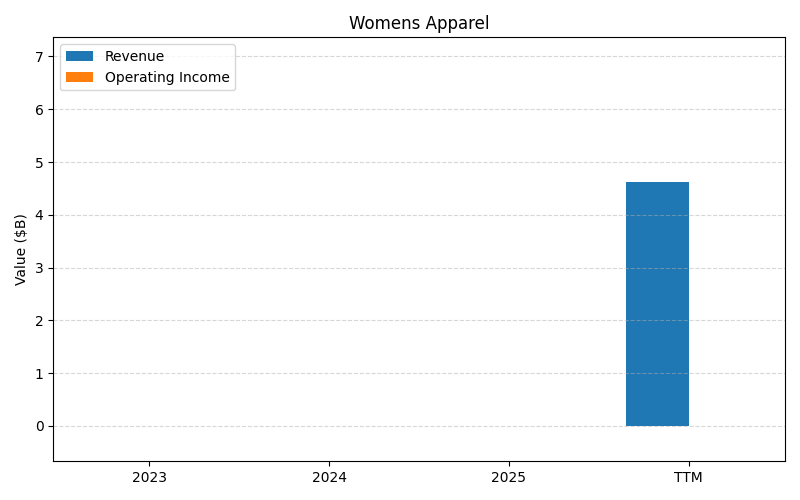
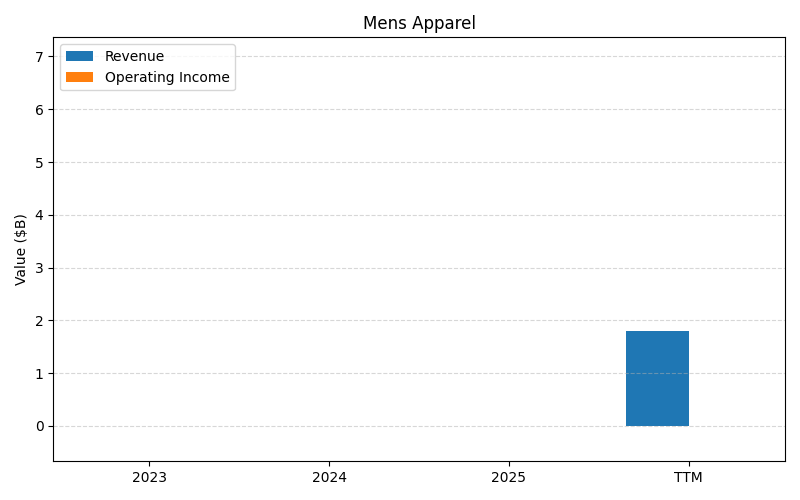
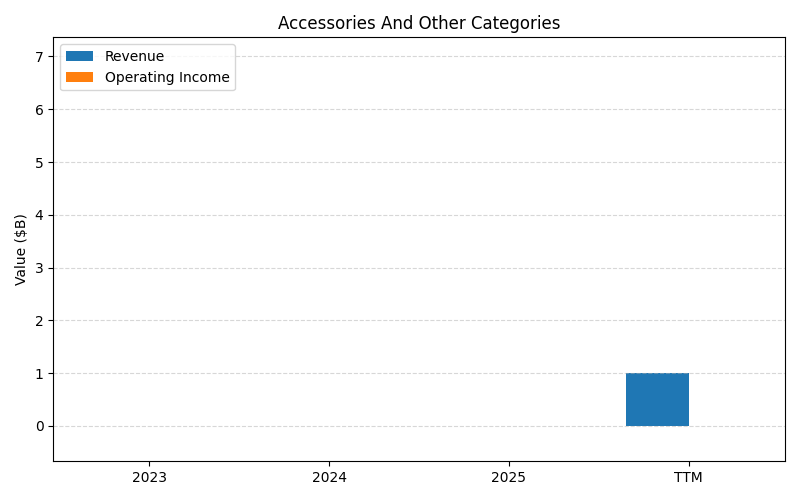
SEGMENTS v2025-09-09 · 2026-05-29 09:11 UTC — Units: $B. Rows list fiscal years (last 3 + TTM) with revenue for each segment; the final row shows the TTM revenue mix (operating income columns display “—” where mix is not applicable).
| Year | Womens Apparel Rev | Mens Apparel Rev | Accessories And Other Categories Rev | Total Rev |
|---|---|---|---|---|
| 2024 | 6.15B | 2.25B | 1.22B | 9.62B |
| 2025 | 6.69B | 2.56B | 1.34B | 10.6B |
| 2026 | 7.00B | 2.66B | 1.44B | 11.1B |
| TTM | 26.1B | 9.78B | 5.23B | 41.1B |
| % of Total (TTM) | 63.5% | 23.8% | 12.7% | 100% |
Segment Performance (Axis 2)
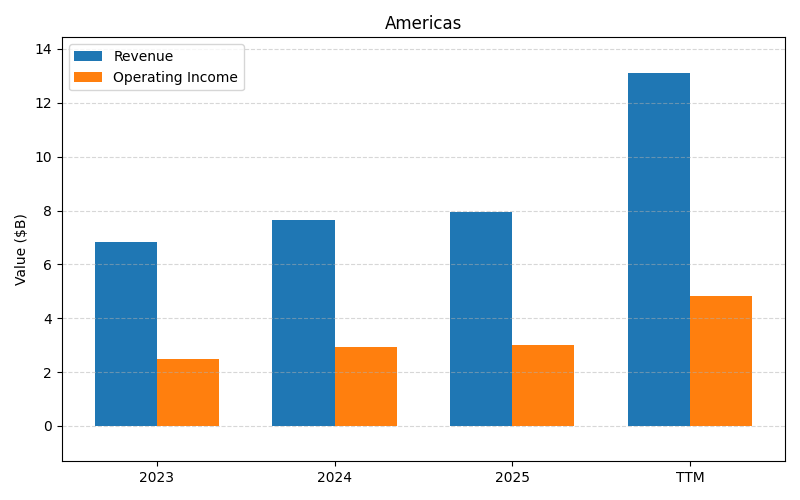
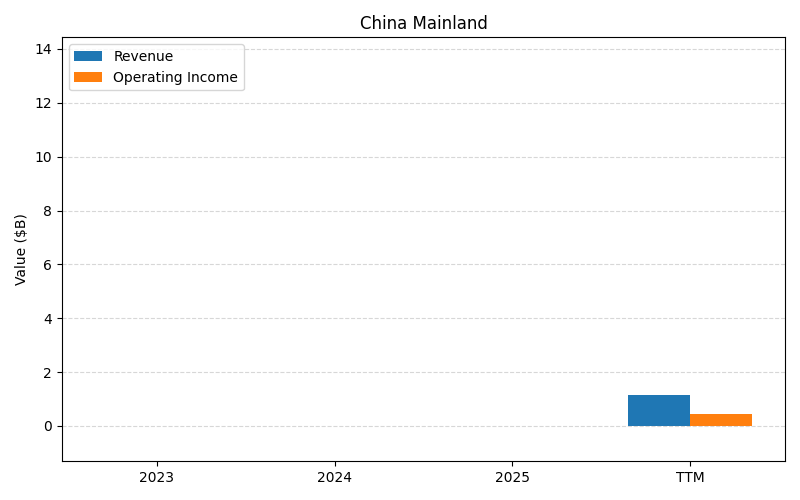
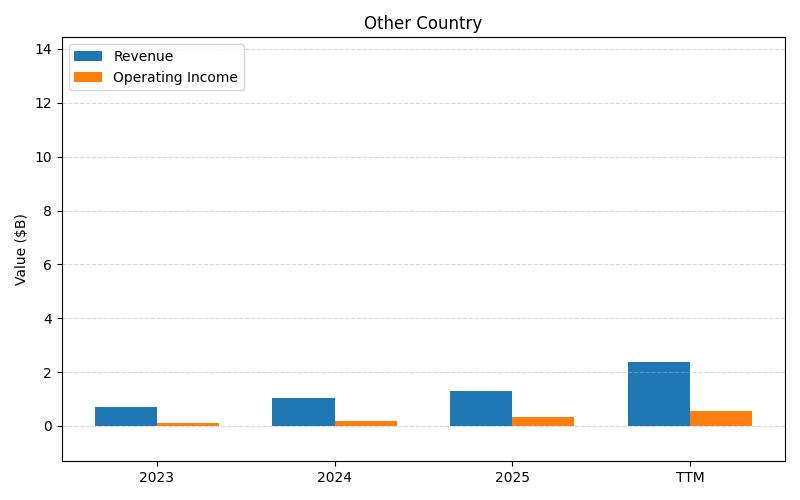
SEGMENTS v2025-09-09 · 2026-05-29 09:11 UTC — Units: $B. Rows list fiscal years (last 3 + TTM) with revenue and operating income for each segment; the final row shows the TTM revenue mix (operating income columns display “—” where mix is not applicable).
| Year | Americas Rev | Americas OI | China Mainland Rev | China Mainland OI | Other Country Rev | Other Country OI | Total Rev | Total OI |
|---|---|---|---|---|---|---|---|---|
| 2024 | 7.63B | 2.94B | 0.96B | 0.34B | 1.02B | 0.20B | 9.62B | 3.48B |
| 2025 | 7.93B | 3.02B | 1.36B | 0.51B | 1.30B | 0.31B | 10.6B | 3.84B |
| 2026 | 7.85B | 2.56B | 1.75B | 0.70B | 1.50B | 0.35B | 11.1B | 3.61B |
| TTM | 29.6B | 10.4B | 6.06B | 2.32B | 5.45B | 1.26B | 41.1B | 14B |
| % of Total (TTM) | 72.0% | — | 14.8% | — | 13.3% | — | 100% | — |
Balance Sheet
| Metric | Value | |
|---|---|---|
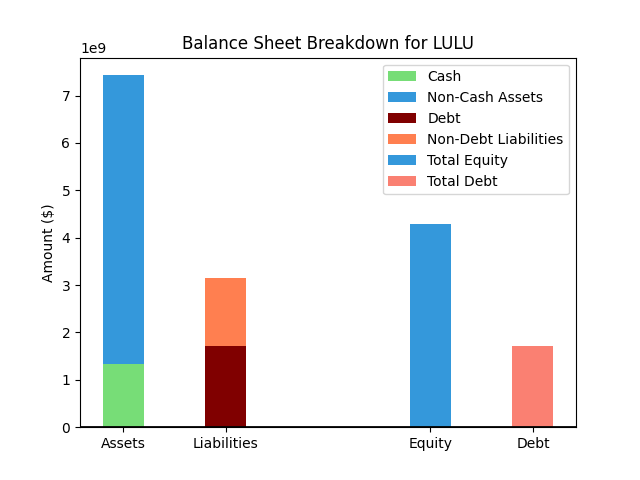
| 0 | Total Assets | $8,457M |
| 1 | Cash | $1,807M |
| 2 | Total Liabilities | $3,495M |
| 3 | Total Debt | $1,798M |
| 4 | Total Equity | $4,962M |
| 5 | Debt to Equity Ratio | 0.36 |
EPS & Dividend

Valuation
| Share Price | Treasury Yield | Estimates | Fair Value (P/E) | Fair Value (P/S) | Current P/S | Current P/E |
|---|---|---|---|---|---|---|
| $131.18 | 4.5% | FINVIZ Growth: 3% | Nicks: 6 Finviz: 8 |
Nick's: 0.000 | 1.4 | 9.9 |
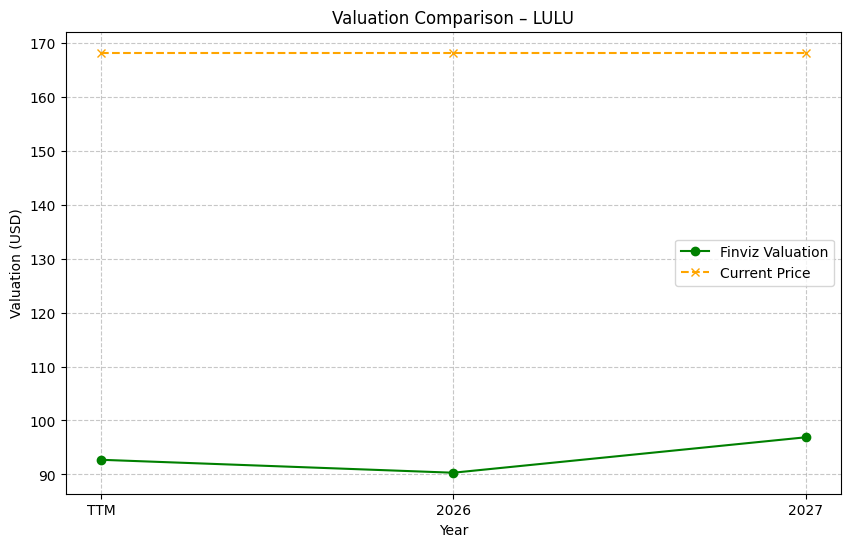
| Basis | Year | Nicks Valuation | Nicks vs Share Price | Finviz Valuation | Finviz vs Share Price |
|---|---|---|---|---|---|
| $13.26 EPS | TTM | $84.08 | -35.9% | $111.11 | -15.3% |
| $12.28 EPS | 2027 | $77.87 | -40.6% | $102.89 | -21.6% |
| $13.29 EPS | 2028 | $84.25 | -35.8% | $111.33 | -15.1% |
Implied Growth
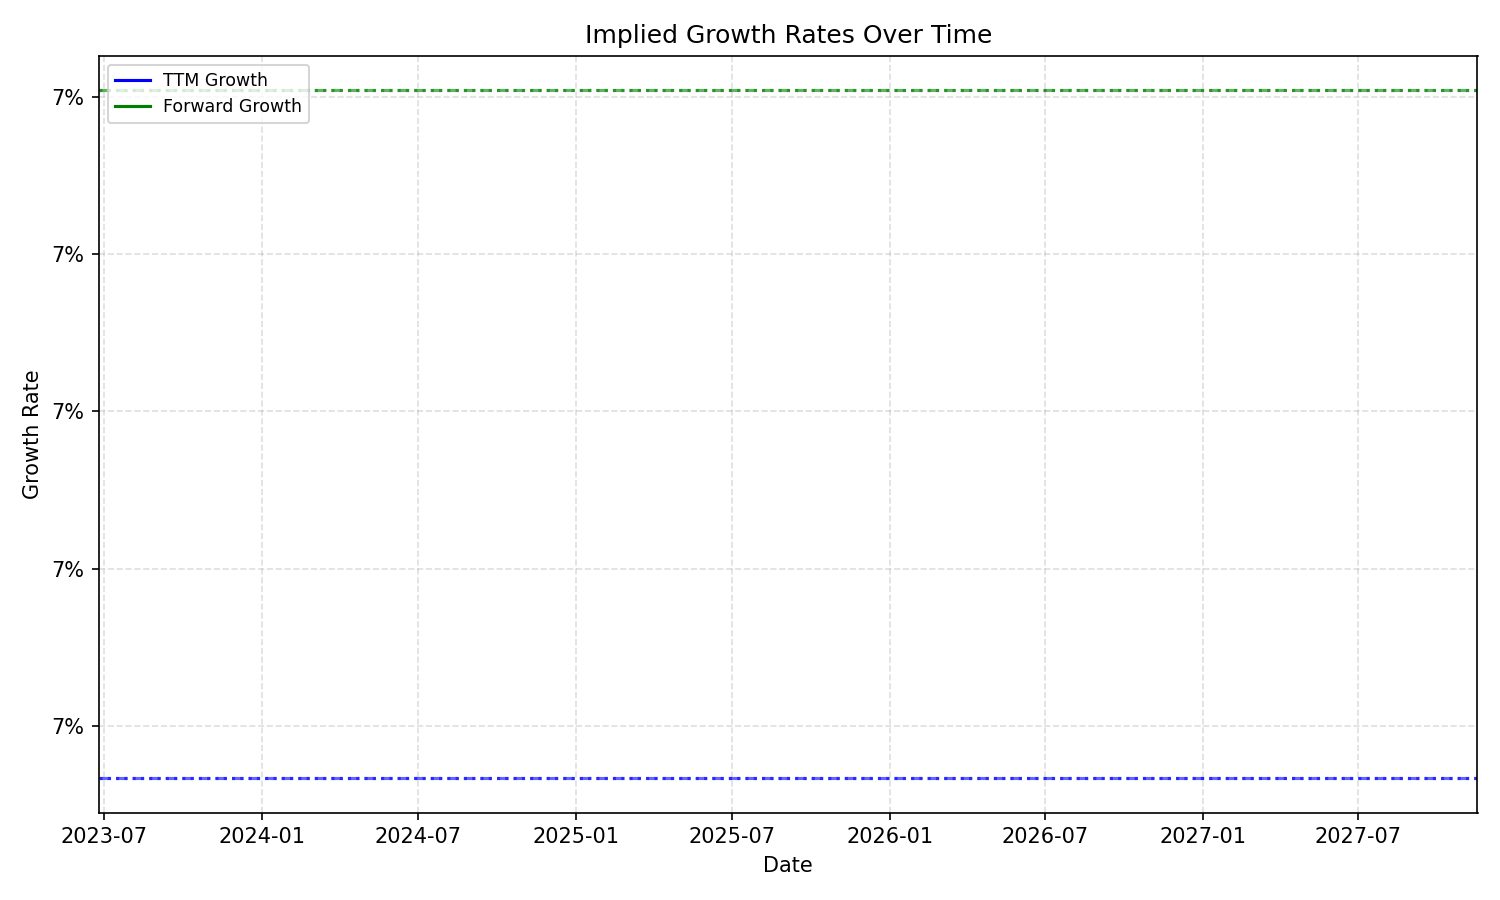
| Average | Median | Std Dev | Current | Percentile | ||||||
|---|---|---|---|---|---|---|---|---|---|---|
| TTM | Forward | TTM | Forward | TTM | Forward | TTM | Forward | TTM | Forward | |
| Timeframe | ||||||||||
| 1 Year | 5.61% | 5.80% | 5.69% | 5.73% | 0.82% | 1.14% | 4.36% | 4.41% | 10.4% | 11.0% |
| 3 Years | 5.61% | 5.80% | 5.69% | 5.73% | 0.82% | 1.14% | 4.36% | 4.41% | 10.4% | 11.0% |
| 5 Years | 5.61% | 5.80% | 5.69% | 5.73% | 0.82% | 1.14% | 4.36% | 4.41% | 10.4% | 11.0% |
| 10 Years | 5.61% | 5.80% | 5.69% | 5.73% | 0.82% | 1.14% | 4.36% | 4.41% | 10.4% | 11.0% |