Lam Research Corporation — LRCX
| Close Price | Market Cap | P/E Ratio | Forward P/E Ratio | Implied Growth* | Implied Forward Growth* | Dividend | P/B Ratio |
|---|---|---|---|---|---|---|---|
| $318.18 | $397.91B | 60.3 | 40.1 | 24.1% | 19.3% | $1.04 0.3% | 37.6 |
Latest Headlines
- · This Risk ETF Is Riding Its Best Seven-Day Stretch in a Year
- · Qualcomm (QCOM) Up 35.5% Since Last Earnings Report: Can It Continue?
- · Stock Indexes Rally to Record Highs on Peace Deal Hopes and AI Spending
- · After Three Years of Tracking the AI Capex Cycle These 3 Semiconductor ETFs Sit on Top of the Trade
- · Is Applied Materials Stock Outperforming the Nasdaq?
- · The AI Memory Shortage Is Just Getting Started and These 3 ETFs Own Every Layer of the Supply Chain
Revenue & Net Income
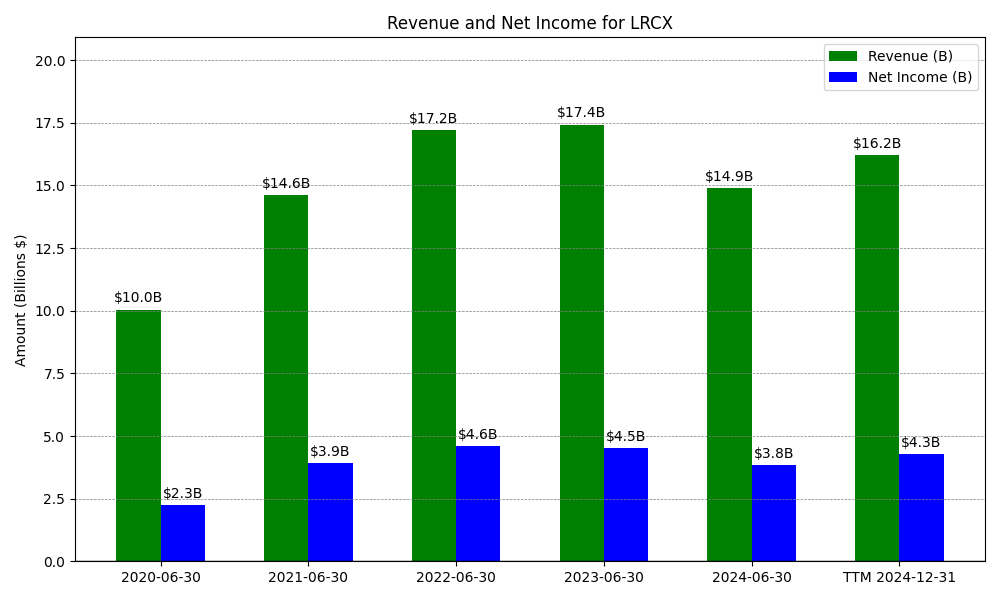
| Date | Revenue | Net_Income | EPS | Last_Updated | Revenue_Change | Net_Income_Change | EPS_Change | |
|---|---|---|---|---|---|---|---|---|
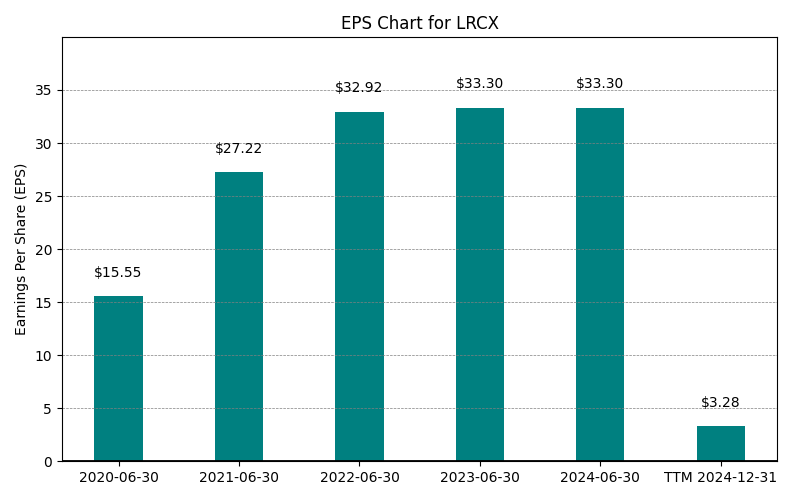
| 0 | 2020-06-30 | $10,045M | $2,252M | $15.55 | 2024-02-04 04:18:33 | N/A | N/A | N/A |
| 1 | 2021-06-30 | $14,626M | $3,908M | $27.22 | 2024-02-04 04:18:33 | 45.6% | 73.6% | 75.0% |
| 2 | 2022-06-30 | $17,227M | $4,605M | $3.29 | 2026-05-29 09:10:50 | 17.8% | 17.8% | -87.9% |
| 3 | 2023-06-30 | $17,429M | $4,511M | $3.33 | 2026-05-29 09:10:50 | 1.2% | -2.0% | 1.2% |
| 4 | 2024-06-30 | $14,905M | $3,828M | $2.91 | 2026-05-29 09:10:50 | -14.5% | -15.1% | -12.5% |
| 5 | 2025-06-30 | $18,436M | $5,358M | $4.17 | 2026-05-29 09:10:50 | 23.7% | 40.0% | 43.2% |
| 6 | TTM 2026-03-31 | $21,682M | $6,708M | $5.28 | 2026-04-24 08:46:04 | 17.6% | 25.2% | 26.6% |
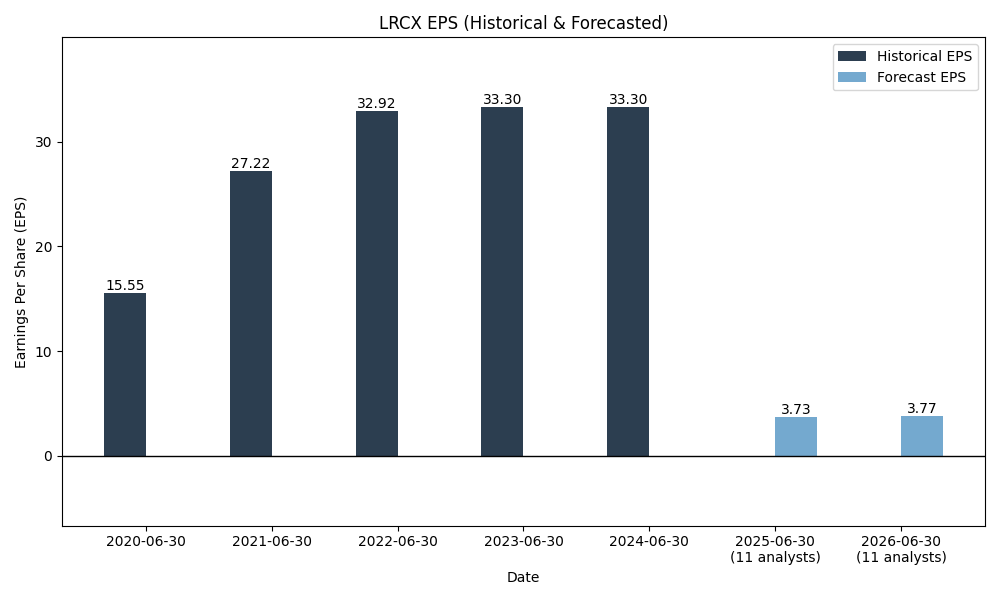
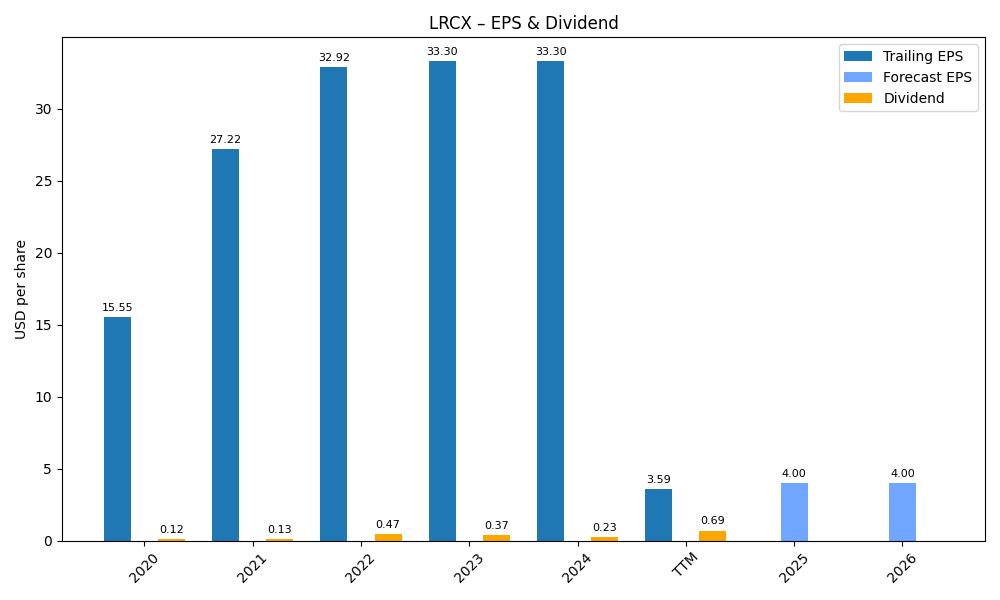
EPS
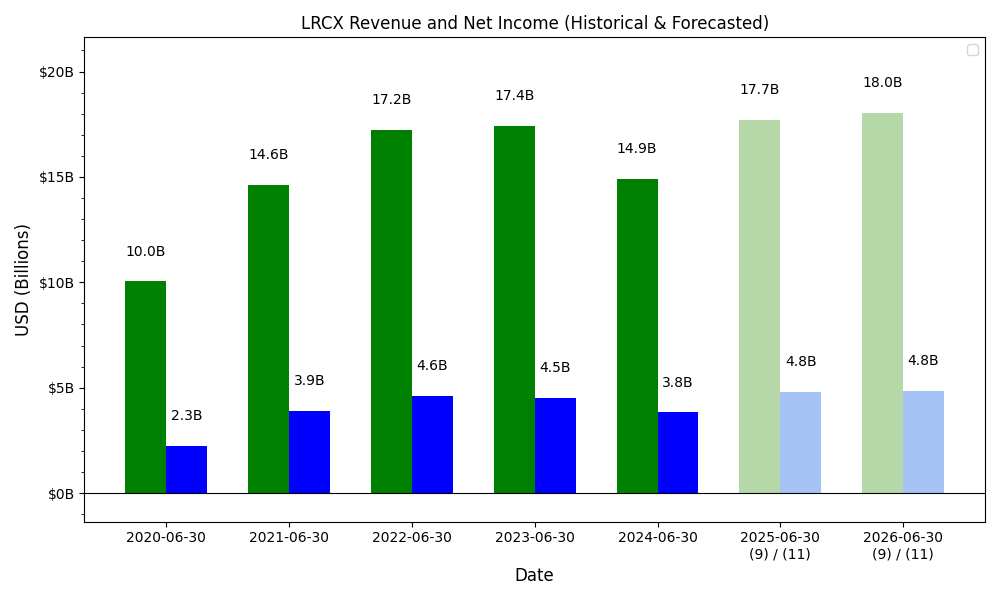
Forecasts
Y/Y % Change
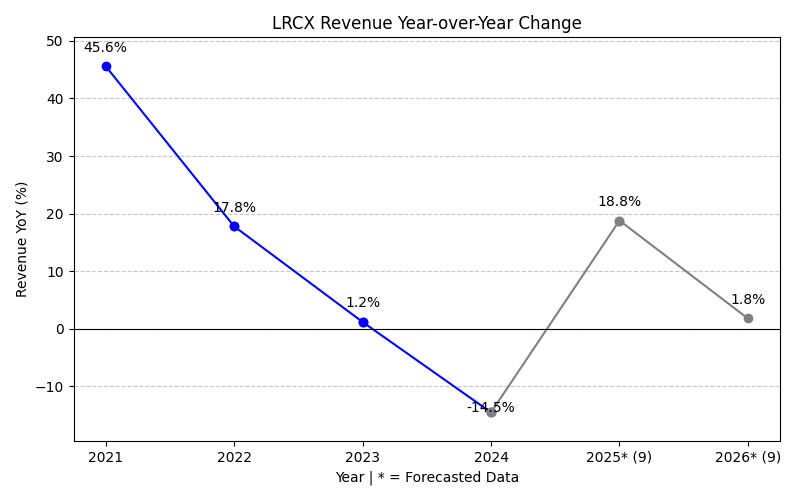
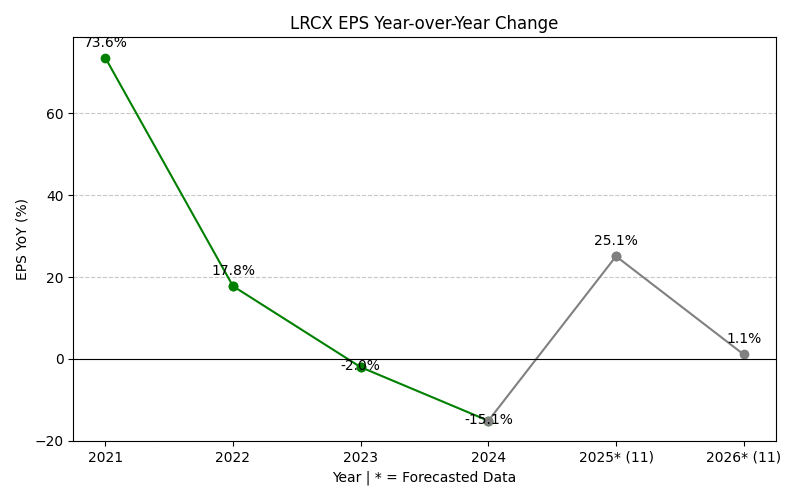
LRCX Year-over-Year Growth
| 2020 | 2021 | 2022 | 2023 | 2024 | 2025 | 2026 | 2027 | Average | |
|---|---|---|---|---|---|---|---|---|---|
| Revenue Growth (%) | 45.6% | 17.8% | 1.2% | -14.5% | 23.7% | 25.7% | 31.6% | 18.7% | |
| Revenue Analysts (#) | 0 | 0 | 0 | 0 | 0 | 0 | 33 | 32 | |
| EPS Growth (%) | 73.6% | 17.8% | -2.0% | -15.1% | 40.0% | 32.5% | 40.0% | 26.7% | |
| EPS Analysts (#) | 0 | 0 | 0 | 0 | 0 | 0 | 34 | 33 |
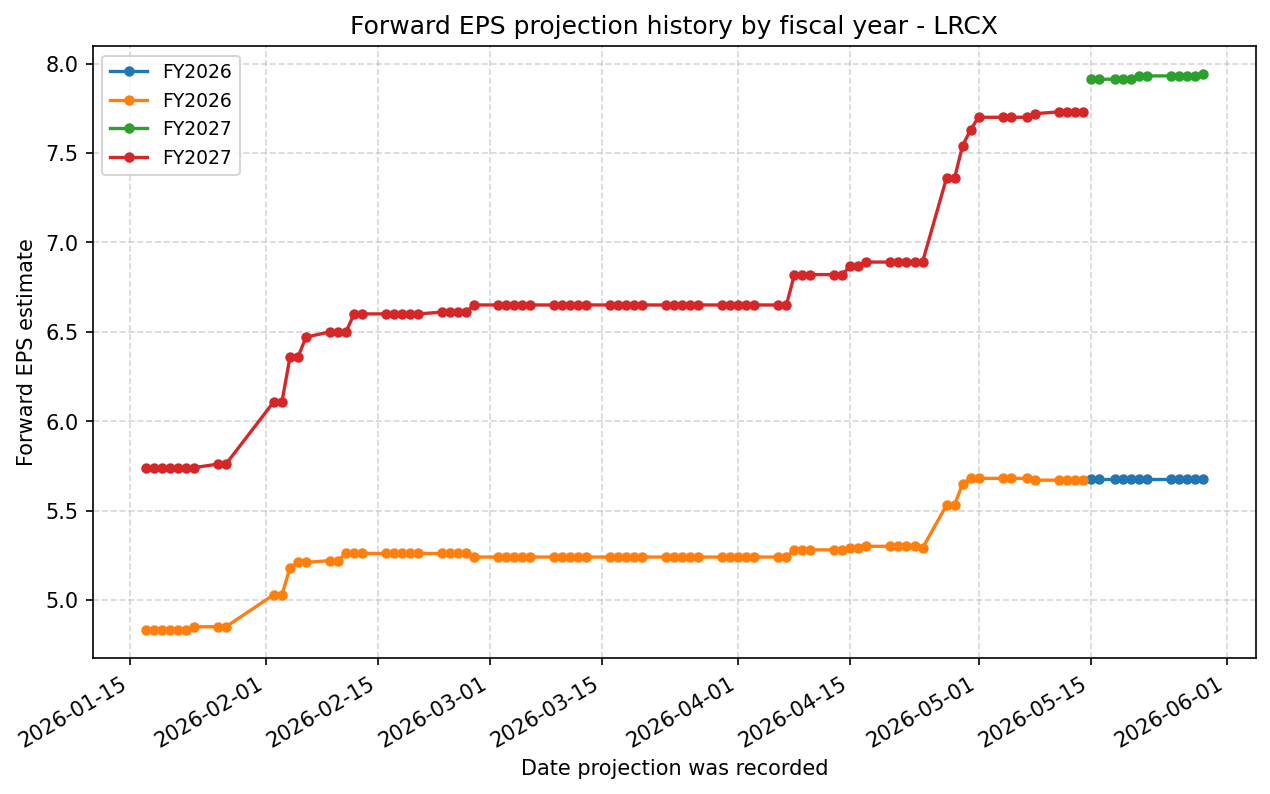
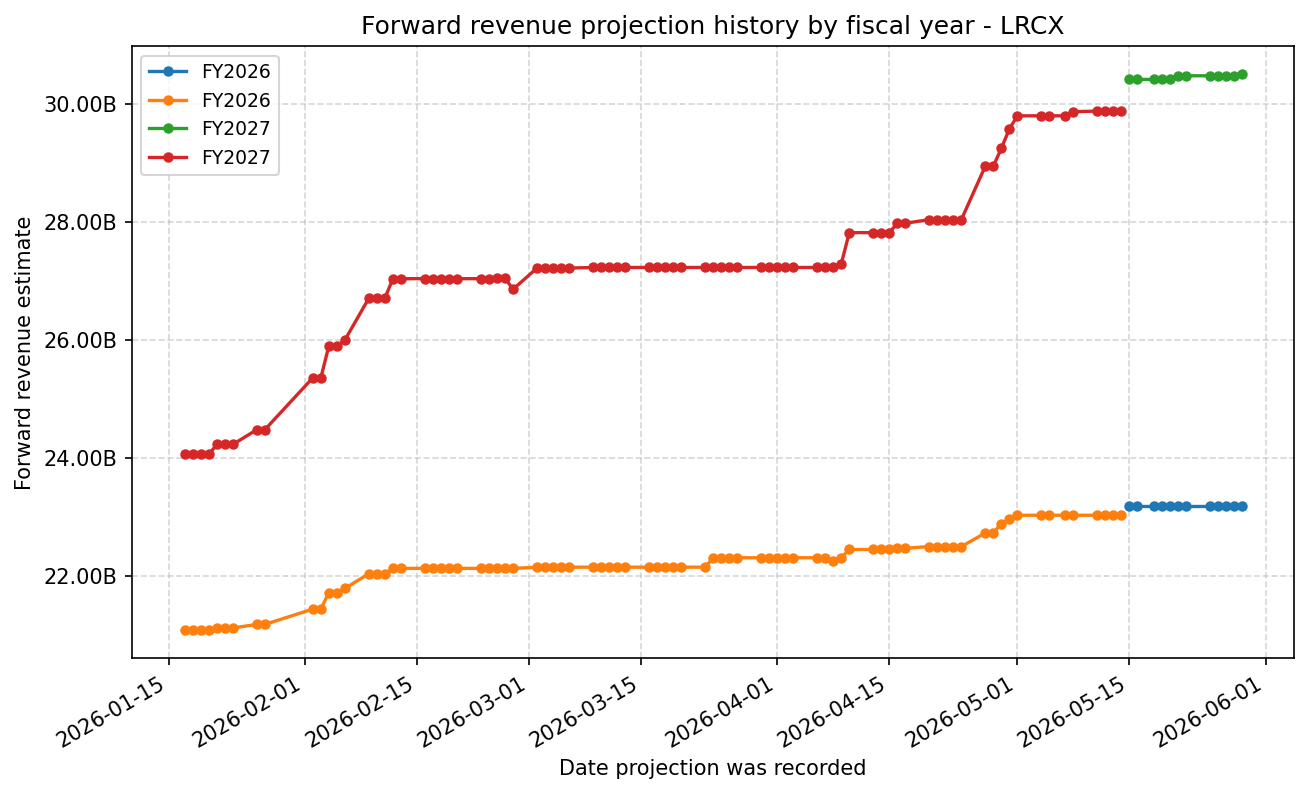
Forward Estimate History
How the next-FY EPS and revenue estimates have drifted over time. One line per fiscal year – past lines end when that FY became current.
Expenses
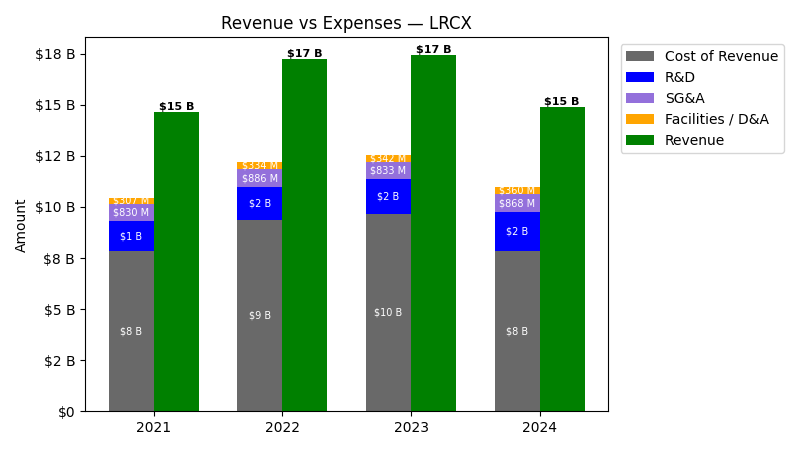
| Year | Revenue ($) | Cost of Revenue ($) | R&D ($) | SG&A ($) | Facilities / D&A ($) |
|---|---|---|---|---|---|
| 2021 | $14.6B | $7.5B | $1.5B | $829.9M | $307.2M |
| 2022 | $17.2B | $9.0B | $1.6B | $885.7M | $333.7M |
| 2023 | $17.4B | $9.3B | $1.7B | $832.8M | $342.4M |
| 2024 | $14.9B | $7.5B | $1.9B | $868.2M | $359.7M |
| 2025 | $18.4B | $9.1B | $2.1B | $981.7M | $386.3M |
| TTM | $21.7B | $10.4B | $2.3B | $1.1B | $420.3M |
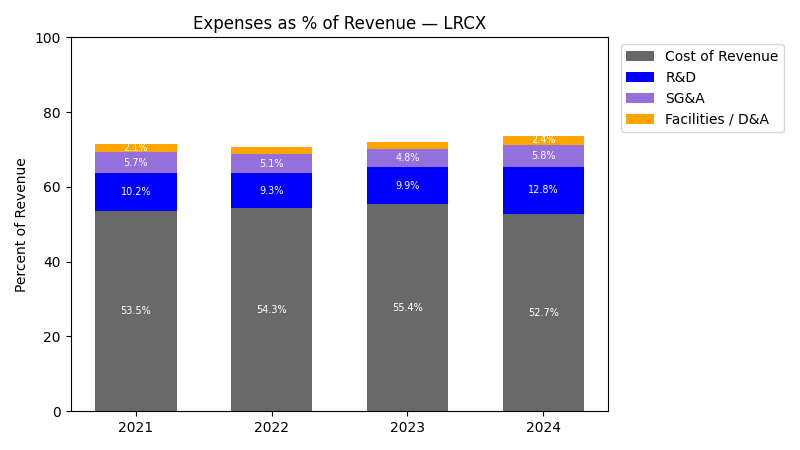
| Year | Revenue Change (%) | Cost of Revenue Change (%) | R&D Change (%) | SG&A Change (%) | Facilities / D&A Change (%) |
|---|---|---|---|---|---|
| 2022 | 17.78 | 20.07 | 7.42 | 6.73 | 8.66 |
| 2023 | 1.17 | 3.19 | 7.66 | -5.98 | 2.60 |
| 2024 | -14.48 | -19.51 | 10.15 | 4.26 | 5.04 |
| 2025 | 23.68 | 21.05 | 10.19 | 13.07 | 7.39 |
| TTM | 17.61 | 14.94 | 10.34 | 11.61 | 8.82 |
No unmapped expenses.
Segment Performance
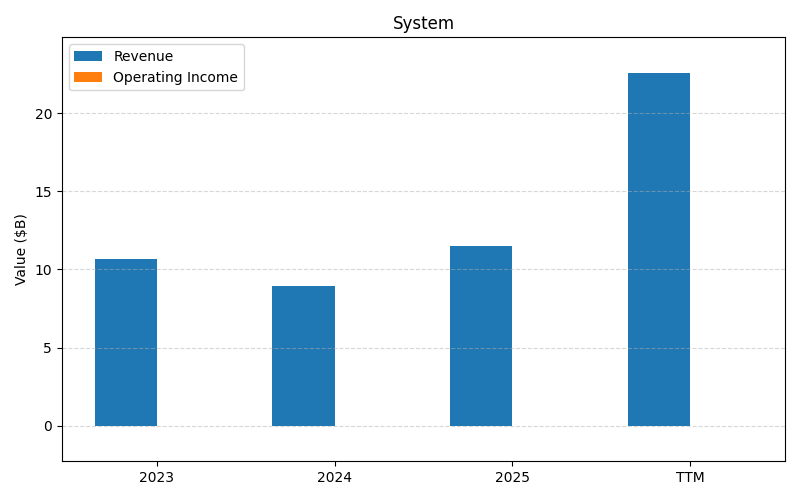
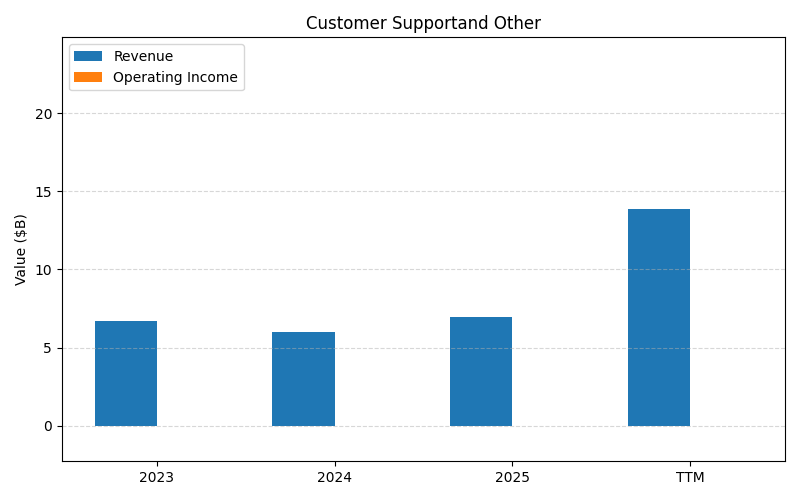
SEGMENTS v2025-09-09 · 2026-05-29 09:10 UTC — Units: $B. Rows list fiscal years (last 3 + TTM) with revenue for each segment; the final row shows the TTM revenue mix (operating income columns display “—” where mix is not applicable).
| Year | System Rev | Customer Supportand Other Rev | Total Rev |
|---|---|---|---|
| 2023 | 10.7B | 6.73B | 17.4B |
| 2024 | 8.92B | 5.98B | 14.9B |
| 2025 | 11.5B | 6.94B | 18.4B |
| TTM | 45.9B | 27.8B | 73.7B |
| % of Total (TTM) | 62.3% | 37.7% | 100% |
Balance Sheet
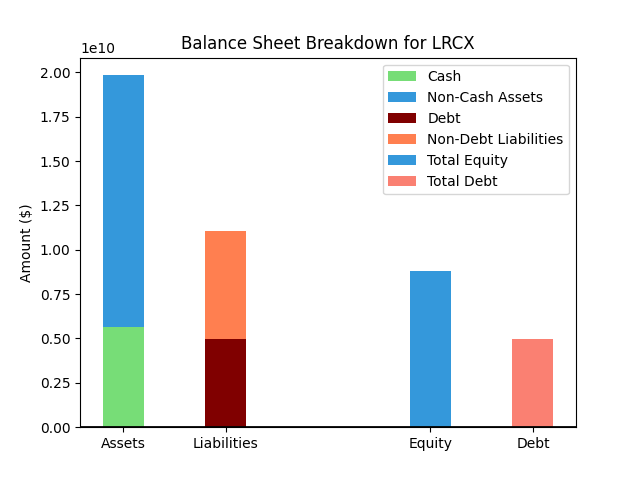
| Metric | Value | |
|---|---|---|
| 0 | Total Assets | $20,792M |
| 1 | Cash | $4,751M |
| 2 | Total Liabilities | $10,207M |
| 3 | Total Debt | $3,734M |
| 4 | Total Equity | $10,585M |
| 5 | Debt to Equity Ratio | 0.35 |
EPS & Dividend
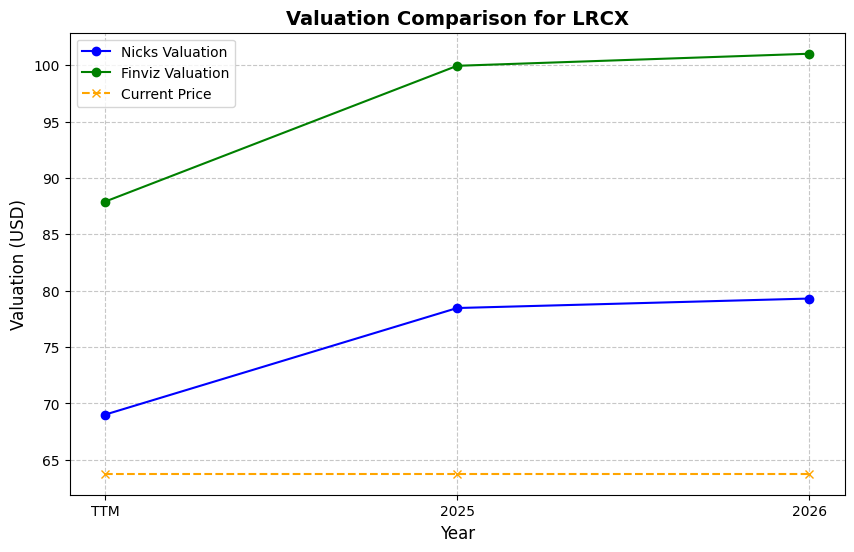
Valuation
| Share Price | Treasury Yield | Estimates | Fair Value (P/E) | Fair Value (P/S) | Current P/S | Current P/E |
|---|---|---|---|---|---|---|
| $318.18 | 4.5% | Nicks Growth: 12% Nick's Expected Margin: 25% FINVIZ Growth: 33% |
Nicks: 21 Finviz: 119 |
Nick's: 5.175 | 18.4 | 60.3 |
| Basis | Year | Nicks Valuation | Nicks vs Share Price | Finviz Valuation | Finviz vs Share Price |
|---|---|---|---|---|---|
| $5.28 EPS | TTM | $109.30 | -65.6% | $628.09 | 97.4% |
| $5.67 EPS | 2026 | $117.48 | -63.1% | $675.08 | 112.2% |
| $7.94 EPS | 2027 | $164.41 | -48.3% | $944.79 | 196.9% |
Implied Growth
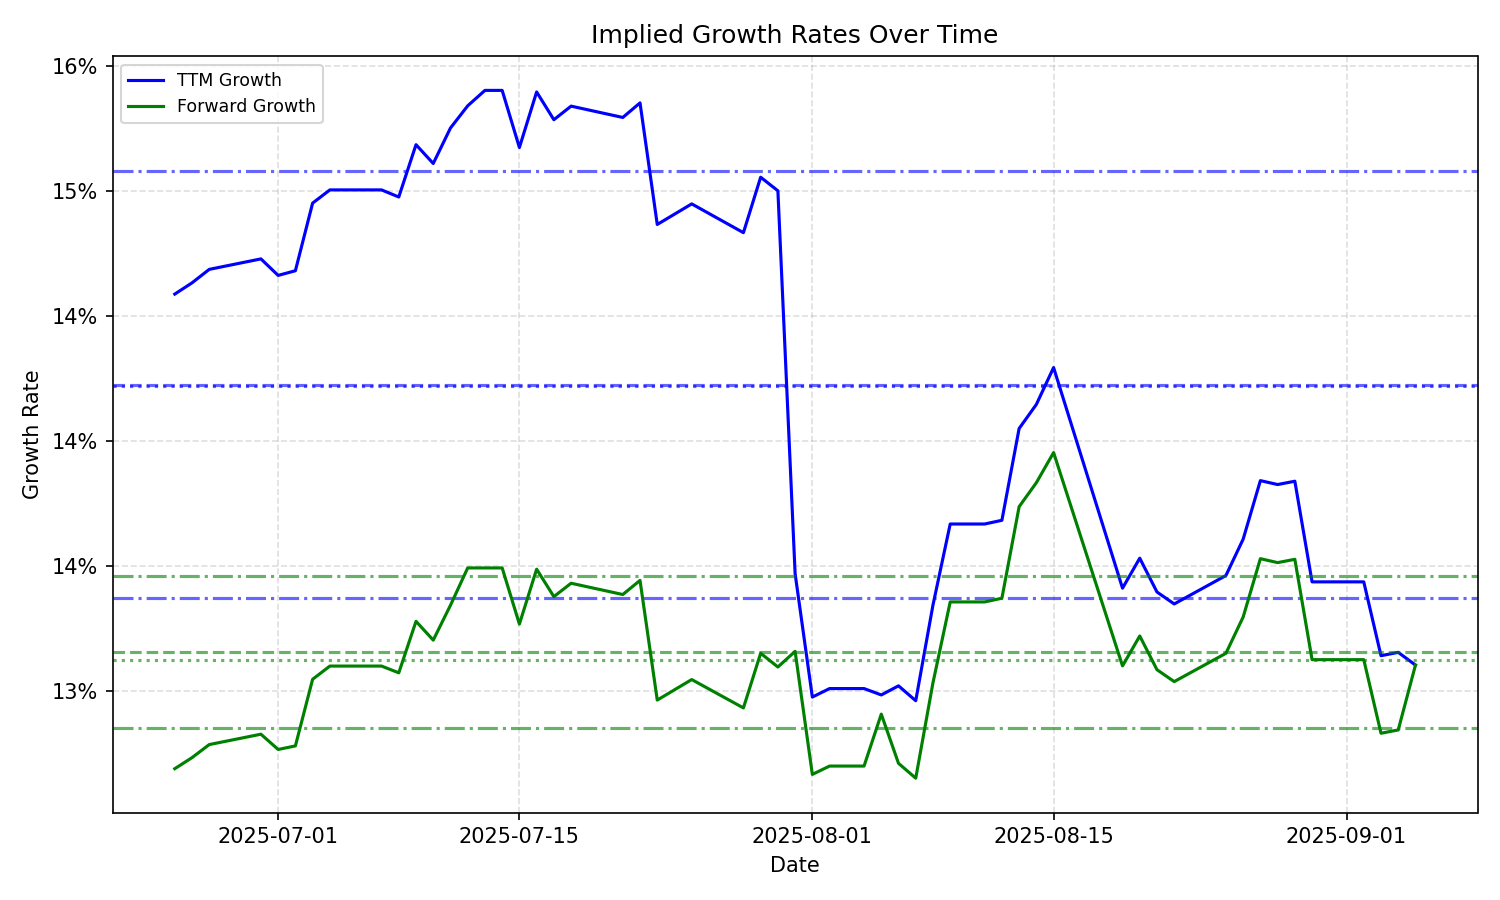
| Average | Median | Std Dev | Current | Percentile | ||||||
|---|---|---|---|---|---|---|---|---|---|---|
| TTM | Forward | TTM | Forward | TTM | Forward | TTM | Forward | TTM | Forward | |
| Timeframe | ||||||||||
| 1 Year | 18.15% | 16.20% | 17.54% | 16.81% | 3.22% | 2.04% | 24.12% | 19.34% | 99.2% | 99.2% |
| 3 Years | 18.15% | 16.20% | 17.54% | 16.81% | 3.22% | 2.04% | 24.12% | 19.34% | 99.2% | 99.2% |
| 5 Years | 18.15% | 16.20% | 17.54% | 16.81% | 3.22% | 2.04% | 24.12% | 19.34% | 99.2% | 99.2% |
| 10 Years | 18.15% | 16.20% | 17.54% | 16.81% | 3.22% | 2.04% | 24.12% | 19.34% | 99.2% | 99.2% |