Lockheed Martin Corporation — LMT
| Close Price | Market Cap | P/E Ratio | Forward P/E Ratio | Implied Growth* | Implied Forward Growth* | Dividend | P/B Ratio |
|---|---|---|---|---|---|---|---|
| $530.45 | $122.30B | 25.7 | 16.5 | 14.4% | 9.6% | $13.80 2.6% | 16.3 |
Latest Headlines
- · 2 Large-Cap Stocks to Target This Week and 1 We Ignore
- · Are Options Traders Betting on a Big Move in Lockheed Martin Stock?
- · Trump Holds the Line on Iran: No Sanctions Relief as Oil Slides Below $89
- · Lockheed Martin vs. Boeing: Which Industrials Stock Is a Better Buy in 2026?
- · RTX Is Set to Revolutionize Munitions Manufacturing
- · Lockheed Martin Javelin Launcher Delivery Highlights Valuation Gap And Growth Watchpoints
Revenue & Net Income
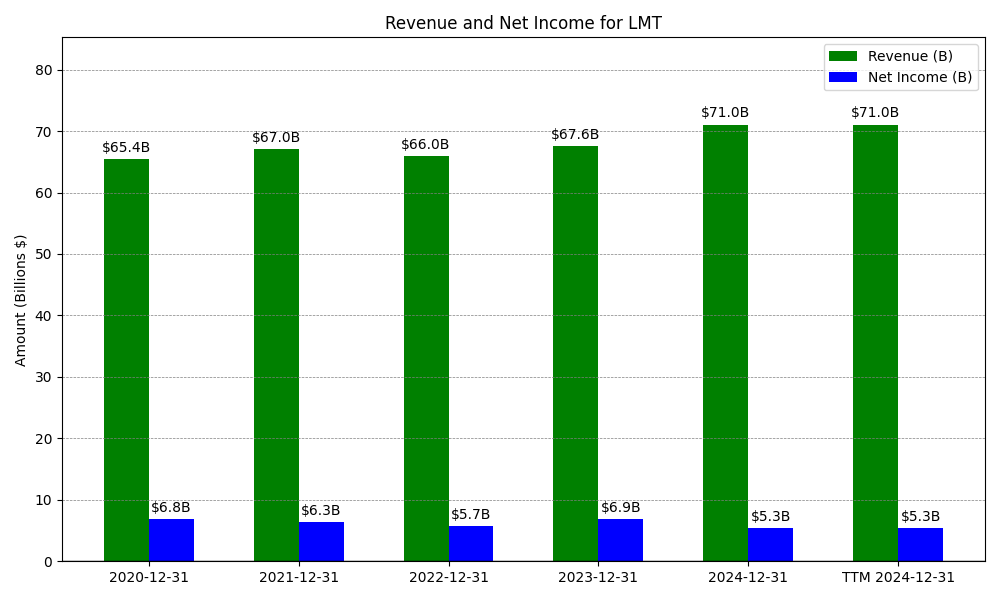
| Date | Revenue | Net_Income | EPS | Last_Updated | Revenue_Change | Net_Income_Change | EPS_Change | |
|---|---|---|---|---|---|---|---|---|
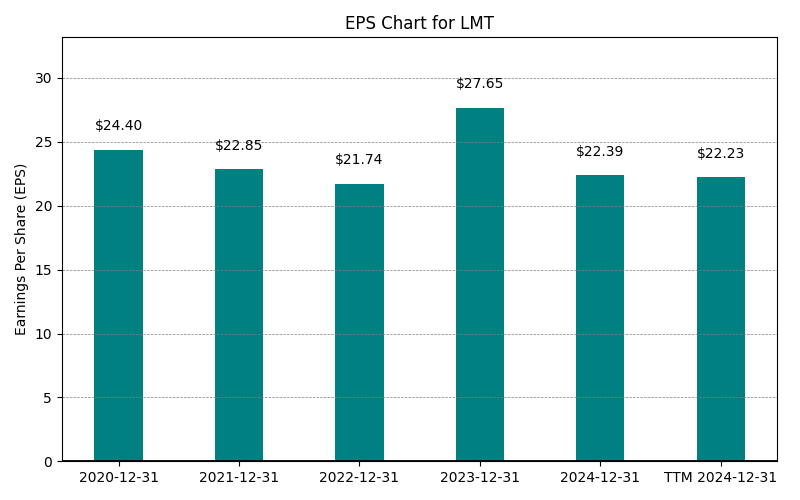
| 0 | 2020-12-31 | $65,398M | $6,833M | $24.40 | 2024-02-09 04:07:11 | N/A | N/A | N/A |
| 1 | 2021-12-31 | $67,044M | $6,315M | $22.85 | 2024-02-09 04:07:11 | 2.5% | -7.6% | -6.4% |
| 2 | 2022-12-31 | $65,984M | $5,732M | $21.74 | 2026-05-29 09:10:44 | -1.6% | -9.2% | -4.9% |
| 3 | 2023-12-31 | $67,571M | $6,920M | $27.65 | 2026-05-29 09:10:44 | 2.4% | 20.7% | 27.2% |
| 4 | 2024-12-31 | $71,043M | $5,336M | $22.39 | 2026-05-29 09:10:44 | 5.1% | -22.9% | -19.0% |
| 5 | 2025-12-31 | $75,048M | $5,017M | $21.56 | 2026-05-29 09:10:44 | 5.6% | -6.0% | -3.7% |
| 6 | TTM 2026-03-31 | $75,106M | $4,793M | $20.63 | 2026-04-27 08:54:47 | 0.1% | -4.5% | -4.3% |
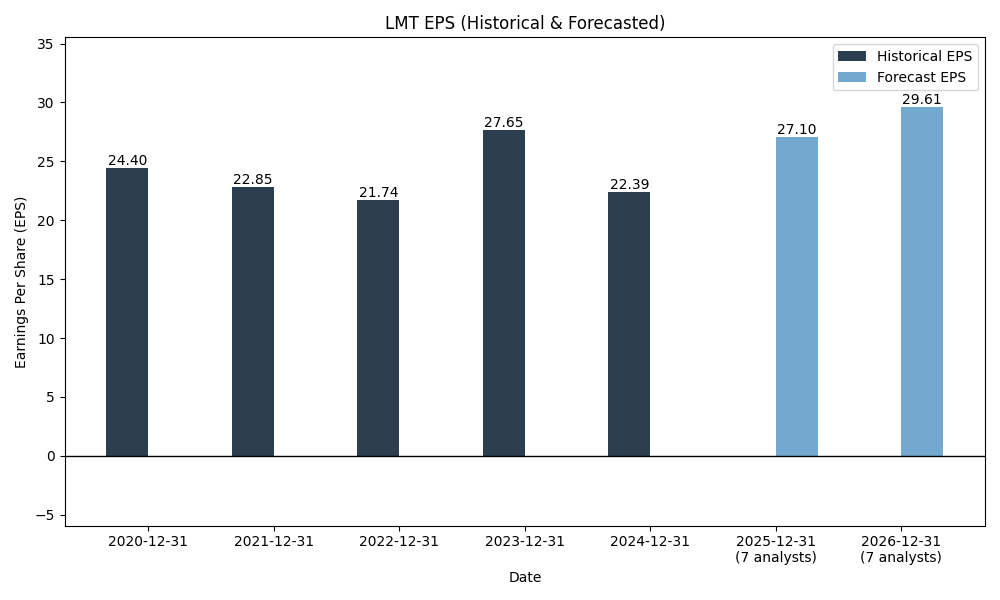
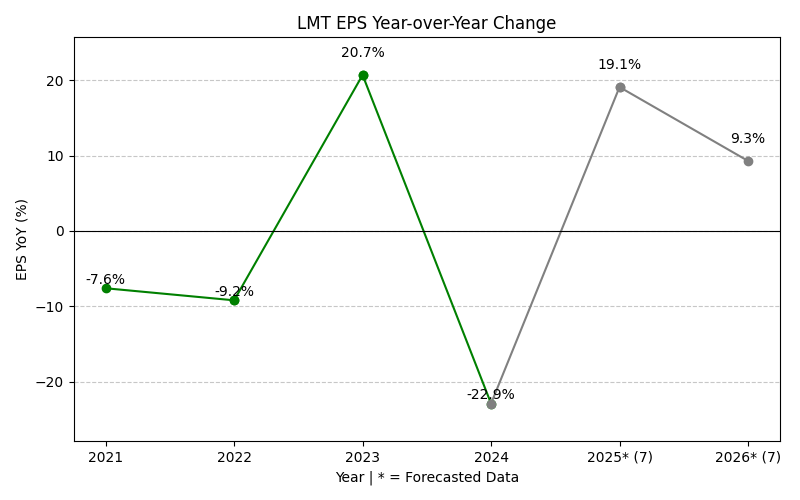
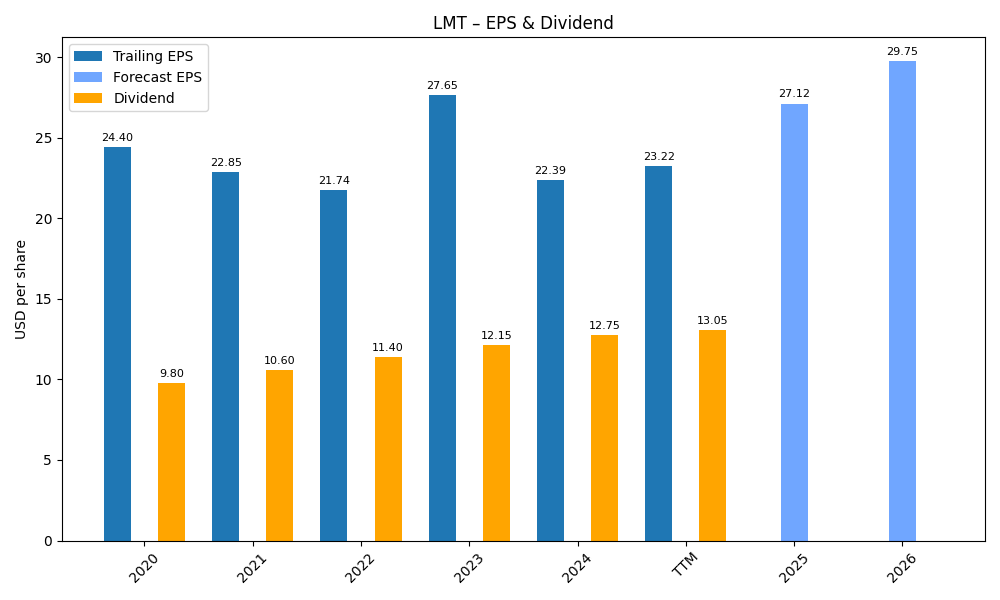
EPS
Forecasts
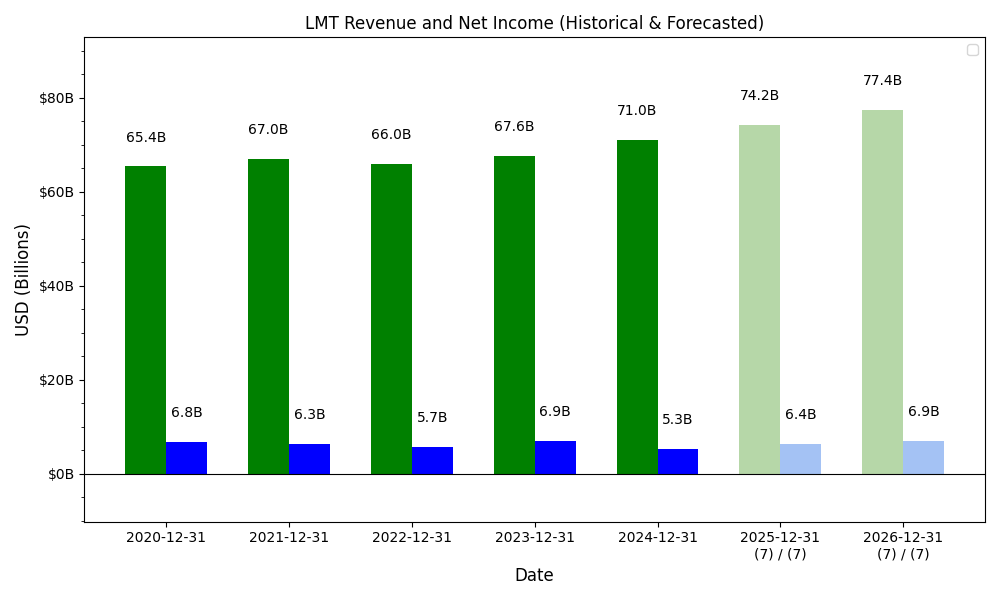
Y/Y % Change
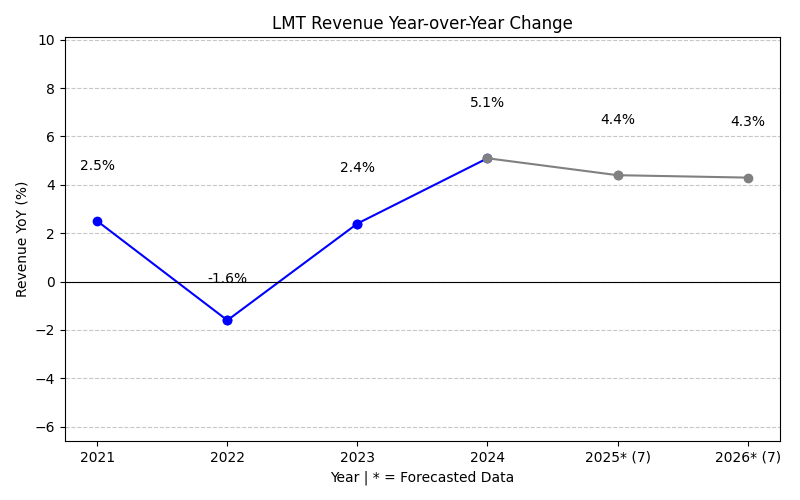
LMT Year-over-Year Growth
| 2020 | 2021 | 2022 | 2023 | 2024 | 2025 | 2026 | 2027 | Average | |
|---|---|---|---|---|---|---|---|---|---|
| Revenue Growth (%) | 2.5% | -1.6% | 2.4% | 5.1% | 5.6% | 5.4% | 5.3% | 3.5% | |
| Revenue Analysts (#) | 0 | 0 | 0 | 0 | 0 | 0 | 21 | 21 | |
| EPS Growth (%) | -7.6% | -9.2% | 20.7% | -22.9% | -6.0% | 37.4% | 7.4% | 2.8% | |
| EPS Analysts (#) | 0 | 0 | 0 | 0 | 0 | 0 | 20 | 20 |
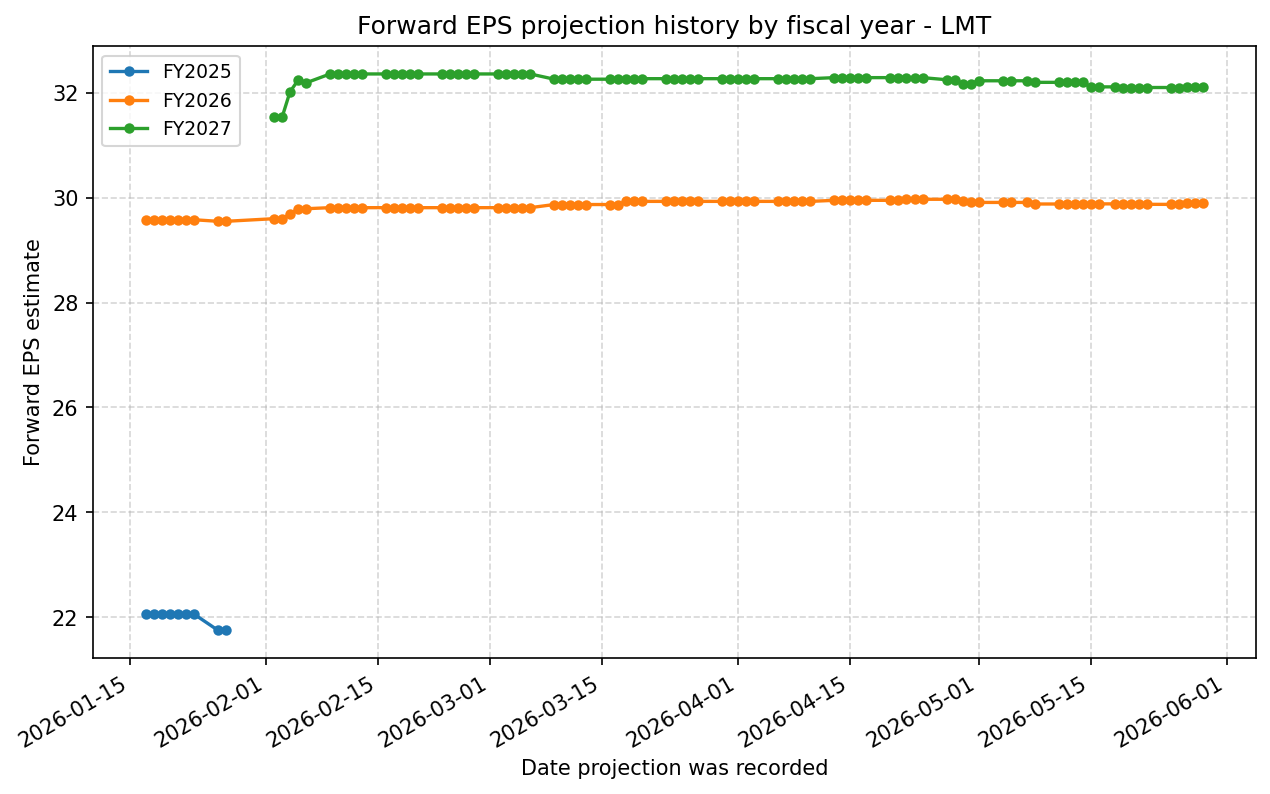
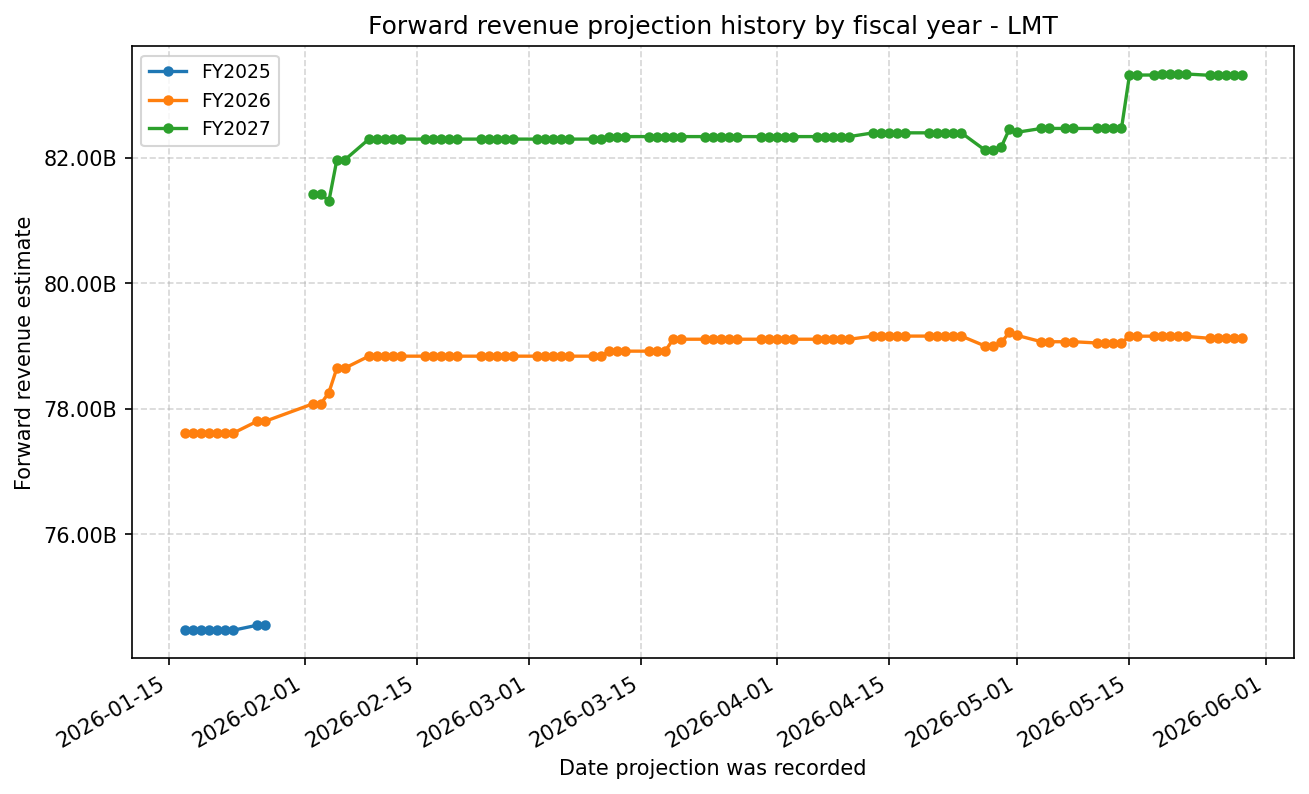
Forward Estimate History
How the next-FY EPS and revenue estimates have drifted over time. One line per fiscal year – past lines end when that FY became current.
Expenses
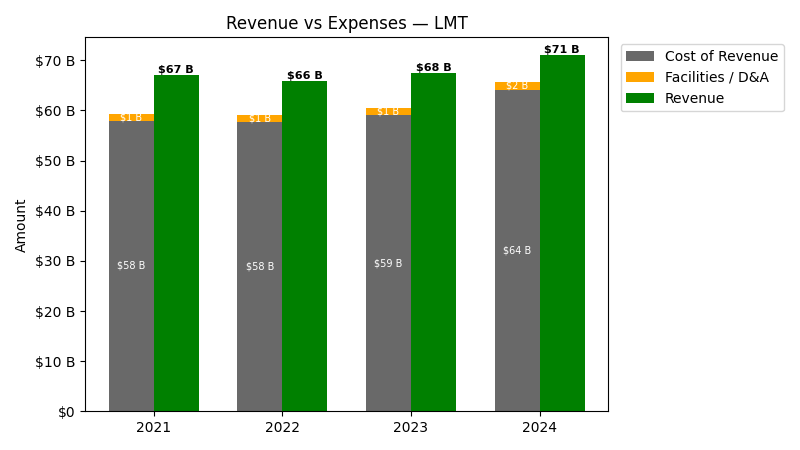
| Year | Revenue ($) | Cost of Revenue ($) | G&A ($) | SG&A ($) | Facilities / D&A ($) | Personnel ($) |
|---|---|---|---|---|---|---|
| 2022 | $66.0B | $56.3B | $1.4B | |||
| 2023 | $67.6B | $57.7B | $1.4B | |||
| 2024 | $71.0B | $62.6B | $1.6B | |||
| 2025 | $75.0B | $65.7B | $1.7B | |||
| TTM | $75.1B | $66.0B | $99.0M | $99.0M | $1.7B | $99.0M |
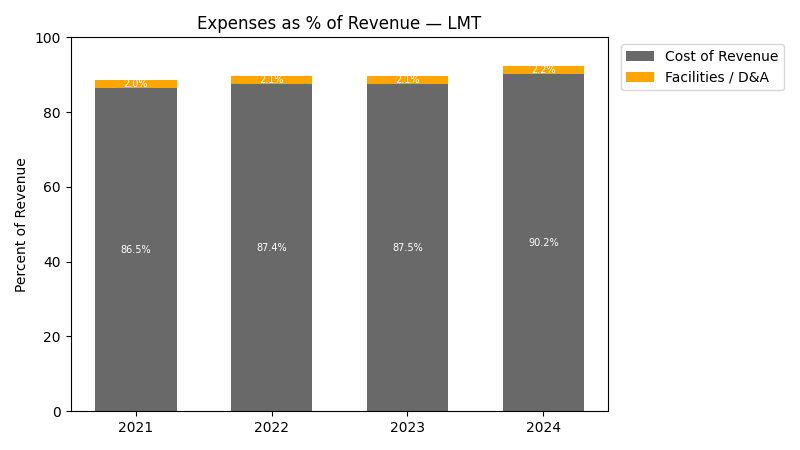
| Year | Revenue Change (%) | Cost of Revenue Change (%) | Facilities / D&A Change (%) |
|---|---|---|---|
| 2023 | 2.41 | 2.43 | 1.85 |
| 2024 | 5.14 | 8.48 | 9.02 |
| 2025 | 5.64 | 5.10 | 8.21 |
| TTM | 0.08 | 0.46 | 0.06 |
No unmapped expenses.
Segment Performance
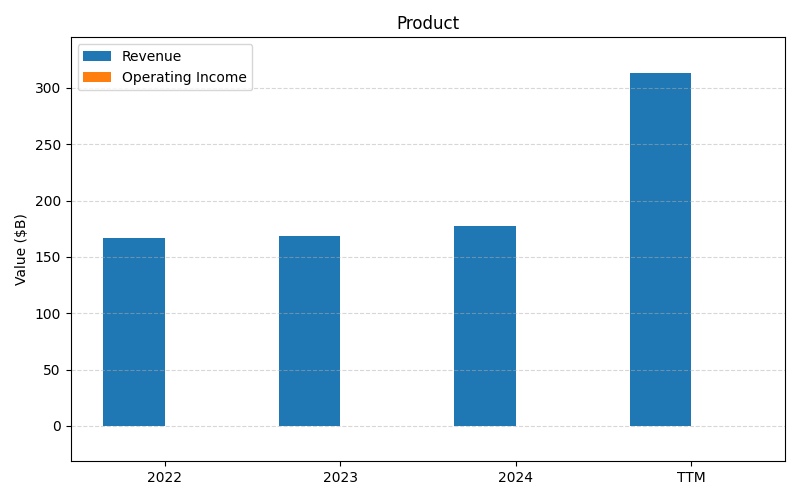
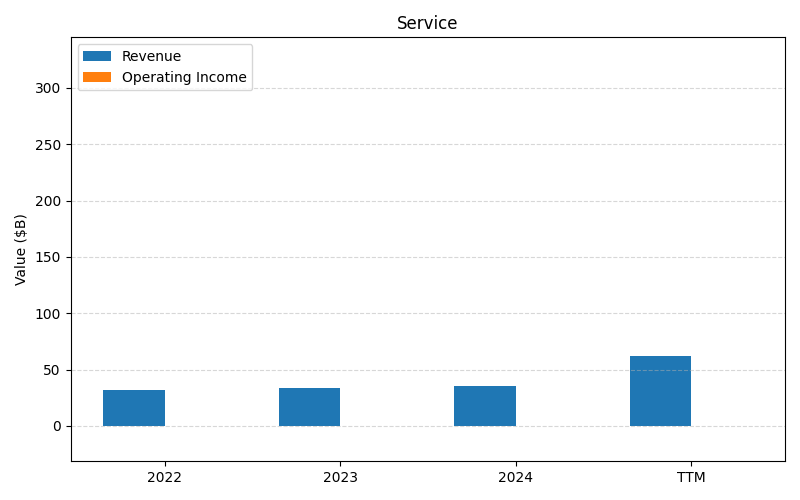
SEGMENTS v2025-09-09 · 2026-05-29 09:10 UTC — Units: $B. Rows list fiscal years (last 3 + TTM) with revenue for each segment; the final row shows the TTM revenue mix (operating income columns display “—” where mix is not applicable).
| Year | Prod Rev | Services Rev | Total Rev |
|---|---|---|---|
| 2023 | 168.8B | 33.9B | 202.7B |
| 2024 | 177.8B | 35.3B | 213.1B |
| 2025 | 188B | 37.2B | 225.1B |
| TTM | 455.1B | 91.1B | 546.2B |
| % of Total (TTM) | 83.3% | 16.7% | 100% |
Segment Performance (Axis 2)
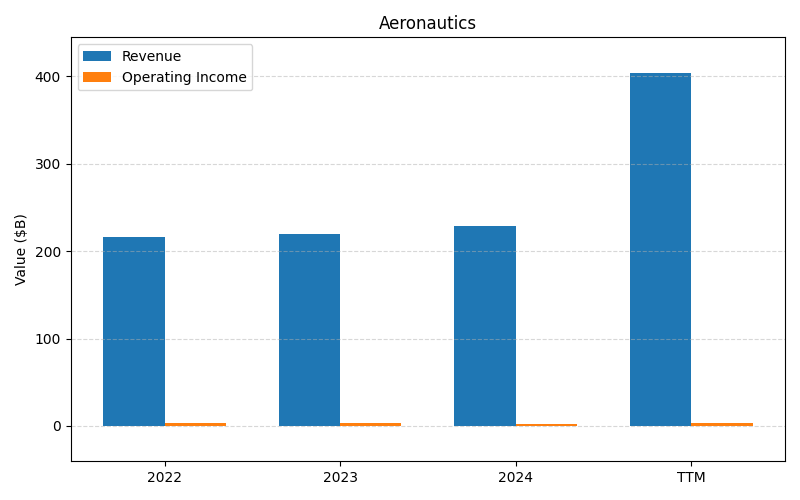
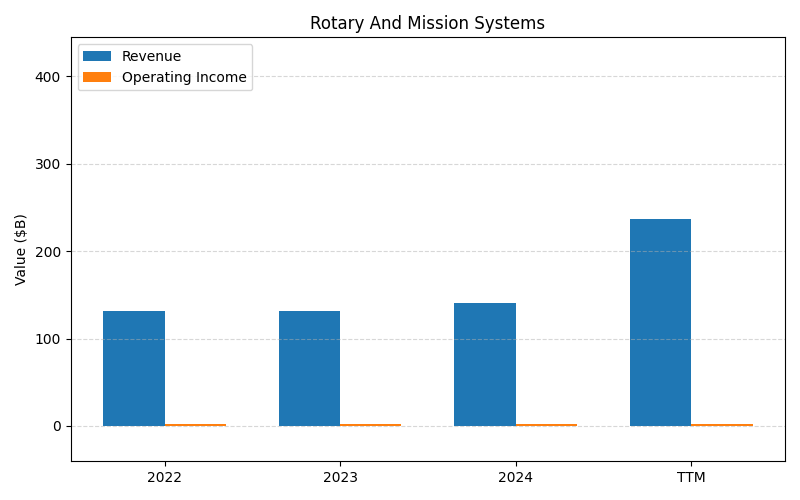
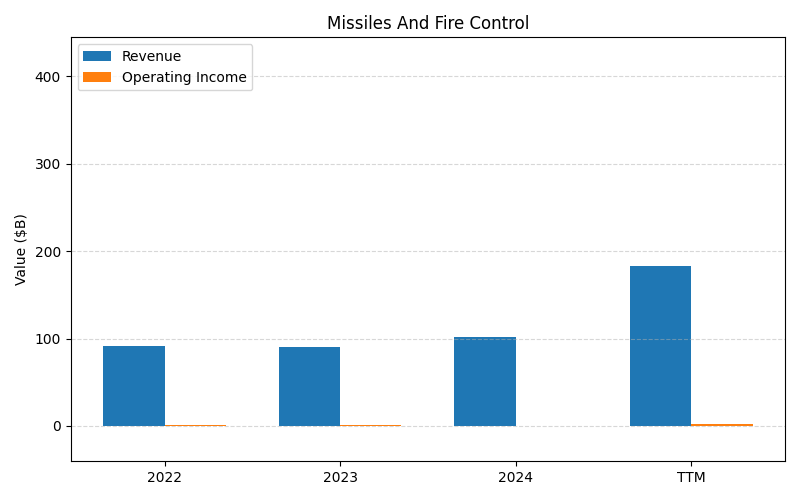
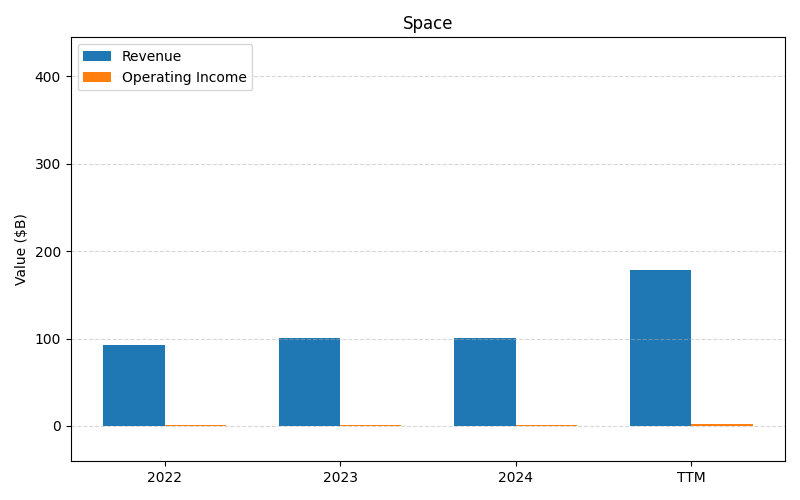
SEGMENTS v2025-09-09 · 2026-05-29 09:10 UTC — Units: $B. Rows list fiscal years (last 3 + TTM) with revenue and operating income for each segment; the final row shows the TTM revenue mix (operating income columns display “—” where mix is not applicable).
| Year | Aeronautics Rev | Aeronautics OI | Rotary And Mission Systems Rev | Rotary And Mission Systems OI | Missiles And Fire Control Rev | Missiles And Fire Control OI | Space Rev | Space OI | Total Rev | Total OI |
|---|---|---|---|---|---|---|---|---|---|---|
| 2023 | 220.1B | 2.83B | 132B | 1.86B | 90.7B | 1.54B | 101.2B | 1.16B | 544B | 7.39B |
| 2024 | 229.3B | 2.52B | 140.4B | 1.92B | 102.3B | 0.41B | 100.2B | 1.23B | 572.2B | 6.08B |
| 2025 | 242.4B | 2.09B | 140.9B | 1.32B | 116.5B | 1.99B | 104.6B | 1.34B | 604.3B | 6.74B |
| TTM | 583.7B | 5.95B | 346.7B | 4.19B | 274.5B | 3.37B | 257.7B | 3.23B | 1462.5B | 16.7B |
| % of Total (TTM) | 39.9% | — | 23.7% | — | 18.8% | — | 17.6% | — | 100% | — |
Balance Sheet
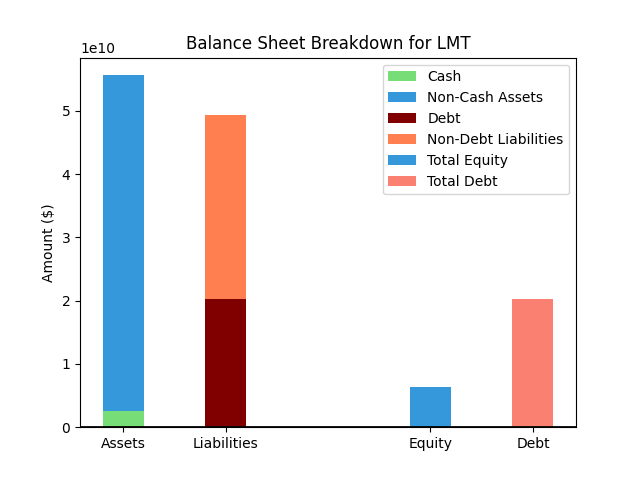
| Metric | Value | |
|---|---|---|
| 0 | Total Assets | $59,238M |
| 1 | Cash | $1,894M |
| 2 | Total Liabilities | $51,749M |
| 3 | Total Debt | $20,697M |
| 4 | Total Equity | $7,489M |
| 5 | Debt to Equity Ratio | 2.76 |
EPS & Dividend
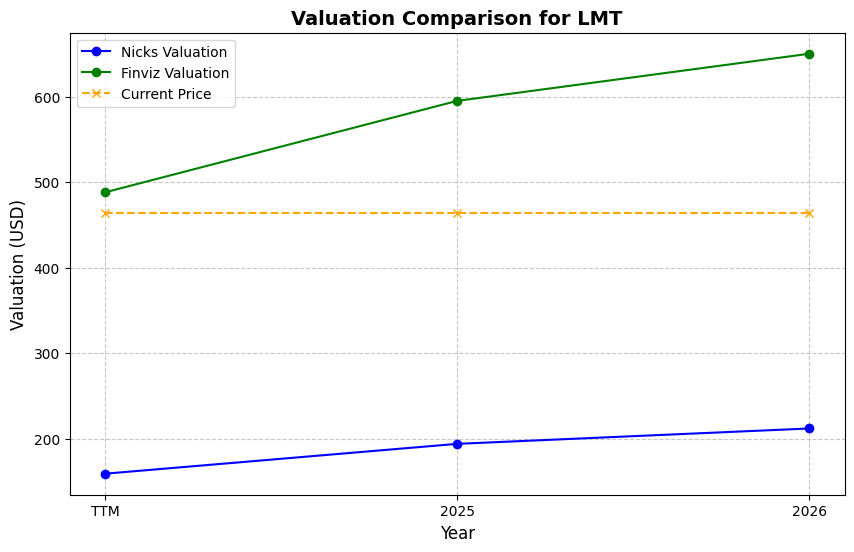
Valuation
| Share Price | Treasury Yield | Estimates | Fair Value (P/E) | Fair Value (P/S) | Current P/S | Current P/E |
|---|---|---|---|---|---|---|
| $530.45 | 4.5% | Nicks Growth: 1% Nick's Expected Margin: 15% FINVIZ Growth: 17% |
Nicks: 7 Finviz: 31 |
Nick's: 1.056 | 1.6 | 25.7 |
| Basis | Year | Nicks Valuation | Nicks vs Share Price | Finviz Valuation | Finviz vs Share Price |
|---|---|---|---|---|---|
| $20.63 EPS | TTM | $145.17 | -72.6% | $649.20 | 22.4% |
| $29.89 EPS | 2026 | $210.34 | -60.3% | $940.62 | 77.3% |
| $32.11 EPS | 2027 | $225.94 | -57.4% | $1010.38 | 90.5% |
Implied Growth
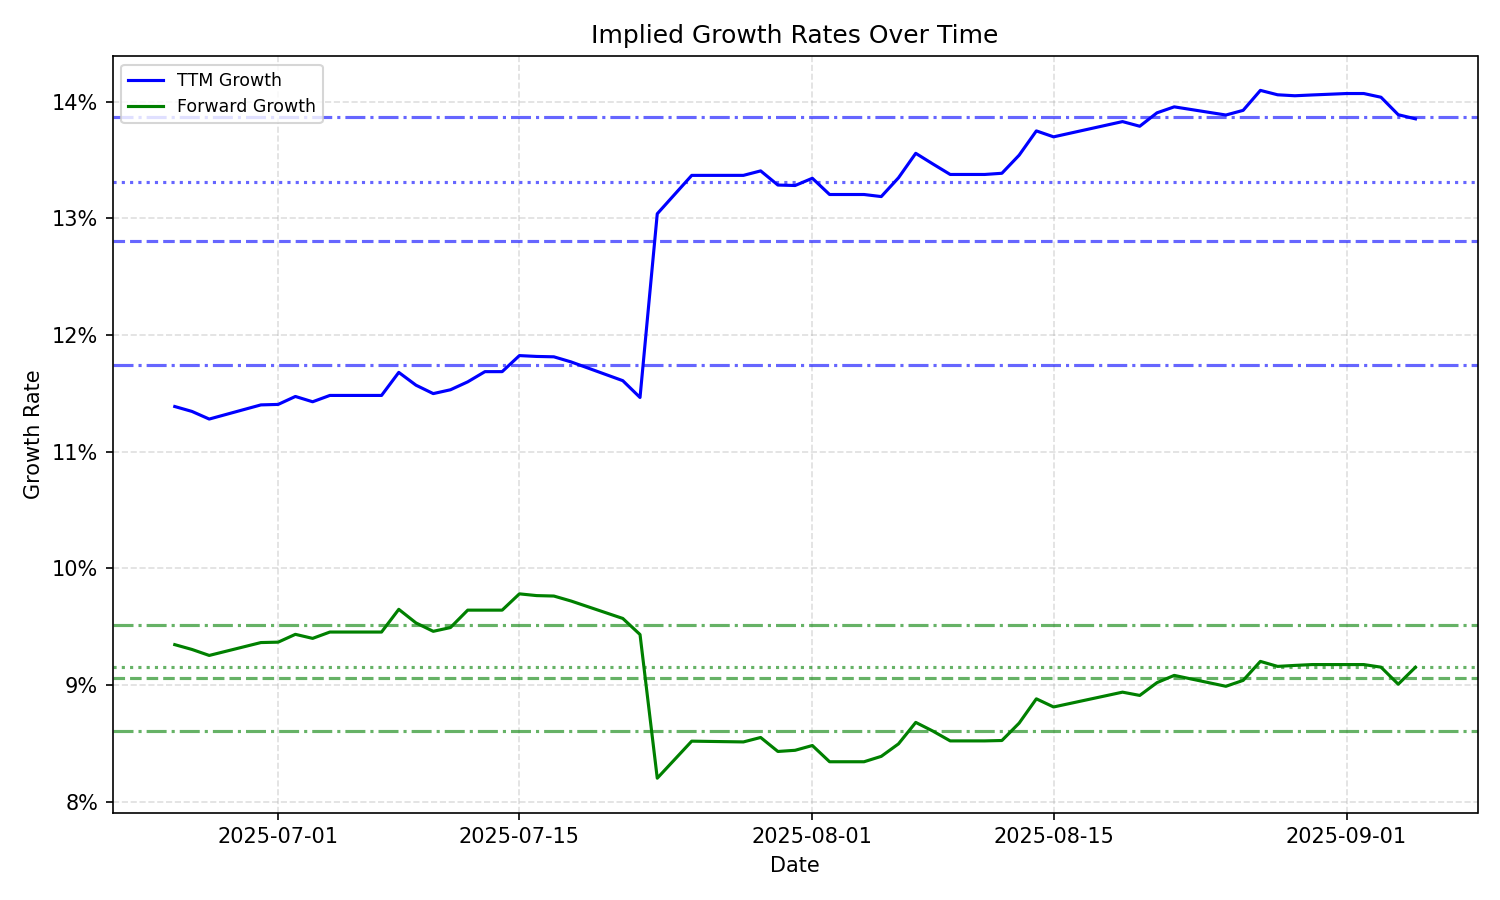
| Average | Median | Std Dev | Current | Percentile | ||||||
|---|---|---|---|---|---|---|---|---|---|---|
| TTM | Forward | TTM | Forward | TTM | Forward | TTM | Forward | TTM | Forward | |
| Timeframe | ||||||||||
| 1 Year | 14.41% | 9.90% | 14.40% | 9.61% | 1.28% | 0.97% | 14.50% | 9.74% | 53.3% | 57.4% |
| 3 Years | 14.41% | 9.90% | 14.40% | 9.61% | 1.28% | 0.97% | 14.50% | 9.74% | 53.3% | 57.4% |
| 5 Years | 14.41% | 9.90% | 14.40% | 9.61% | 1.28% | 0.97% | 14.50% | 9.74% | 53.3% | 57.4% |
| 10 Years | 14.41% | 9.90% | 14.40% | 9.61% | 1.28% | 0.97% | 14.50% | 9.74% | 53.3% | 57.4% |