Eli Lilly and Company — LLY
| Close Price | Market Cap | P/E Ratio | Forward P/E Ratio | Implied Growth* | Implied Forward Growth* | Dividend | P/B Ratio |
|---|---|---|---|---|---|---|---|
| $1105.00 | $985.37B | 39.2 | 24.8 | 19.1% | 14.0% | $6.92 0.6% | 31.6 |
Latest Headlines
- · Supreme Court Verdict Tests Eli Lilly Valuation And Legal Risk Outlook
- · Dow Jones Futures: Market Hits Highs On Iran Hopes; Nvidia, Tesla Lead 5 Trillion-Dollar Stocks Near Buy Points
- · Eli Lilly (LLY): Top Healthcare Stock Pick of Claude AI
- · Eli Lilly Breaks Out Amid Vaccine Push; Three More Stocks At Highs
- · LLY Stock Gains 4% to All-Time High: Is Obesity Access the Catalyst?
- · Lilly Reopens Zepbound Access For 10 Million US Patients
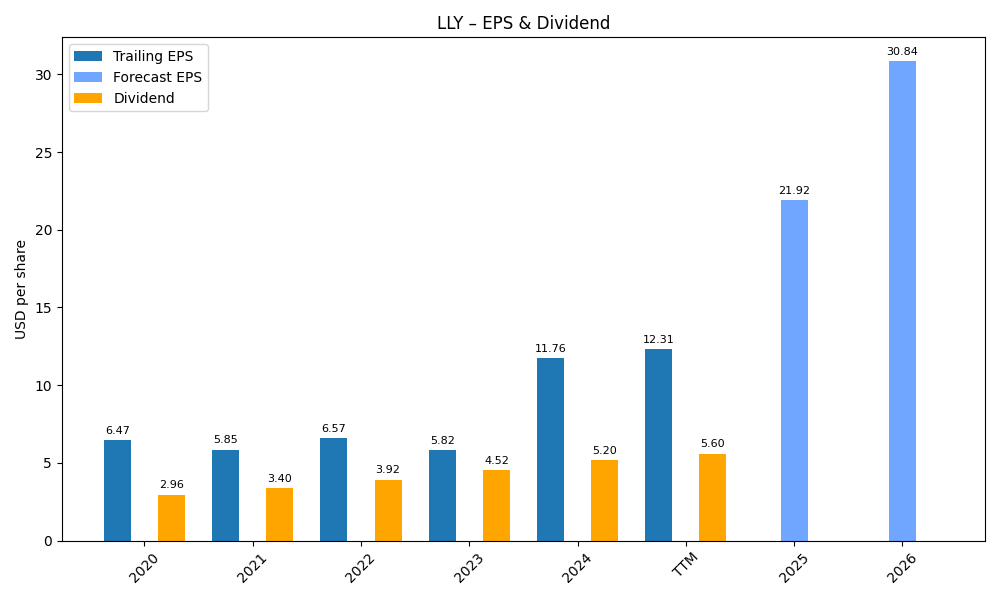
Revenue & Net Income
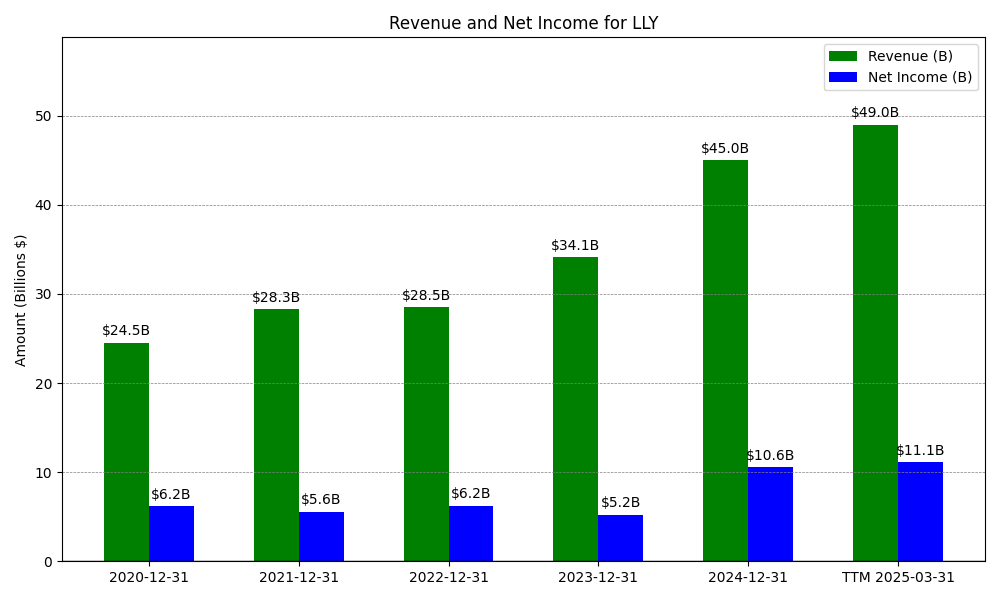
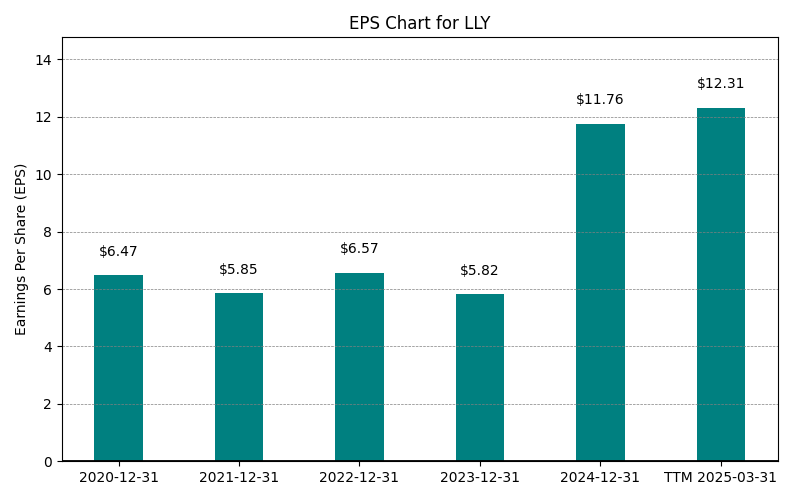
| Date | Revenue | Net_Income | EPS | Last_Updated | Revenue_Change | Net_Income_Change | EPS_Change | |
|---|---|---|---|---|---|---|---|---|
| 0 | 2020-12-31 | $24,540M | $6,194M | $6.47 | 2024-05-27 15:34:39 | N/A | N/A | N/A |
| 1 | 2021-12-31 | $28,318M | $5,582M | $6.57 | 2026-02-13 08:40:17 | 15.4% | -9.9% | 1.5% |
| 2 | 2022-12-31 | $28,541M | $6,245M | $6.57 | 2026-05-29 09:10:36 | 0.8% | 11.9% | 0.0% |
| 3 | 2023-12-31 | $34,124M | $5,240M | $5.83 | 2026-05-29 09:10:36 | 19.6% | -16.1% | -11.3% |
| 4 | 2024-12-31 | $45,043M | $10,590M | $11.80 | 2026-05-29 09:10:36 | 32.0% | 102.1% | 102.5% |
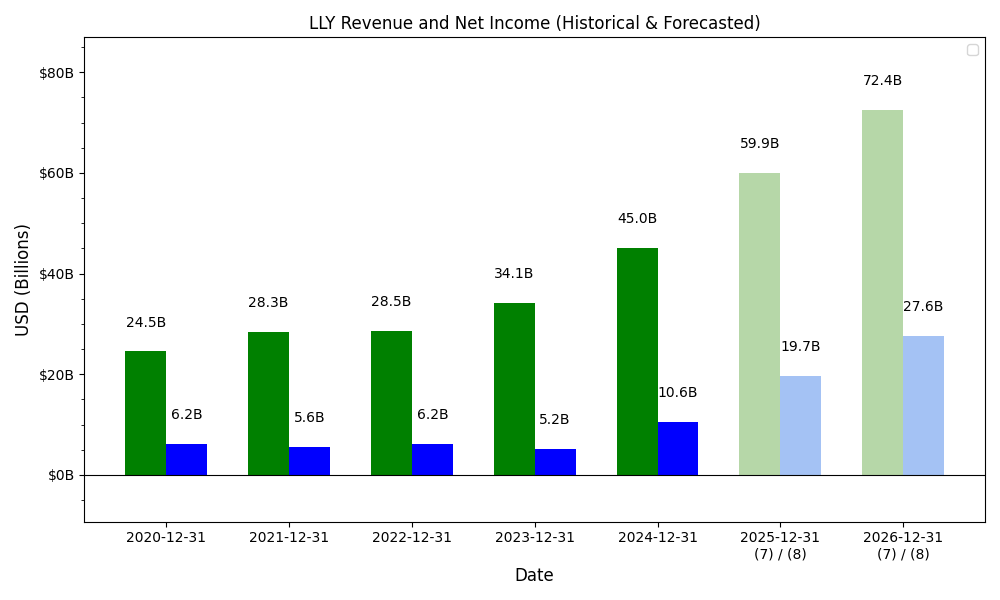
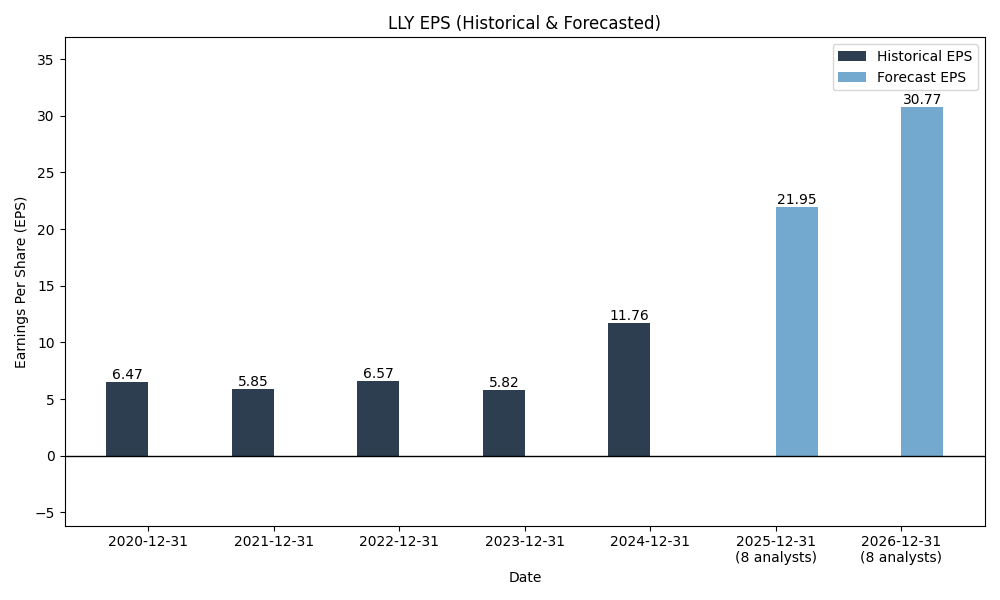
| 5 | 2025-12-31 | $65,179M | $20,640M | $23.07 | 2026-05-29 09:10:36 | 44.7% | 94.9% | 95.5% |
| 6 | TTM 2026-03-31 | $72,250M | $25,277M | $28.17 | 2026-05-01 08:43:48 | 10.8% | 22.5% | 22.1% |
EPS
Forecasts
Y/Y % Change
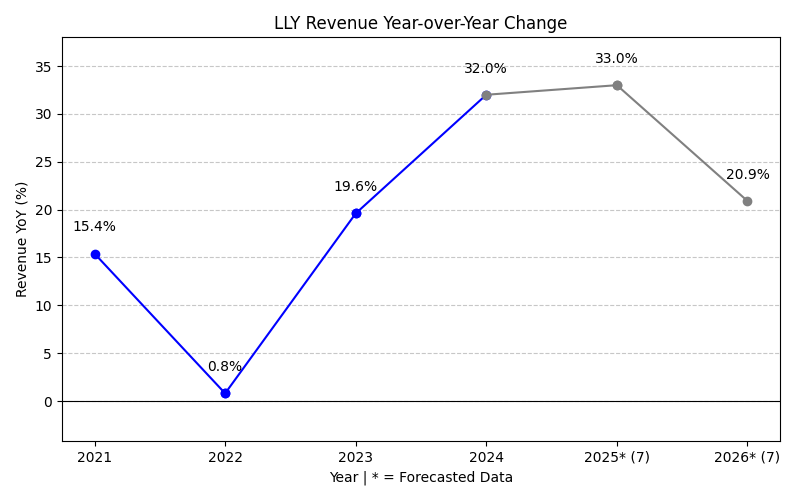
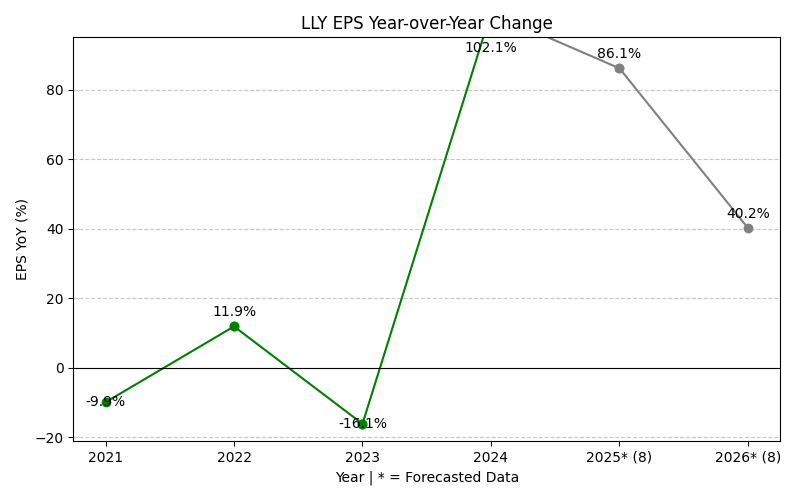
LLY Year-over-Year Growth
| 2020 | 2021 | 2022 | 2023 | 2024 | 2025 | 2026 | 2027 | Average | |
|---|---|---|---|---|---|---|---|---|---|
| Revenue Growth (%) | 15.4% | 0.8% | 19.6% | 32.0% | 44.7% | 31.0% | 14.9% | 22.6% | |
| Revenue Analysts (#) | 0 | 0 | 0 | 0 | 0 | 0 | 24 | 28 | |
| EPS Growth (%) | -9.9% | 11.9% | -16.1% | 102.1% | 94.9% | 56.3% | 22.9% | 37.4% | |
| EPS Analysts (#) | 0 | 0 | 0 | 0 | 0 | 0 | 28 | 28 |
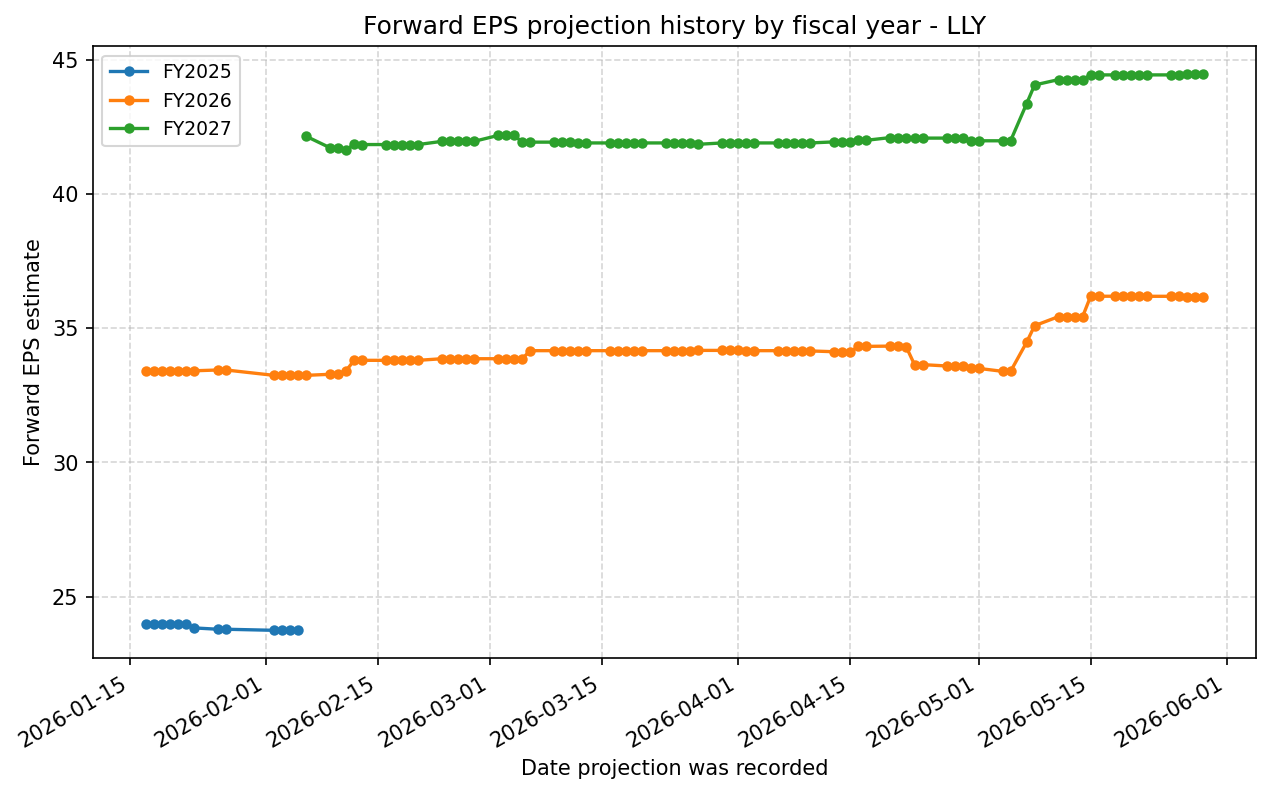
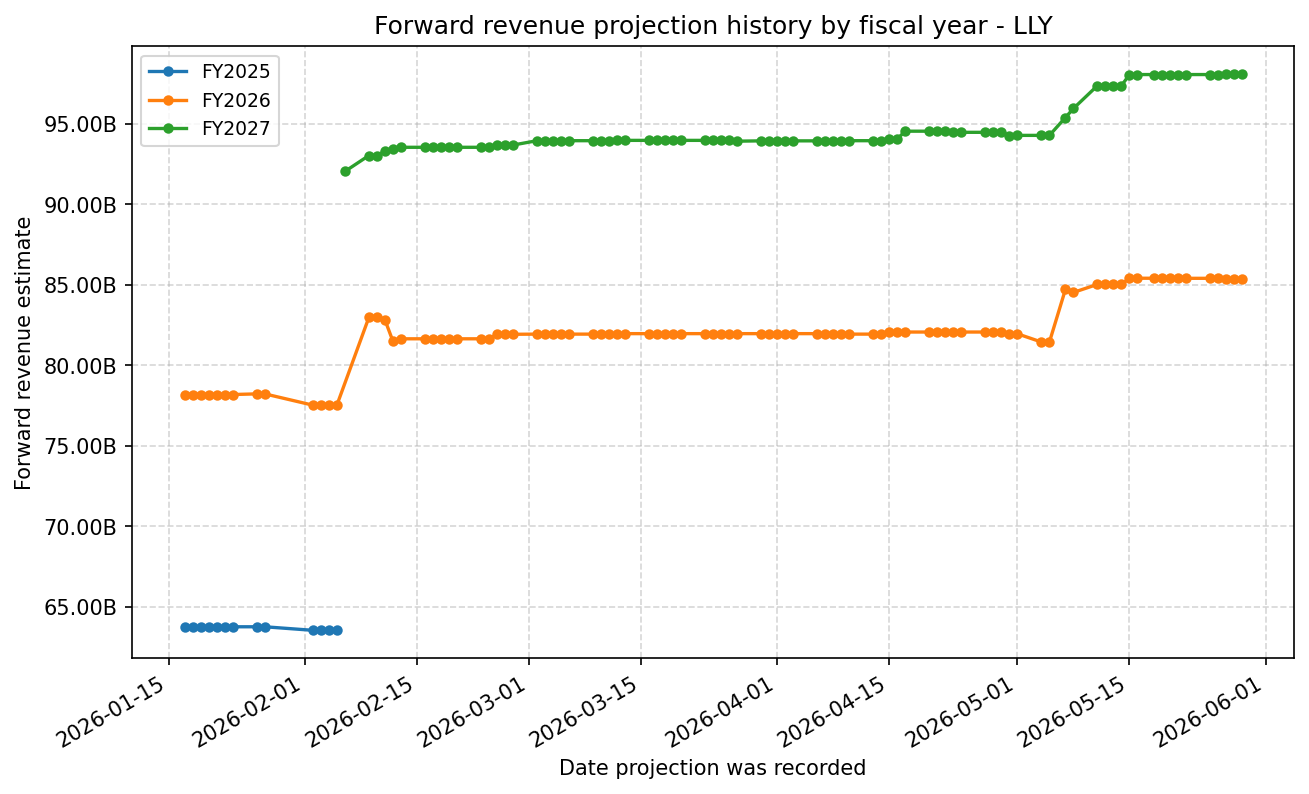
Forward Estimate History
How the next-FY EPS and revenue estimates have drifted over time. One line per fiscal year – past lines end when that FY became current.
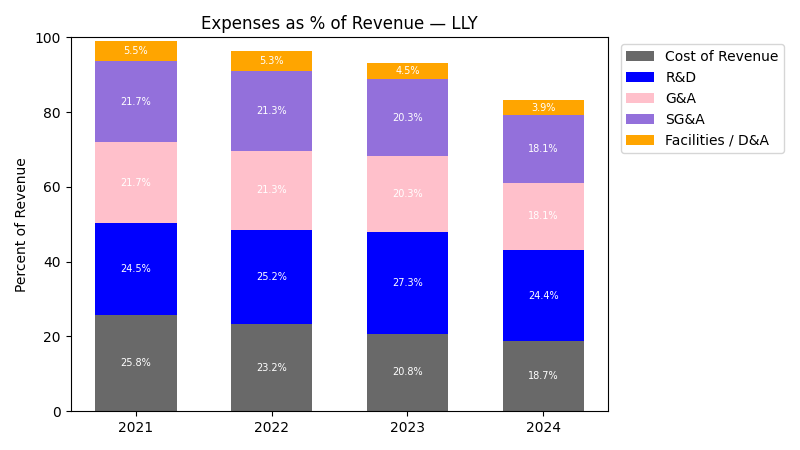
Expenses
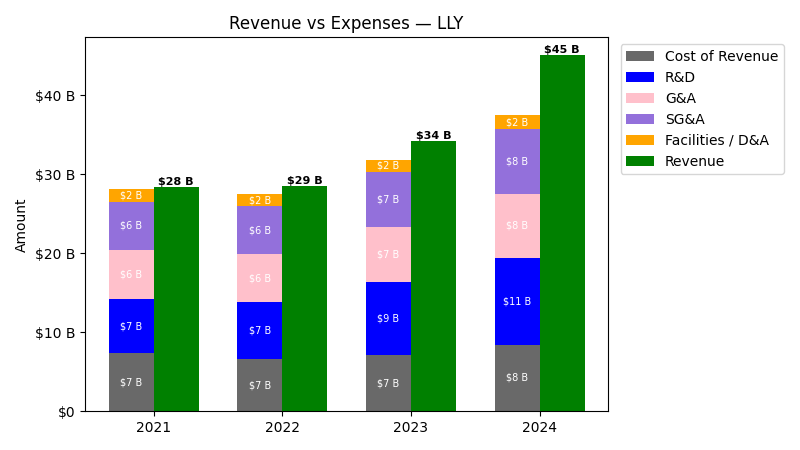
| Year | Revenue ($) | Cost of Revenue ($) | R&D ($) | G&A ($) | SG&A ($) | Facilities / D&A ($) | Personnel ($) |
|---|---|---|---|---|---|---|---|
| 2022 | $28.5B | $5.1B | $7.2B | $6.4B | $6.4B | $1.5B | $-372.9M |
| 2023 | $34.1B | $5.6B | $9.3B | $7.4B | $7.4B | $1.5B | $-461.9M |
| 2024 | $45.0B | $6.7B | $11.0B | $8.6B | $8.6B | $1.8B | $-461.7M |
| 2025 | $65.2B | $9.1B | $13.3B | $0.0 | $11.1B | $2.0B | $0.0 |
| TTM | $72.2B | $10.4B | $14.1B | $5.5B | $11.6B | $2.0B | $-219.4M |
| Year | Revenue Change (%) | Cost of Revenue Change (%) | R&D Change (%) | G&A Change (%) | SG&A Change (%) | Facilities / D&A Change (%) | Personnel Change (%) |
|---|---|---|---|---|---|---|---|
| 2023 | 19.56 | 8.77 | 29.51 | 14.95 | 14.96 | 0.30 | 23.87 |
| 2024 | 32.00 | 19.73 | 18.02 | 16.08 | 16.07 | 15.72 | -0.04 |
| 2025 | 44.70 | 36.14 | 21.34 | -100.00 | 29.09 | 13.02 | -100.00 |
| TTM | 10.85 | 14.43 | 5.82 | inf | 4.19 | 2.30 | -inf |
No unmapped expenses.
Segment Performance
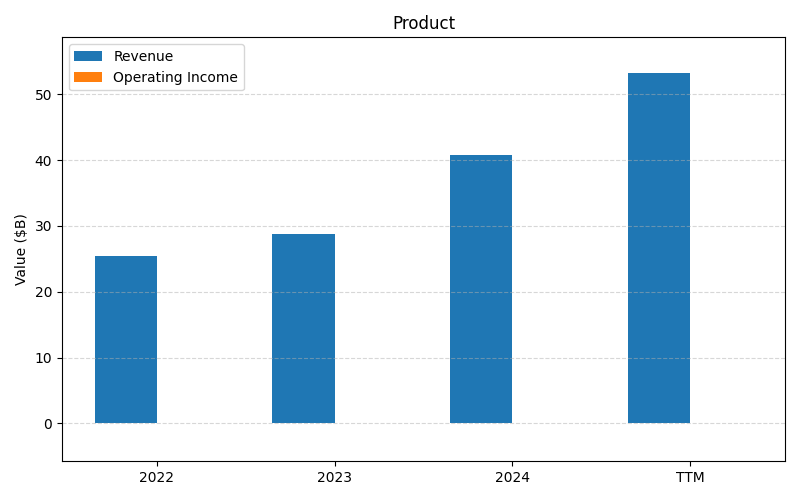
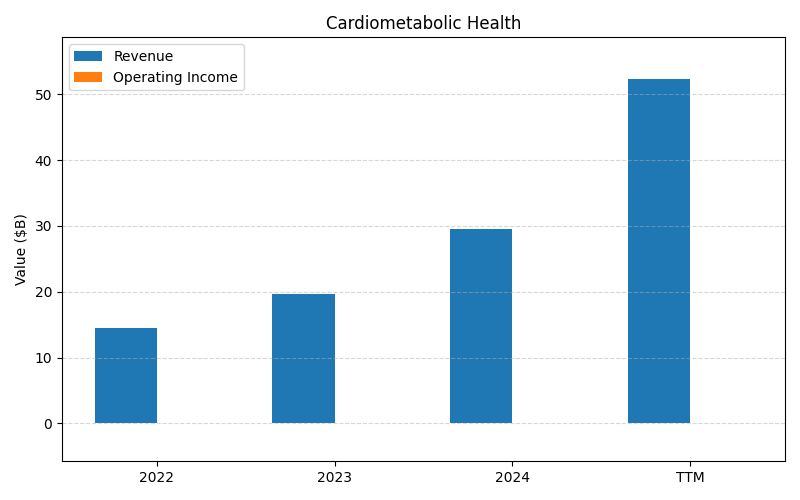
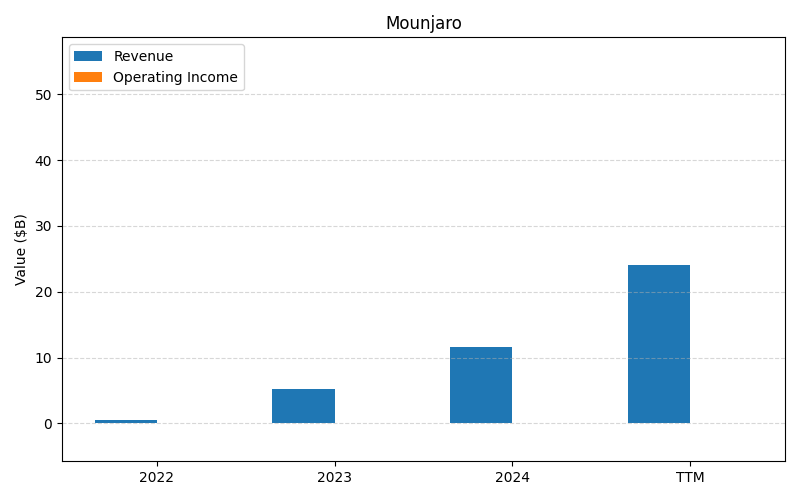
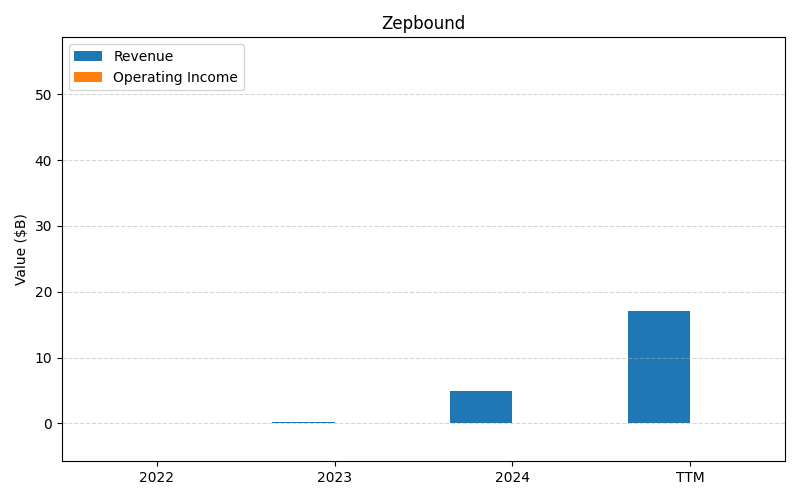
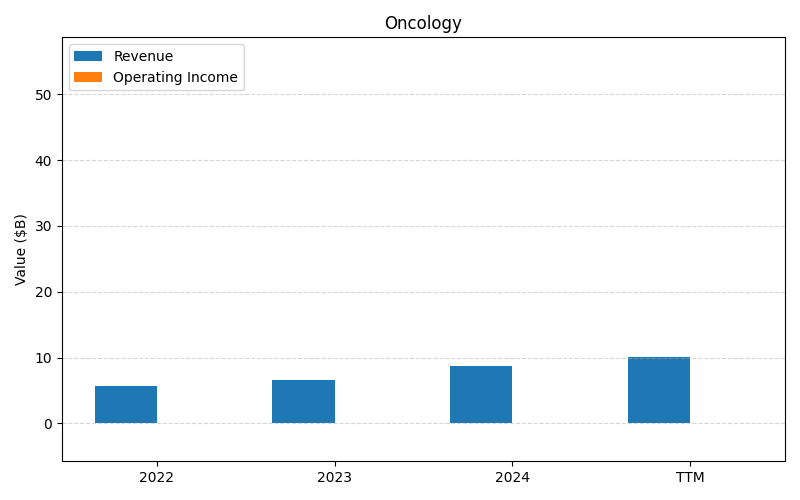
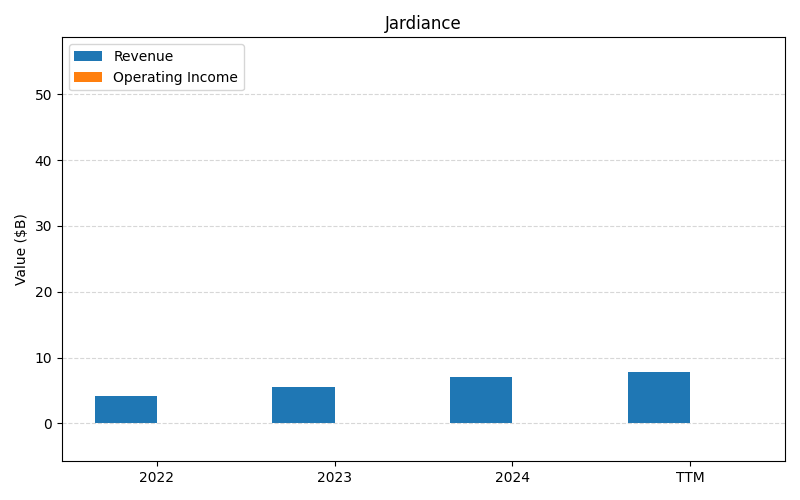
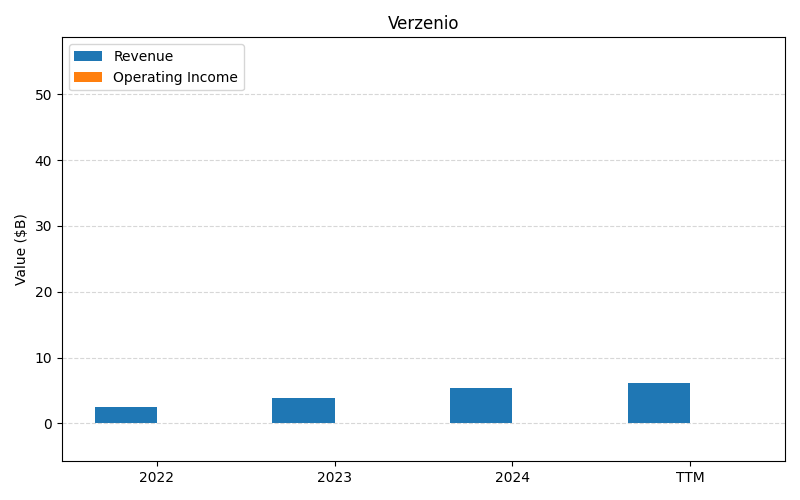
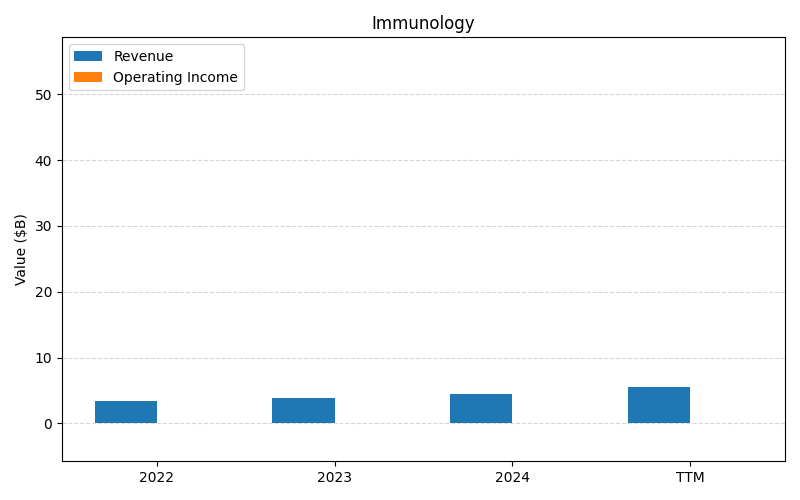
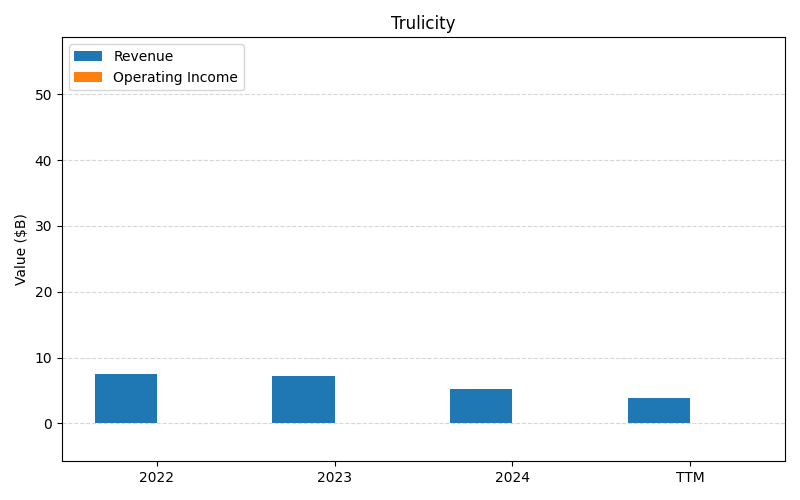
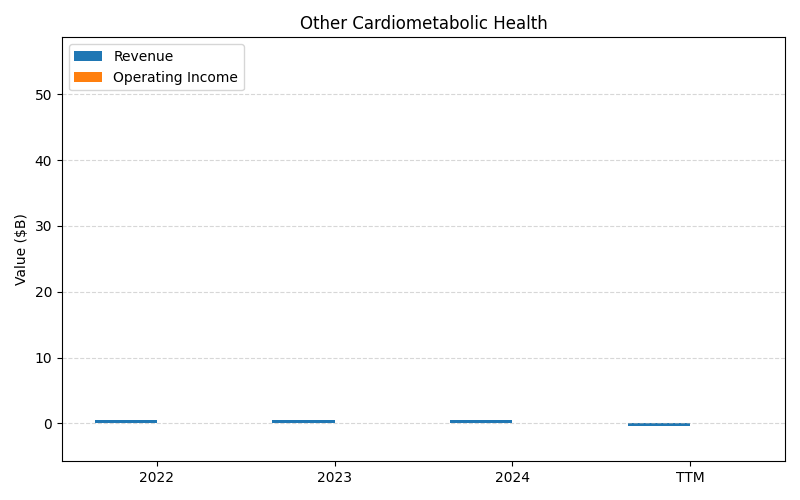
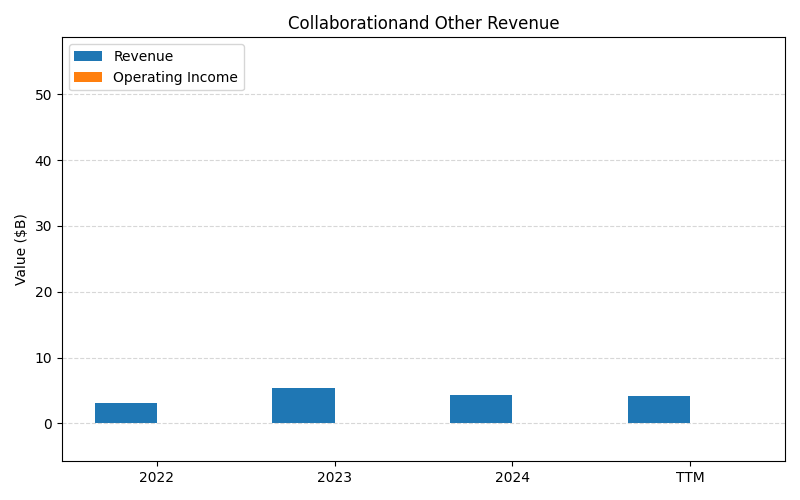
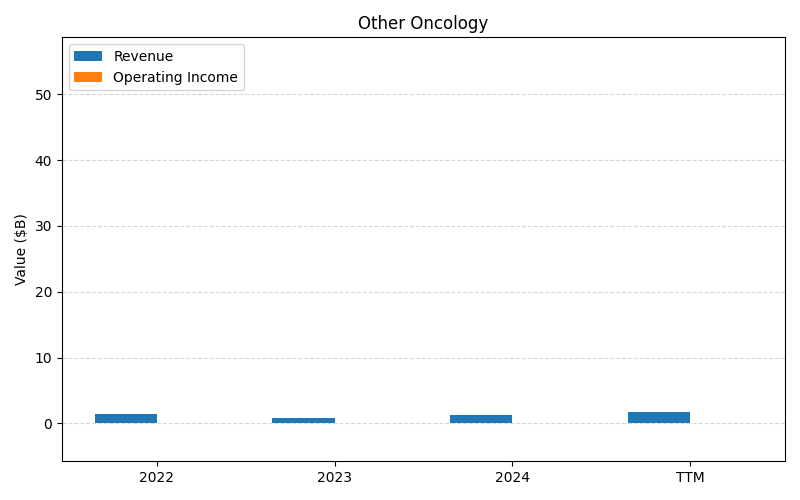
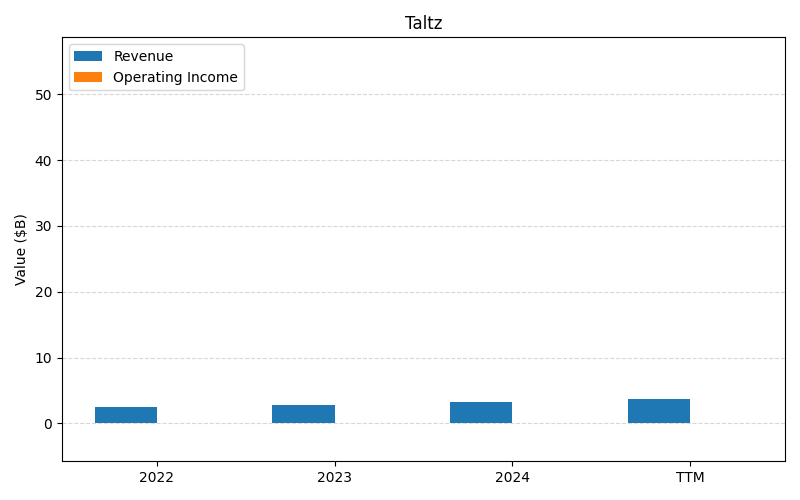
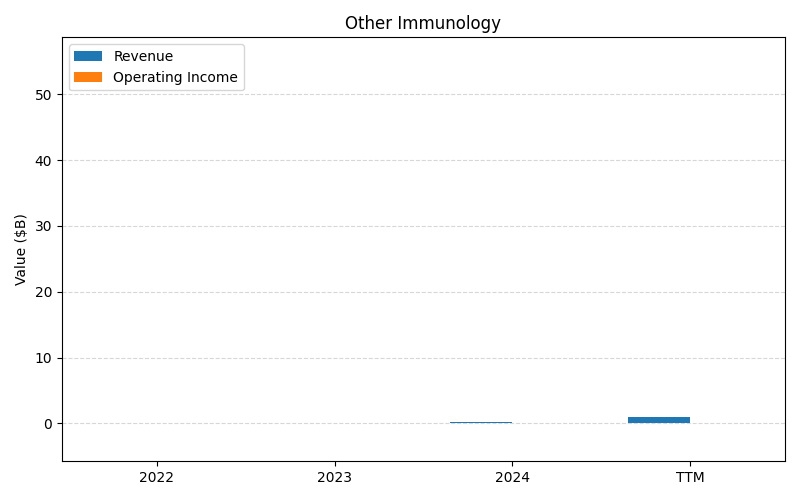
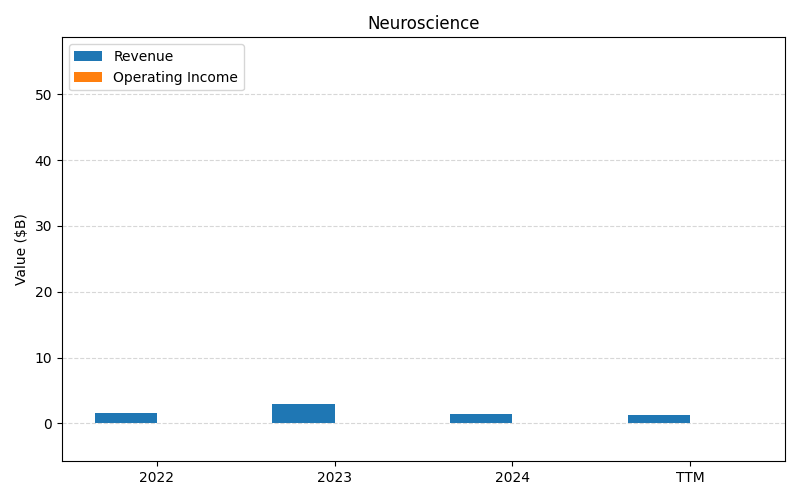
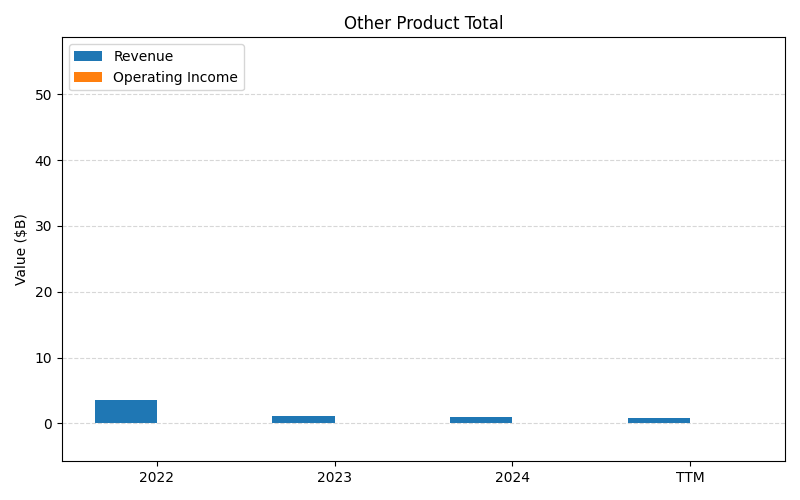
SEGMENTS v2025-09-09 · 2026-05-29 09:10 UTC — Units: $B. Rows list fiscal years (last 3 + TTM) with revenue for each segment; the final row shows the TTM revenue mix (operating income columns display “—” where mix is not applicable).
| Year | Prod Rev | Cardiometabolic Health Rev | Mounjaro Rev | Zepbound Rev | Oncology Rev | Jardiance Rev | Verzenio Rev | Immunology Rev | Trulicity Rev | Other Cardiometabolic Health Rev | Collaborationand Other Revenue Rev | Other Oncology Rev | Taltz Rev | Other Immunology Rev | Neuroscience Rev | Other Product Total Rev | Total Rev |
|---|---|---|---|---|---|---|---|---|---|---|---|---|---|---|---|---|---|
| 2023 | 28.8B | 19.7B | 5.16B | 0.18B | 6.66B | 5.49B | 3.86B | 3.80B | 7.13B | 4.45B | 5.31B | 2.79B | 2.76B | 1.04B | 2.88B | 1.12B | 101.1B |
| 2024 | 40.7B | 29.5B | 11.5B | 4.93B | 8.75B | 6.98B | 5.31B | 4.39B | 5.25B | 4.46B | 4.29B | 3.45B | 3.26B | 1.13B | 1.47B | 0.90B | 136.4B |
| 2025 | 61B | 48.2B | 23B | 13.5B | 9.38B | 7.43B | 5.72B | 5.25B | 4.28B | 4.01B | 4.22B | 3.65B | 3.56B | 1.68B | 1.39B | 0.94B | 197.2B |
| TTM | 131.8B | 127.7B | 59.5B | 31.4B | 26.6B | 21.4B | 16B | 14.2B | 13.6B | 12.2B | 11B | 10.6B | 9.81B | 4.41B | 4.17B | – | 494.2B |
| % of Total (TTM) | 26.7% | 25.8% | 12.0% | 6.4% | 5.4% | 4.3% | 3.2% | 2.9% | 2.7% | 2.5% | 2.2% | 2.1% | 2.0% | 0.9% | 0.8% | – | 100% |
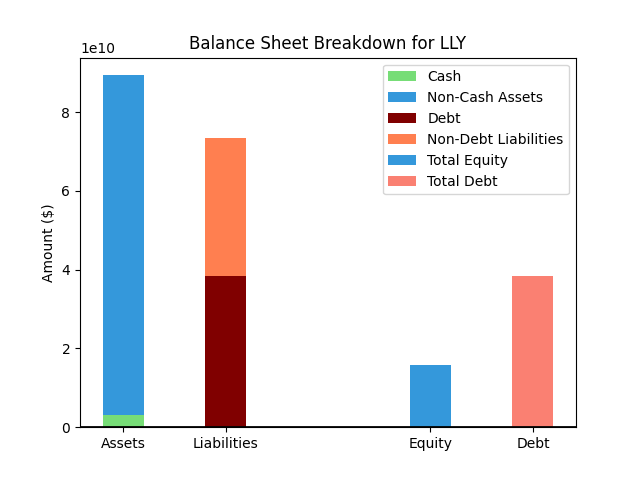
Balance Sheet
| Metric | Value | |
|---|---|---|
| 0 | Total Assets | $116,576M |
| 1 | Cash | $5,282M |
| 2 | Total Liabilities | $85,378M |
| 3 | Total Debt | $43,370M |
| 4 | Total Equity | $31,198M |
| 5 | Debt to Equity Ratio | 1.39 |
EPS & Dividend
Valuation
| Share Price | Treasury Yield | Estimates | Fair Value (P/E) | Fair Value (P/S) | Current P/S | Current P/E |
|---|---|---|---|---|---|---|
| $1105.00 | 4.5% | FINVIZ Growth: 28% | Nicks: 6 Finviz: 86 |
Nick's: 0.000 | 13.6 | 39.2 |
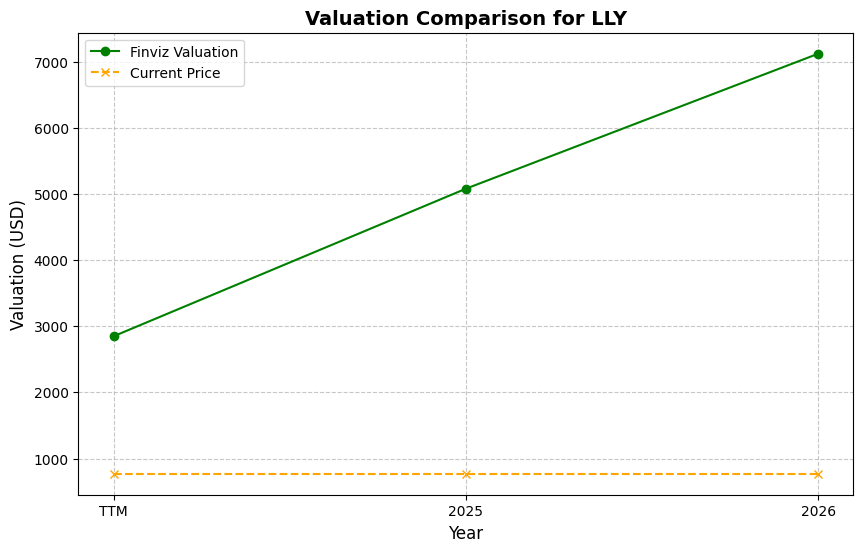
| Basis | Year | Nicks Valuation | Nicks vs Share Price | Finviz Valuation | Finviz vs Share Price |
|---|---|---|---|---|---|
| $28.17 EPS | TTM | $178.63 | -83.8% | $2424.37 | 119.4% |
| $36.18 EPS | 2026 | $229.41 | -79.2% | $3113.52 | 181.8% |
| $44.47 EPS | 2027 | $281.99 | -74.5% | $3827.21 | 246.4% |
Implied Growth
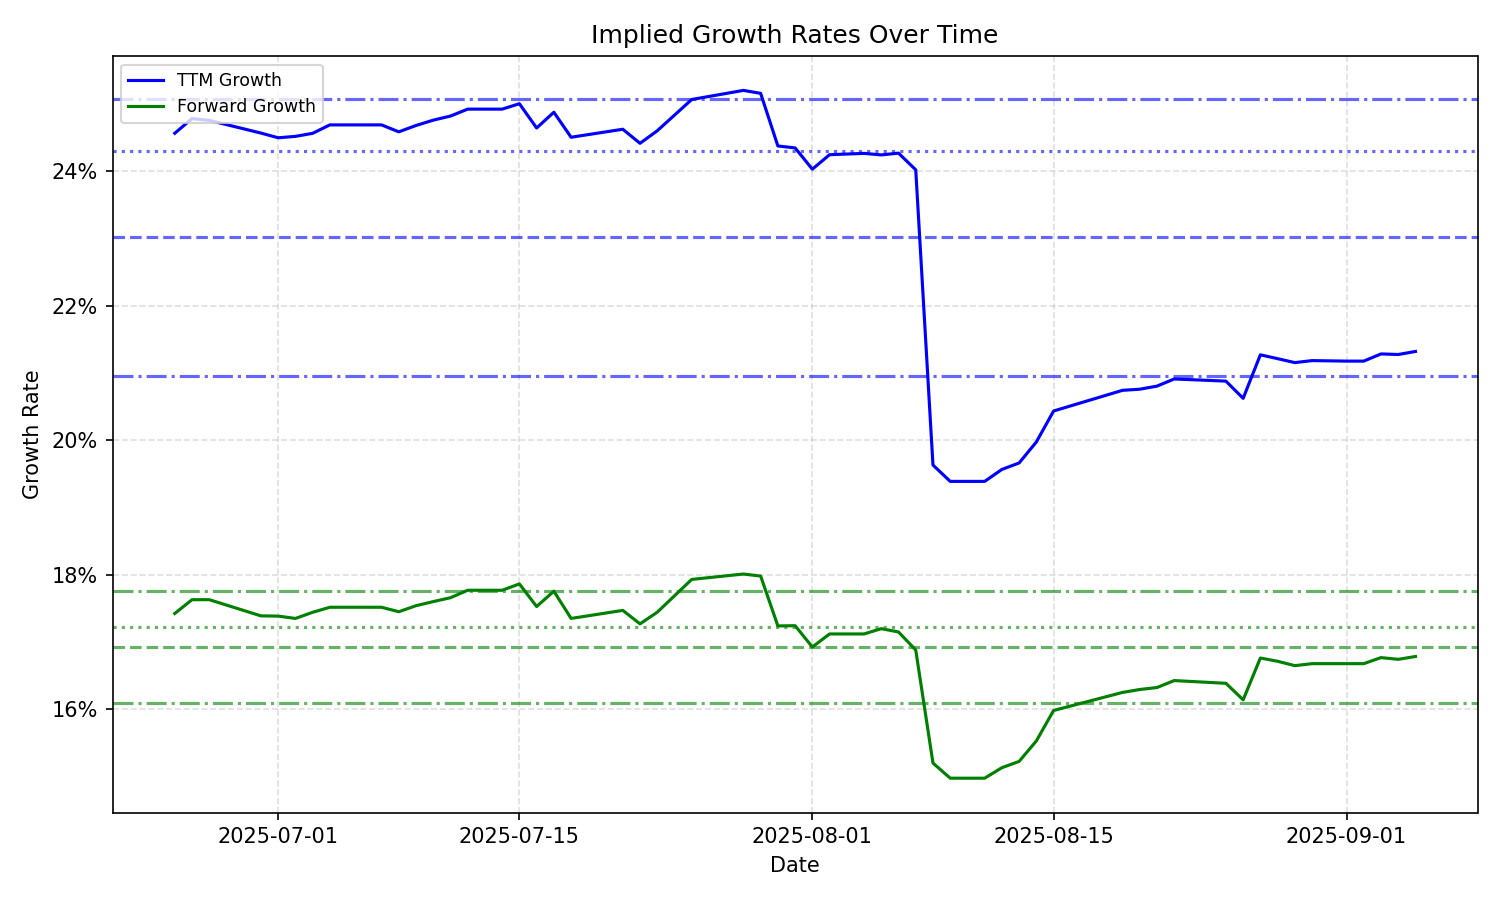
| Average | Median | Std Dev | Current | Percentile | ||||||
|---|---|---|---|---|---|---|---|---|---|---|
| TTM | Forward | TTM | Forward | TTM | Forward | TTM | Forward | TTM | Forward | |
| Timeframe | ||||||||||
| 1 Year | 21.22% | 16.03% | 21.27% | 16.73% | 1.92% | 2.52% | 19.32% | 14.20% | 18.7% | 33.6% |
| 3 Years | 21.22% | 16.03% | 21.27% | 16.73% | 1.92% | 2.52% | 19.32% | 14.20% | 18.7% | 33.6% |
| 5 Years | 21.22% | 16.03% | 21.27% | 16.73% | 1.92% | 2.52% | 19.32% | 14.20% | 18.7% | 33.6% |
| 10 Years | 21.22% | 16.03% | 21.27% | 16.73% | 1.92% | 2.52% | 19.32% | 14.20% | 18.7% | 33.6% |